Today we had a series of deep focus earthquakes in Peru. This suite of earthquakes occurred in a region that ruptured in the 1960s and recently in 1990. Further to the south, in 1994, there was a deep earthquake that was oriented differently than the 1960s, 1990, and 2015 earthquakes. The plate boundary here is formed by the Nazca plate that subducts beneath the South America plate, forming the Peru-Chile subduction zone.
-
Here are the USGS web pages for the two M = 7.6 earthquake from today.
- 2015.11.24 22:45 M 7.6
- 2015.11.24 22:50 M 7.6
Here is an update to this report.
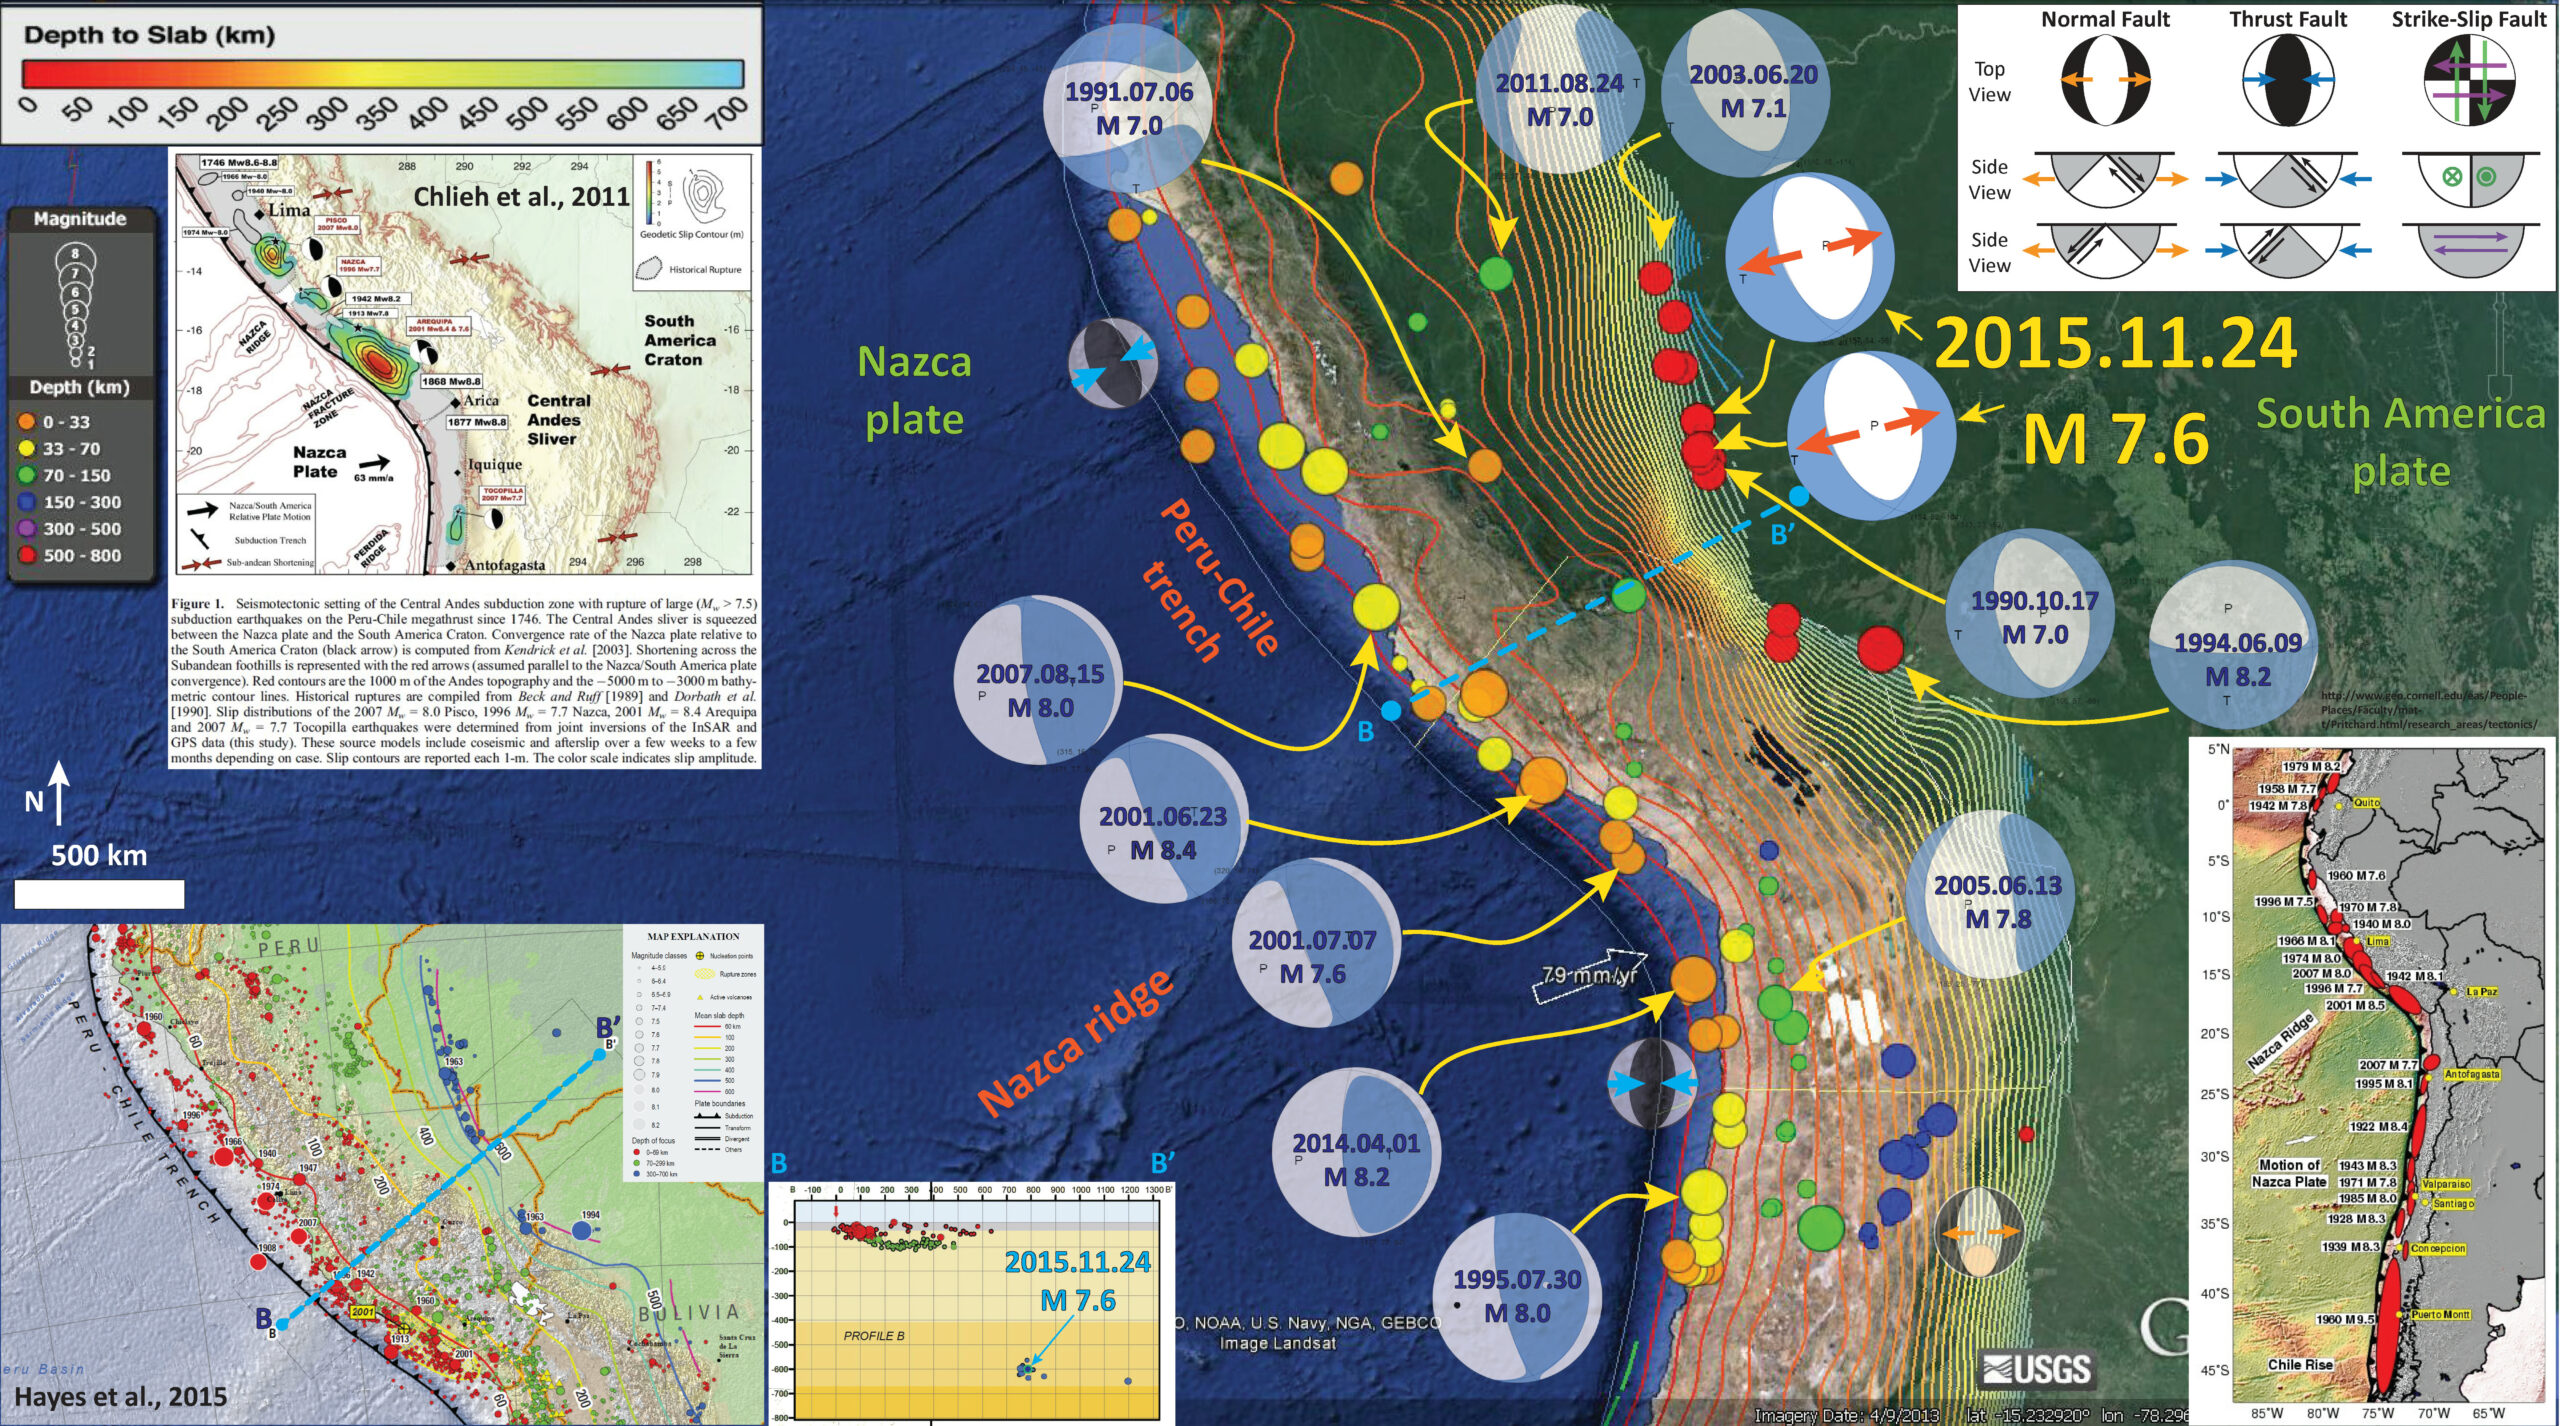
Below is my interpretation map. The epicenters from the past month, with magnitudes greater than M = 2.5 are plotted, as well as epicenters from earthquakes since 1990 with magnitudes greater than M = 7.0. I list these earthquakes in a table below. Here is the kml file that I used to make this map. Here is the query that I used to create that kml file. I have plotted moment tensors for some of the largest earthquakes in this region. I also plot the slab contours from Hayes et al. (2012). These contours show the depth where we think that the subduction zone fault may be. These contours are largely based upon seismicity. The hypocentral depths for these deep earthquakes are deeper than the slab depth from Hayes et al. (2012).
In the lower left corner, I plot earthquake slip patches as plotted by Matt Pritchard, faculty at the Cornell Earth and Atmospheric Sciences: pritchard at cornell.edu. In the lower left corner I include an inset map from the USGS Open File Report 2015-1031-E (Hayes et al., 2015), along with a cross section of seismicity from B-B’. The 1963 epicenter is located on the map and the blue colored hypocenters plot approximately where today’s earthquake would plot.
In the upper left corner, I place Figure 1 from Chlieh et al. (2011). This is a map that shows instrumental and historic earthquake rupture regions. This figure from Chlieh et al. (2011) shows the slip models (earthquake slip in meters) and earthquake slip regions for pre-seismologic (prior to seismometers) earthquakes in grey.
I placed a moment tensor / focal mechanism legend in the upper right corner of the map. There is more material from the USGS web sites about moment tensors and focal mechanisms (the beach ball symbols). Both moment tensors and focal mechanisms are solutions to seismologic data that reveal two possible interpretations for fault orientation and sense of motion. One must use other information, like the regional tectonics, to interpret which of the two possibilities is more likely.
Based on our knowledge of subduction zones and plate tectonics, the hypocentral depths, the moment tensor, and the slab contour depths, I interpret the M 7.6 earthquake to be in the downgoing Nazca plate. The plate is undergoing extension from the downgoing slab and this is the likely source of extension for the earthquakes in this region. Some subducting slabs bend, which causes bending moment normal faults. Based on plots of seismicity, it does not appear that the Nazca slab is bending in this way at this depth (typically, this bending is happening at a much shallower depth).

Here is the table for the earthquakes plotted in my interpretation map at the top of this page. Click on the image and a pdf will load. The html links are live in the pdf.

-
Here are two animations of the seismic waves propagating through the US Array, seismometers across the USA. The above one shows the vertical motion (red = up, blue = down). The second animation shows all three components (N-S and E-W = compass vector; red = up, blue = down). For each animation, first is a screen shot and below that is the embedded video. These animations are from IRIS, Trabant et al. (2012).
- Here is a link to the embedded video below. (11 MB mp4)
- Here is a link to the embedded video below. (30 MB mp4)


Below is a seismograph from Keele University (at hypocentre). The seismograph shows that these two earthquakes, that happened about 5 mins apart, also overlap on this seismograph record. The first two peaks in amplitude are the p-waves and the second two large peaks are the initiation of the s-waves at this seismometer. note how the time distance between the p-waves and the s-waves is similar. This is because these two earthquakes are about the same distance from the seismometer.

Initially, this earthquake was estimated to have a potential for significant damage. When earthquakes of a certain magnitude occur, the USGS (and other organizations) make estimates of ground shaking. These estimates are based on empirically numerical models based upon seismological observations from thousands of earthquakes. The initial computations are automatic, but are soon recalculated by real people given their interpretations of the tectonic setting. The original estimate of shaking seems to have been produced using a default hypocentral depth. Given a shallow depth, the shaking intensity would be larger than if the earthquake was deeper (further away, with more Earth material for the seismic waves to travel through and attenuate). Below are two maps showing the first model (more intense) result and the second (less intense) model result. The colored lines are the ground shaking contours using the Modified Mercalli Intensity scale (MMI). Here is the USGS page on MMI, but the wiki site is better.


The PAGER alerts, which are estimates of the extent of damage to people (casualties) and their possessions (economic losses). The PAGER alerts reflect this change. Here is the first PAGER alert (v. 1). Here is the second PAGER alert (v. 2).
We recently had some earthquakes further to the south of the subduction zone in Chile. Here is my latest Earthquake Report from that series of earthquakes in September of 2015. Below is my interpretation map from that report.
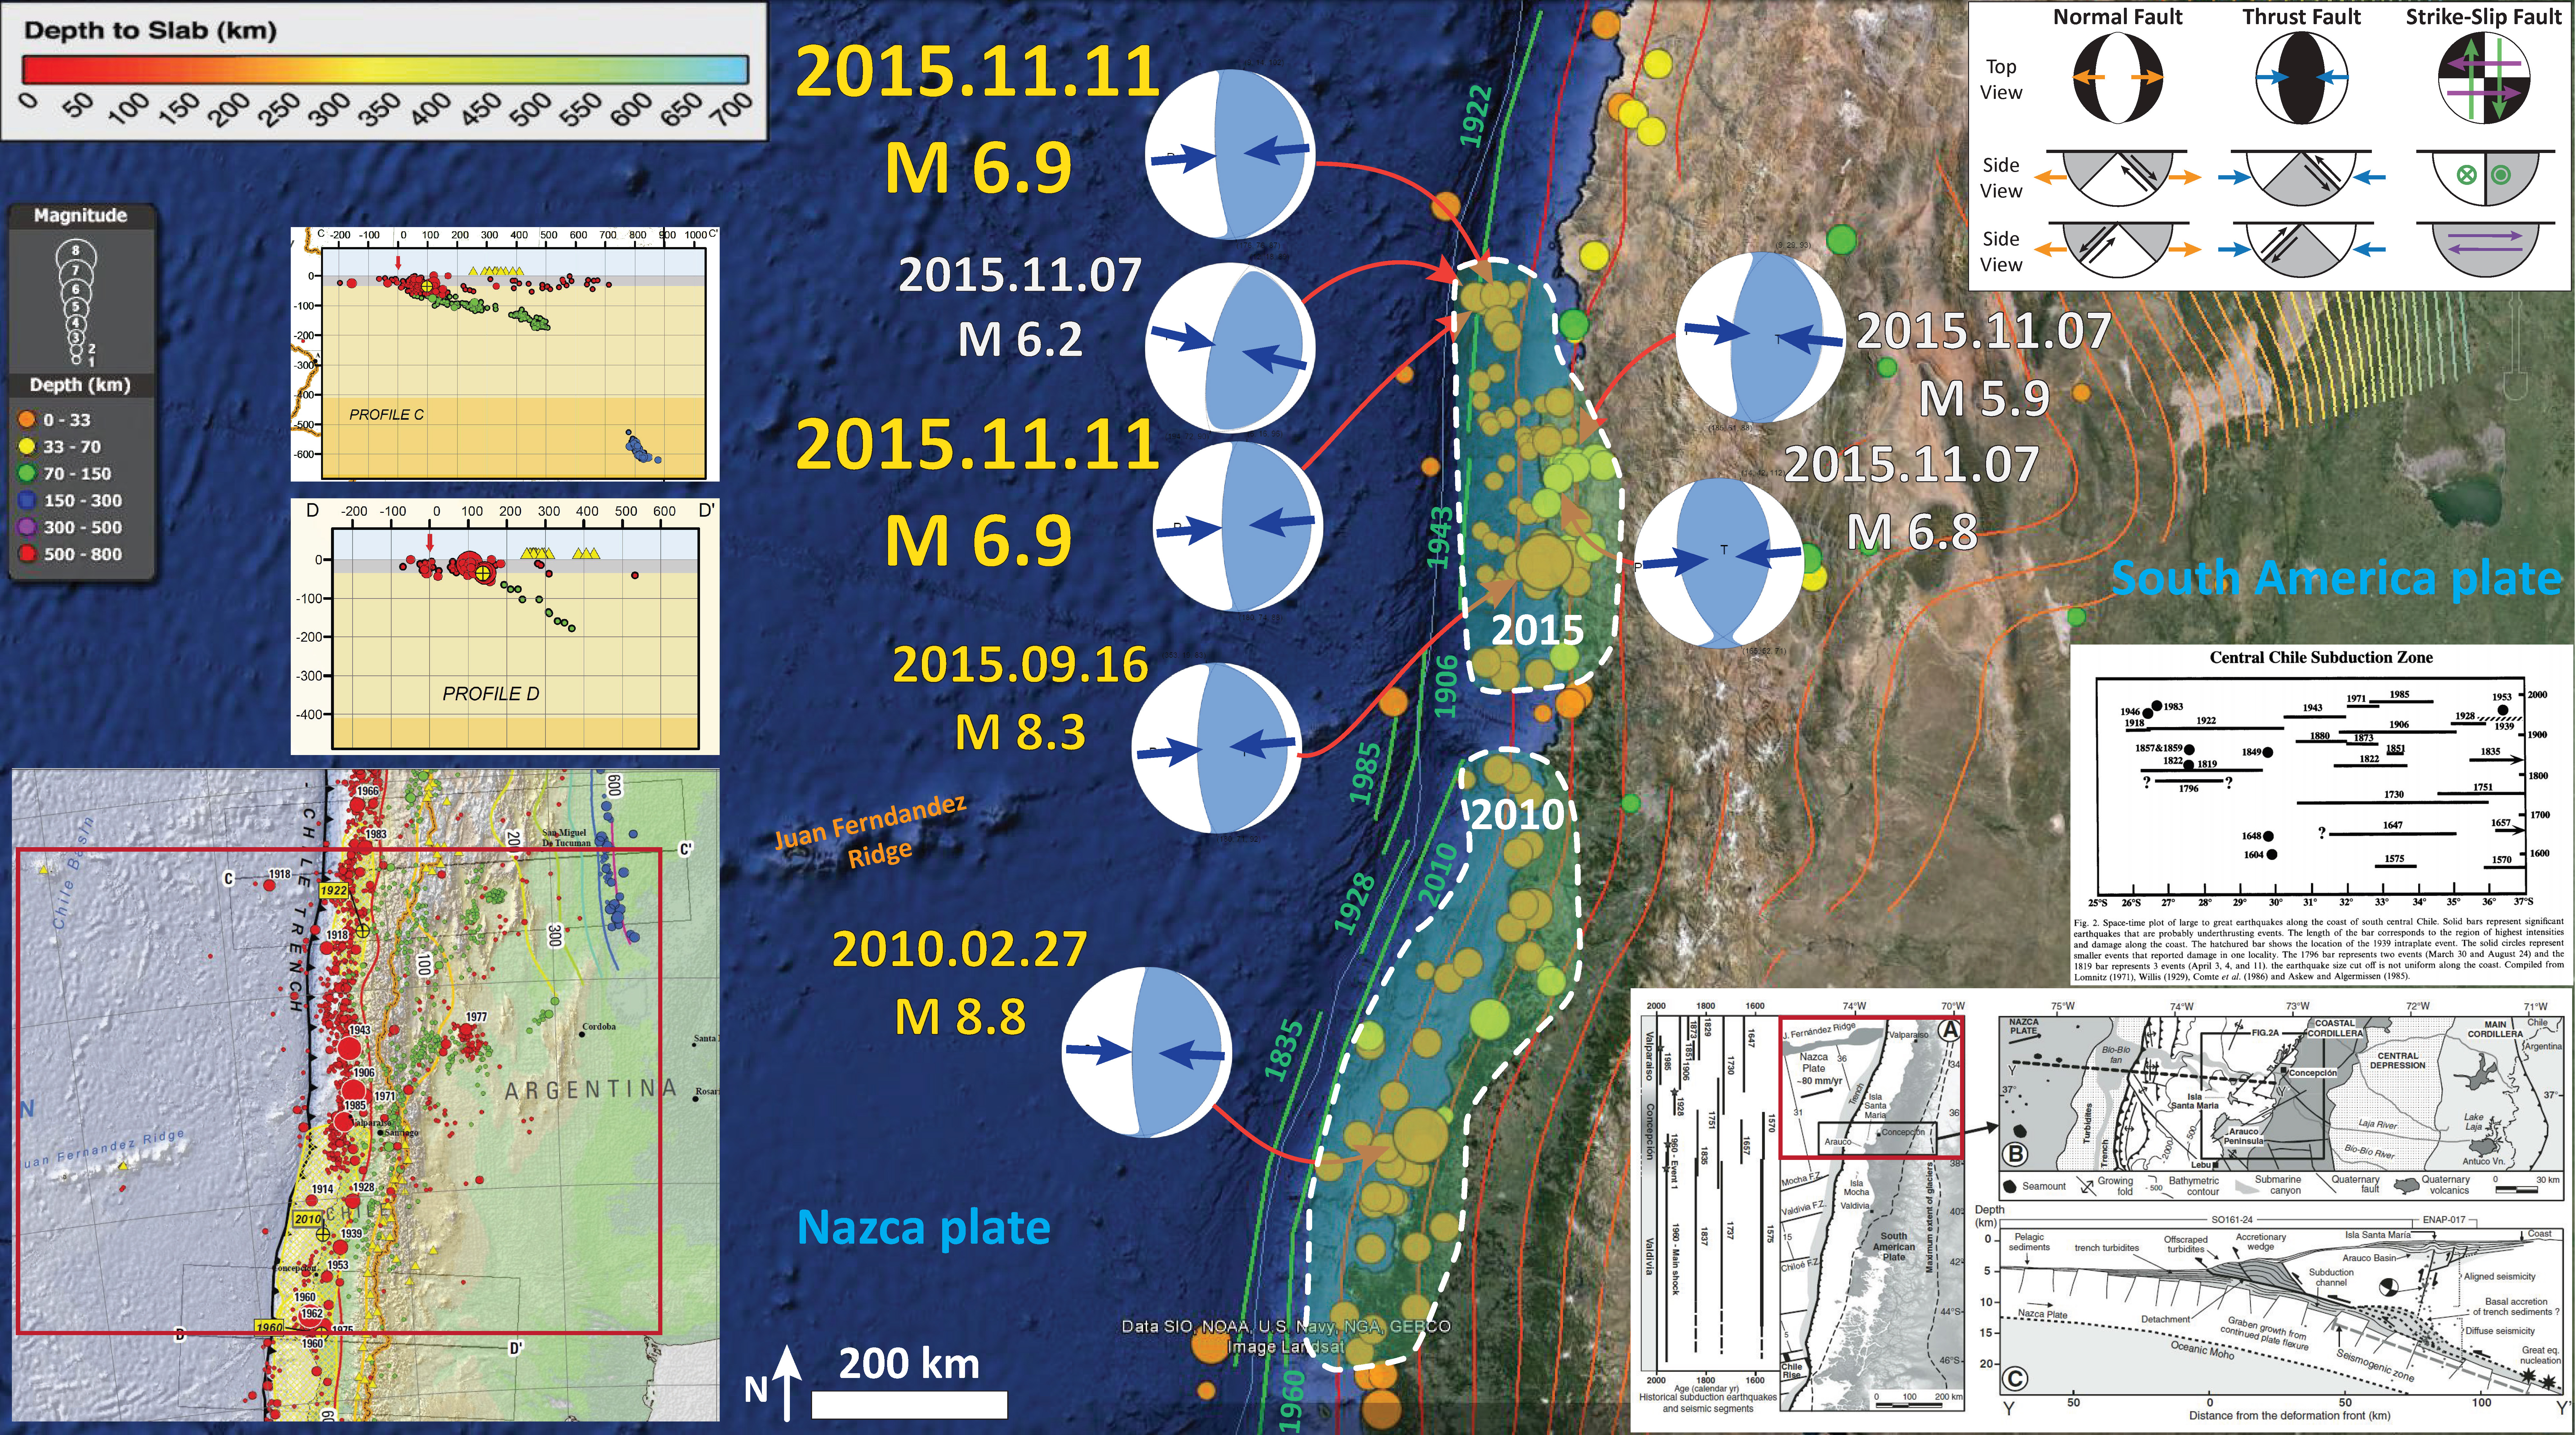
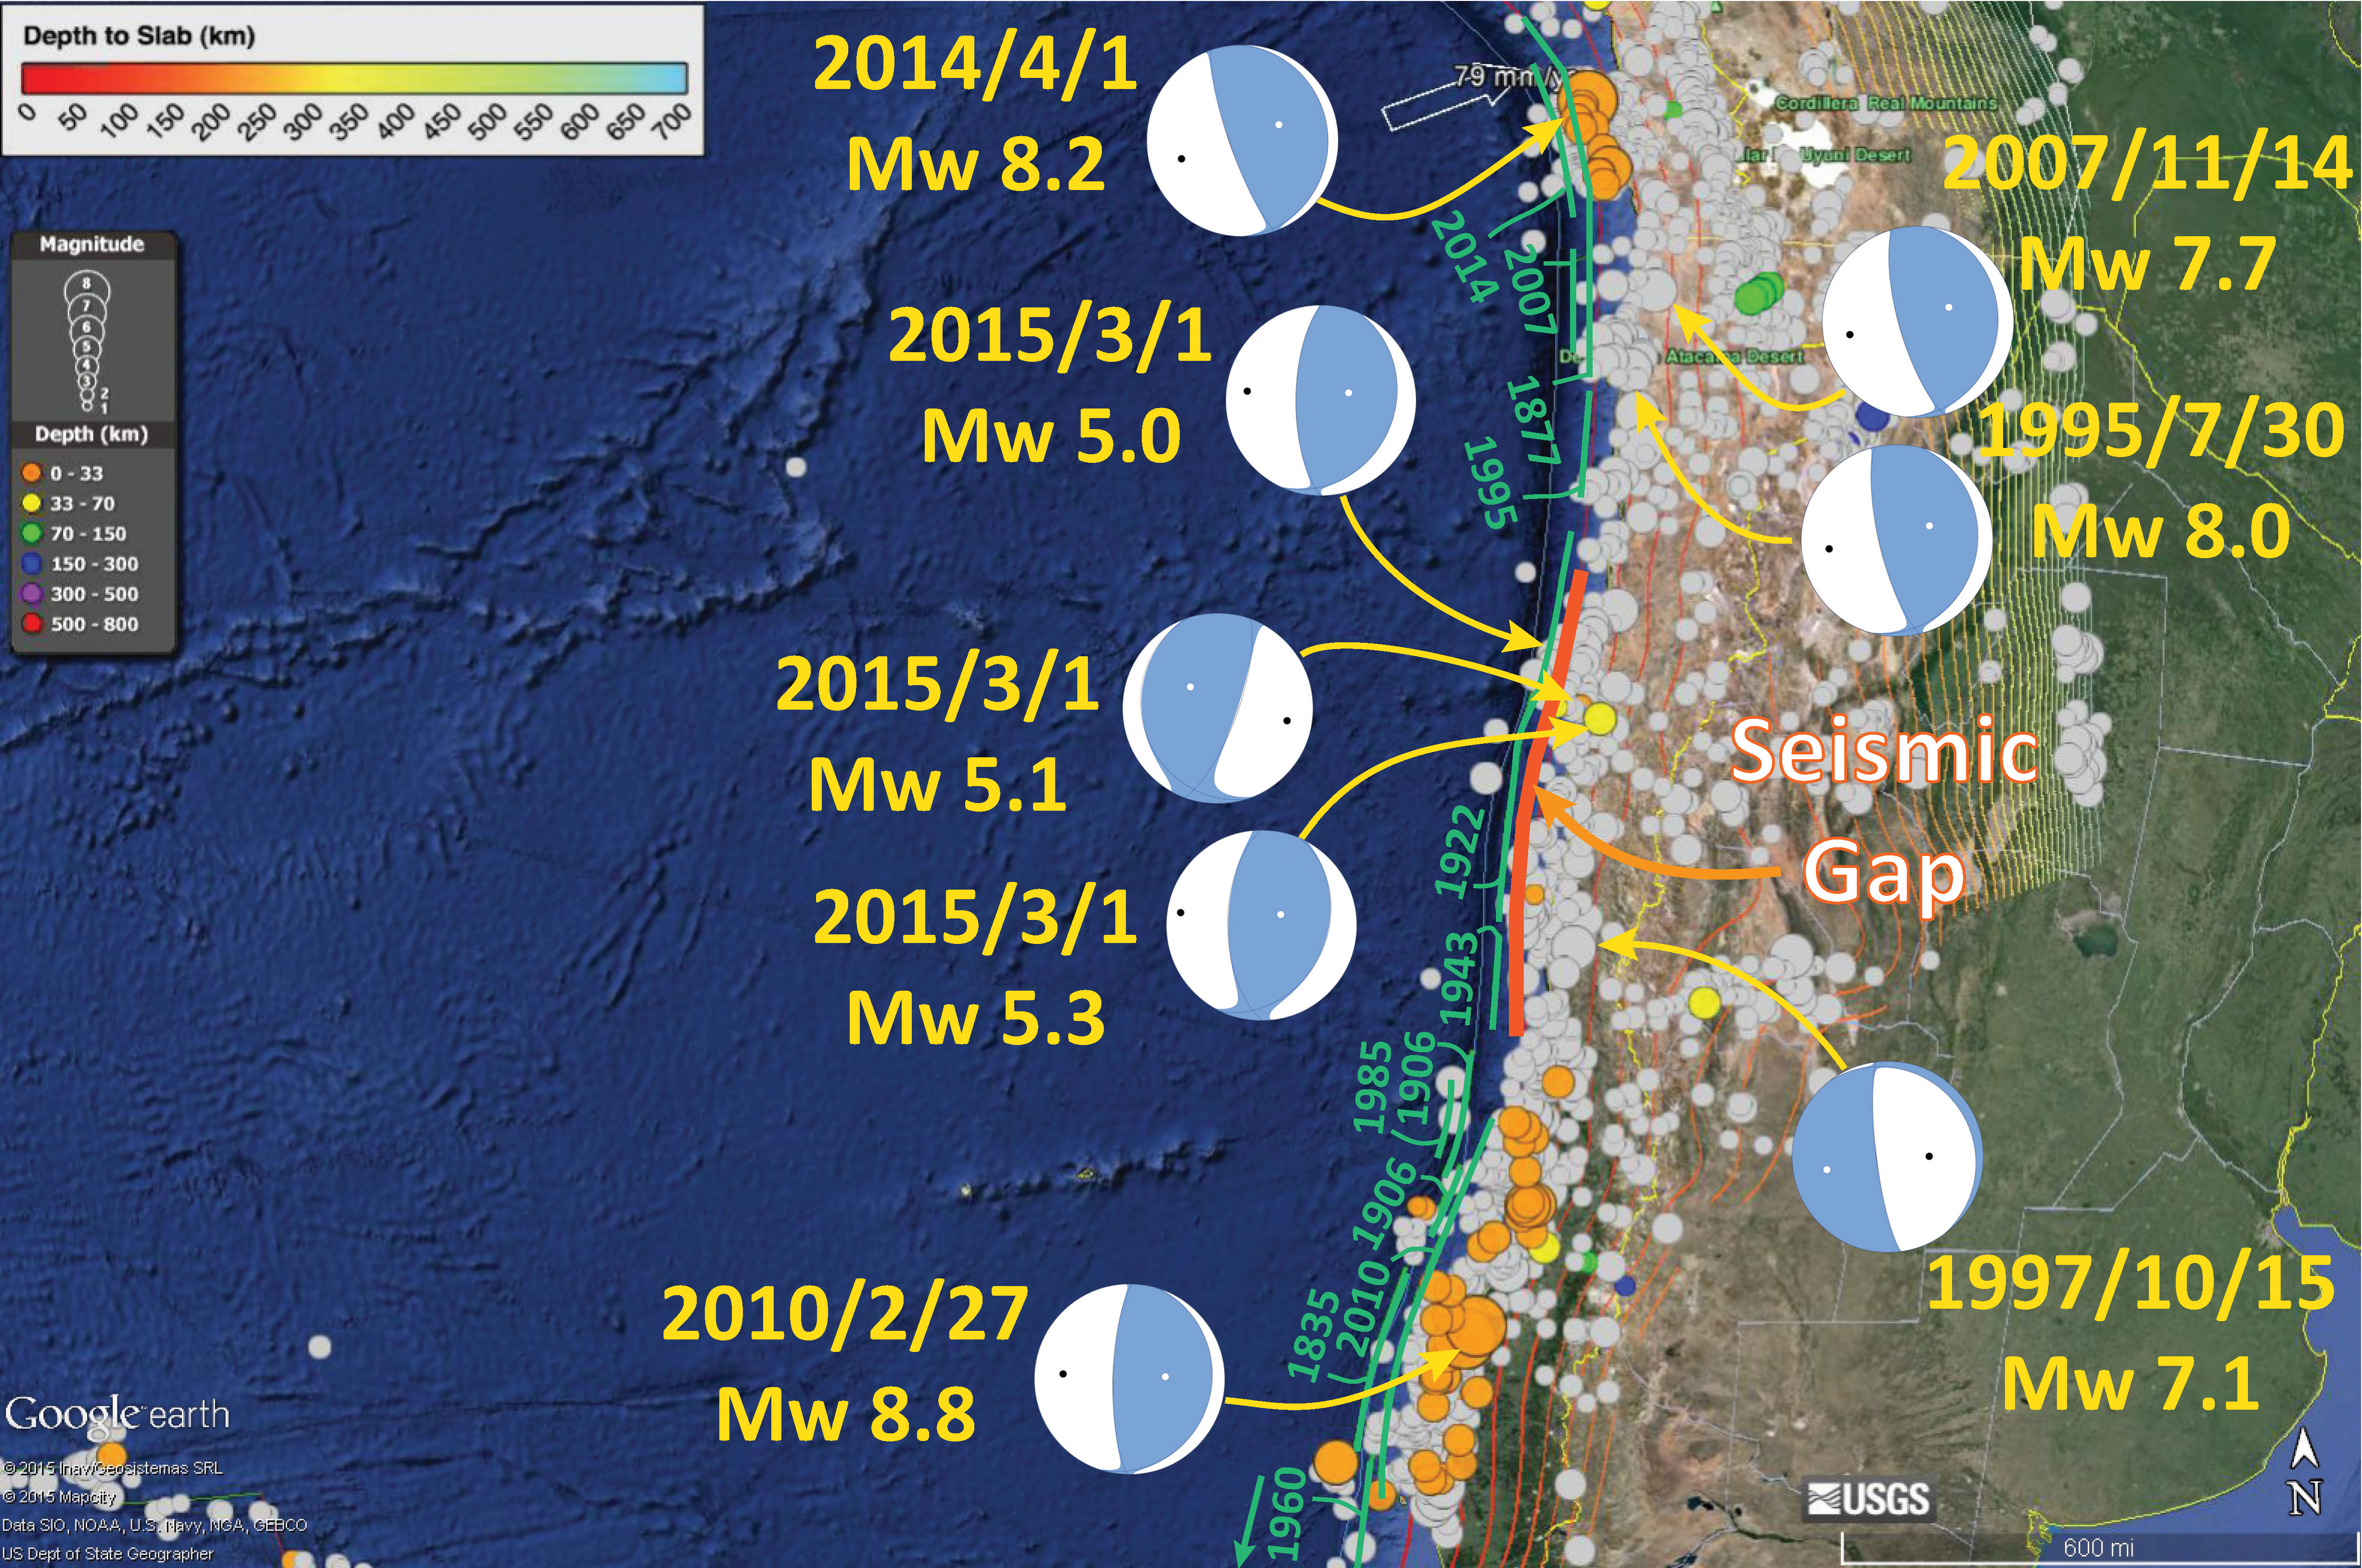
I have summarized the historic seismicity along the subduction zone further to the south, beginning in the region of the 2014.04.01 M 8.2 earthquake. Here is my report, where I discuss the 2014 earthquake series, along with the historic and prehistoric earthquakes in that region. Here is a map from that report. Note how the September 2015 earthquakes fit into part of this gap that I plot below (in the region of the 1922 earthquake).
-
Here is an animation from IRIS that reviews the tectonics of the Peru-Chile subduction zone. For the animation, first is a screen shot and below that is the embedded video. This animation is from IRIS. Written and directed by Robert F. Butler, University of Portland. Animation and Graphics: Jenda Johnson, geologist. Consultant: Susan Beck, University or Arizona. Narration: Elayne Shapiro, University of Portland.
- Here is a download link for the embedded video below (34 MB mp4)

-
References:
- Chlieh et al., 2011. Interseismic coupling and seismic potential along the Central Andes subduction zone, Journal of Geophysical Research, v. 116, B12405, 21 p.
- Hayes, G. P., D. J. Wald, and R. L. Johnson, 2012. Slab1.0: A three-dimensional model of global subduction zone geometries, J. Geophys. Res., 117, B01302, doi:10.1029/2011JB008524.
- Hayes, G.P., Smoczyk, G.M., Benz, H.M., Villaseñor, Antonio, and Furlong, K.P., 2015. Seismicity of the Earth 1900–2013, Seismotectonics of South America (Nazca Plate Region): U.S. Geological Survey Open-File Report 2015–1031–E, 1 sheet, scale 1:14,000,000, http://dx.doi.org/10.3133/ofr20151031E.
- Trabant, C., A. R. Hutko, M. Bahavar, R. Karstens, T. Ahern, and R. Aster, 2012. Data Products at the IRIS DMC: Stepping Stones for Research and Other Applications, Seismological Research Letters, 83(5), 846–854, doi:10.1785/0220120032.
-
Here are some related papers:
- Moreno 2010
- Chileh et al., 2011
- Lay 2011
- Schurr et al., 2014
- Melnick et al., 2014
- Béjar-Pizarro et al., 2013
http://earthjay.com/earthquakes/20151124_peru/20151124_peru_interpretation_thumb.jpg