Just a couple hours ago there was an earthquake along the Swan fault, which is the transform plate boundary between the North America and Caribbean plates. The Cayman trough (CT) is a region of oceanic crust, formed at the Mid-Cayman Rise (MCR) oceanic spreading center.
To the west of the MCR the CT is bound by the left-lateral strike-slip Swan fault.
To the east of the MCR, the CT is bound on the north by the Oriente fault.
Based upon our knowledge of the plate tectonics of this region, I can interpret the fault plane solution for this earthquake. The M 7.6 earthquake was most likely a left-lateral strike-slip earthquake associated with the Swan fault.
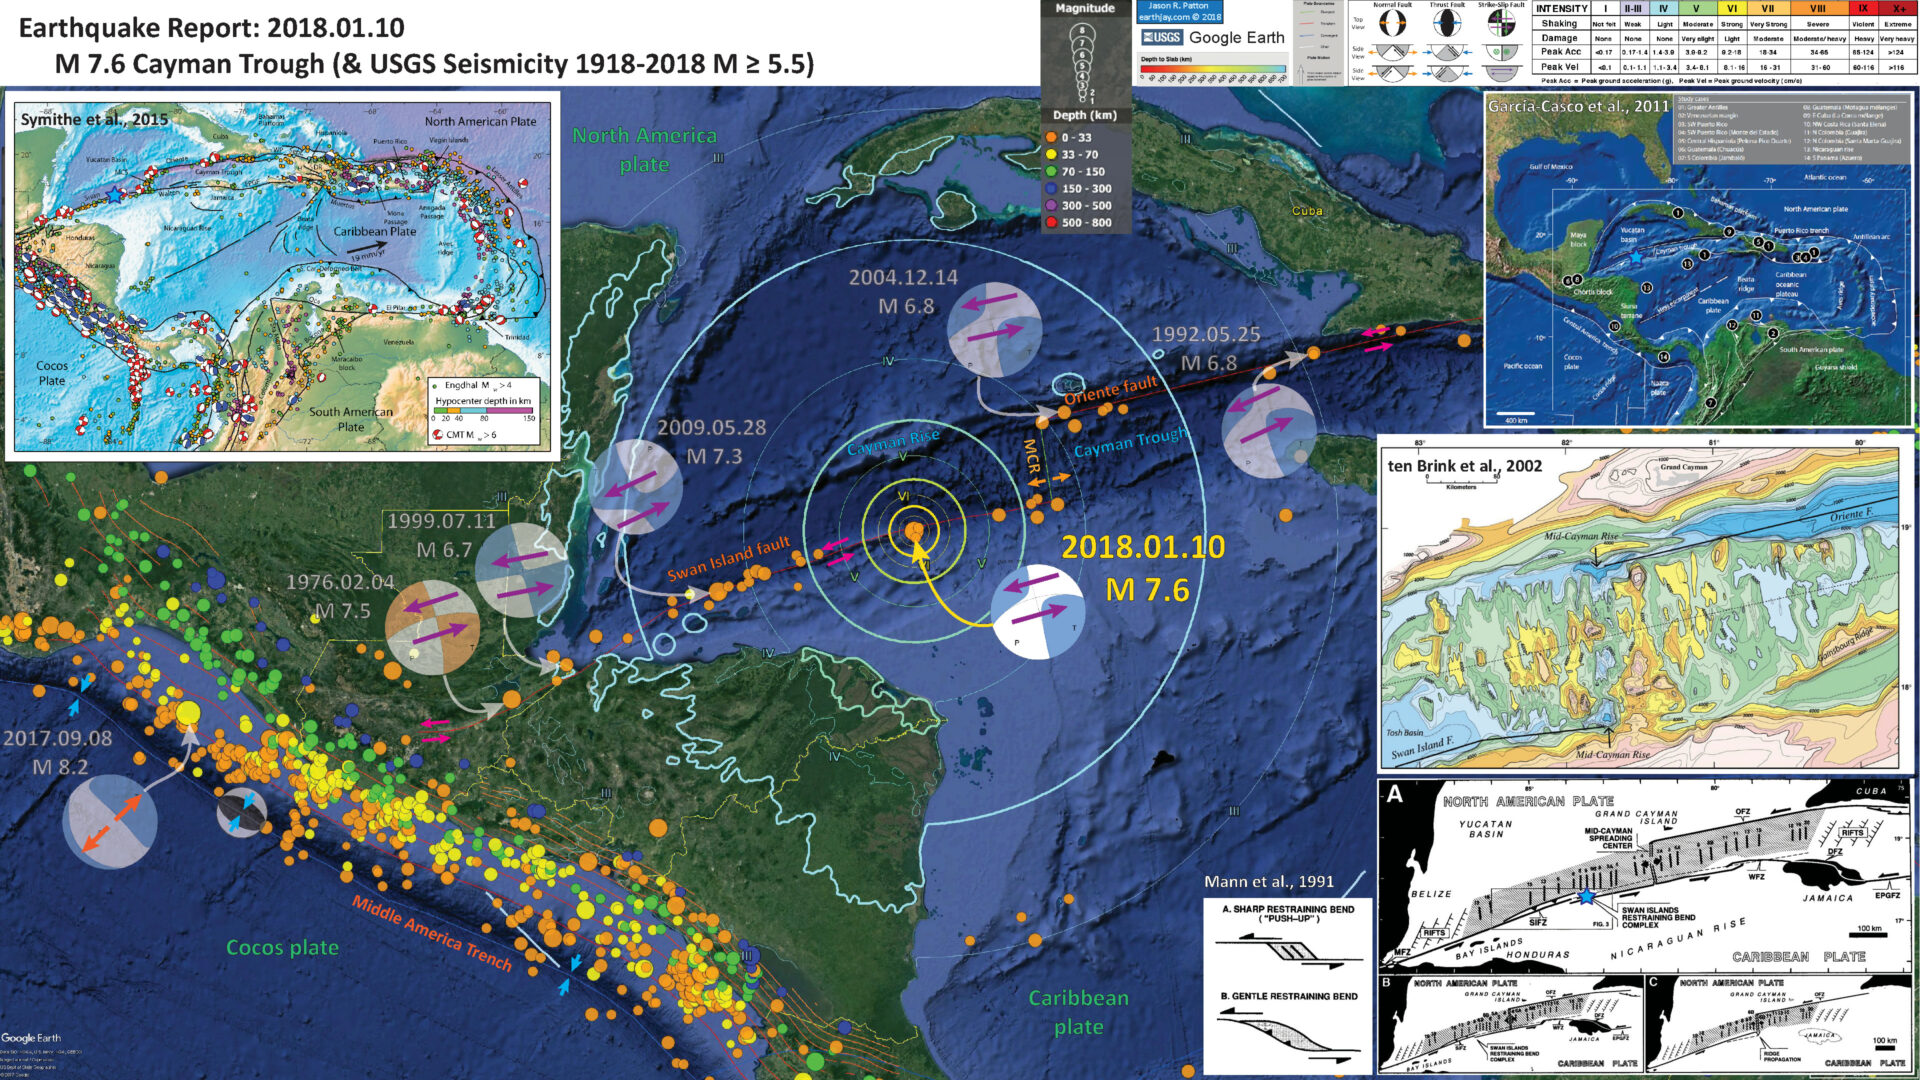
Below is my interpretive poster for this earthquake
I plot the seismicity from the past month, with color representing depth and diameter representing magnitude (see legend). I include earthquake epicenters from 1918-2018 with magnitudes M ≥ 6.5 (and down to M ≥ 4.5 in a second poster).
I plot the USGS fault plane solutions (moment tensors in blue and focal mechanisms in orange) for the M 7.3 earthquakes, in addition to some relevant historic earthquakes.There have been several M 6.7-M 7.5 earthquakes to the west of this fault in the last 4 decades or so.
- I placed a moment tensor / focal mechanism legend on the poster. There is more material from the USGS web sites about moment tensors and focal mechanisms (the beach ball symbols). Both moment tensors and focal mechanisms are solutions to seismologic data that reveal two possible interpretations for fault orientation and sense of motion. One must use other information, like the regional tectonics, to interpret which of the two possibilities is more likely.
- I also include the shaking intensity contours on the map. These use the Modified Mercalli Intensity Scale (MMI; see the legend on the map). This is based upon a computer model estimate of ground motions, different from the “Did You Feel It?” estimate of ground motions that is actually based on real observations. The MMI is a qualitative measure of shaking intensity. More on the MMI scale can be found here and here. This is based upon a computer model estimate of ground motions, different from the “Did You Feel It?” estimate of ground motions that is actually based on real observations.
- I include the slab contours plotted (Hayes et al., 2012), which are contours that represent the depth to the subduction zone fault. These are mostly based upon seismicity. The depths of the earthquakes have considerable error and do not all occur along the subduction zone faults, so these slab contours are simply the best estimate for the location of the fault.
-
I include some inset figures.
- In the upper left corner is a plate tectonic map showing the major plate boundary faults in the Caribbean region. Symithe et al. (2015) plot fault plane solutions for earthquakes M ≥ 6. I place a blue star in the general location of today’s M 7.6 earthquake.
- In the upper right corner is a different plate tectonic map from García-Casco et al. (2011). I place a blue star in the general location of today’s M 7.6 earthquake.
- In the lower right corner is a figure from Mann et al., (1991) that shows the magnetic anomalies in the oceanic crust of the Cayman trough. The short vertical subparallel black lines are magnetic anomalies, identified from magnetic surveys with ages constrained by rocks from the seafloor. As the crust spreads from the Mid Cayman Ridge, and Earth’s magnetic field polarity flips, the changes in magnetic polarity are recorded in the crust. The crust closest to the MCR is youngest. I place a blue star in the general location of today’s M 7.6 earthquake.
- Above the Mann et al. (1991) map is a larger scale map from ten Brink et al. (2002). This map shows the quasi detailed bathymetry in the area of the MCR. They map that both the Swan and Oriente faults terminate at the MCR. Today’s M 7.6 earthquake is to the west of this map, so there is no little blue star. :-(


- Below are the USGS websites for the earthquakes plotted on the poster above.
- M 7.6 – 44km E of Great Swan Island, Honduras
2018-01-10 02:51:31 UTC 17.469°N 83.520°W 10.0 km depth
https://earthquake.usgs.gov/earthquakes/eventpage/us1000c2zy#executive - M 7.5 – Guatemala
1976-02-04 09:01:43 UTC 15.324°N 89.101°W 5.0 km depth
https://earthquake.usgs.gov/earthquakes/eventpage/usp0000ex3#executive - M 6.8 – Cuba region
1992-05-25 16:55:04 UTC 19.613°N 77.872°W 23.1 km depth
https://earthquake.usgs.gov/earthquakes/eventpage/usp000582h#executive - M 6.7 – Guatemala
1999-07-11 14:14:16 UTC 15.782°N 88.330°W 10.0 km depth
https://earthquake.usgs.gov/earthquakes/eventpage/usp0009bed#executive - M 6.8 – Cayman Islands region
2004-12-14 23:20:13 UTC 18.958°N 81.409°W 10.0 km depth
https://earthquake.usgs.gov/earthquakes/eventpage/usp000daqt#executive - M 7.3 – offshore Honduras
2009-05-28 08:24:46 UTC 16.731°N 86.217°W 19.0 km depth
https://earthquake.usgs.gov/earthquakes/eventpage/usp000gxkj#executive
- UPDATE: 2018.01.10 9 AM pacific time. There were two observations of a small amplitude (small wave height) tsunami recorded on tide gages in the region. Below are those observations.

- Here is the tectonic map from Symithe et al. (2015). I include their figure caption below in blockquote.
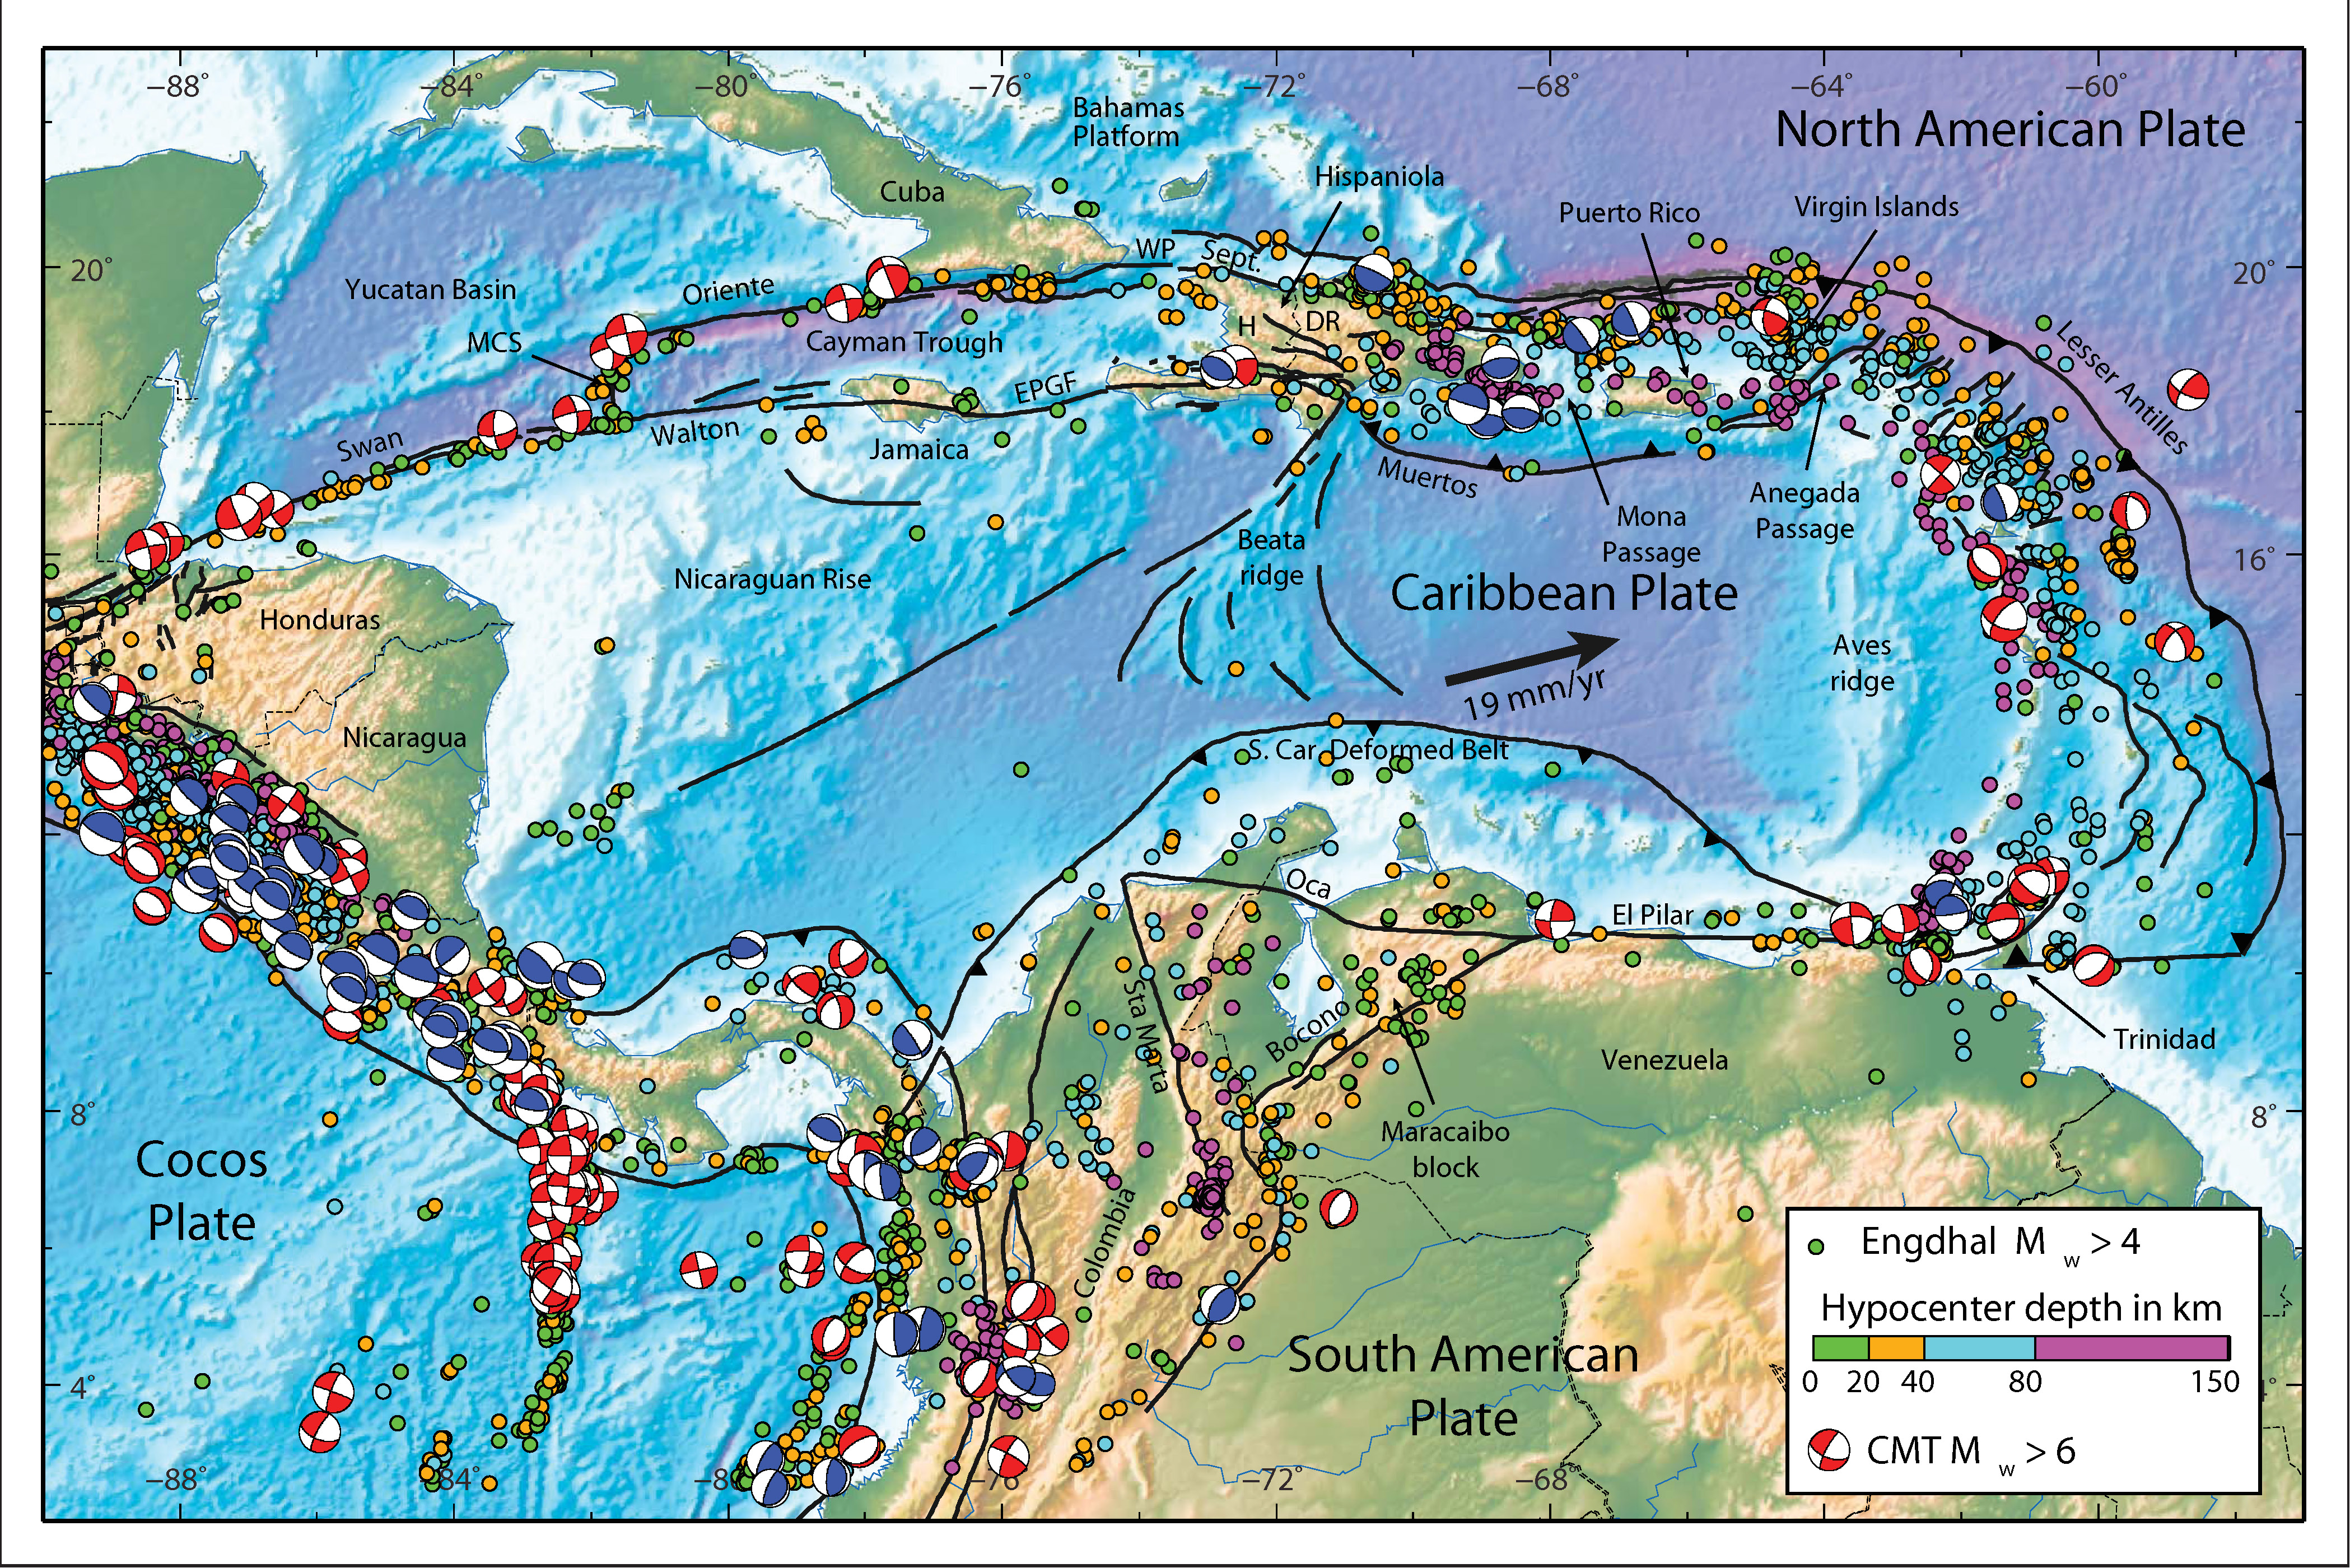
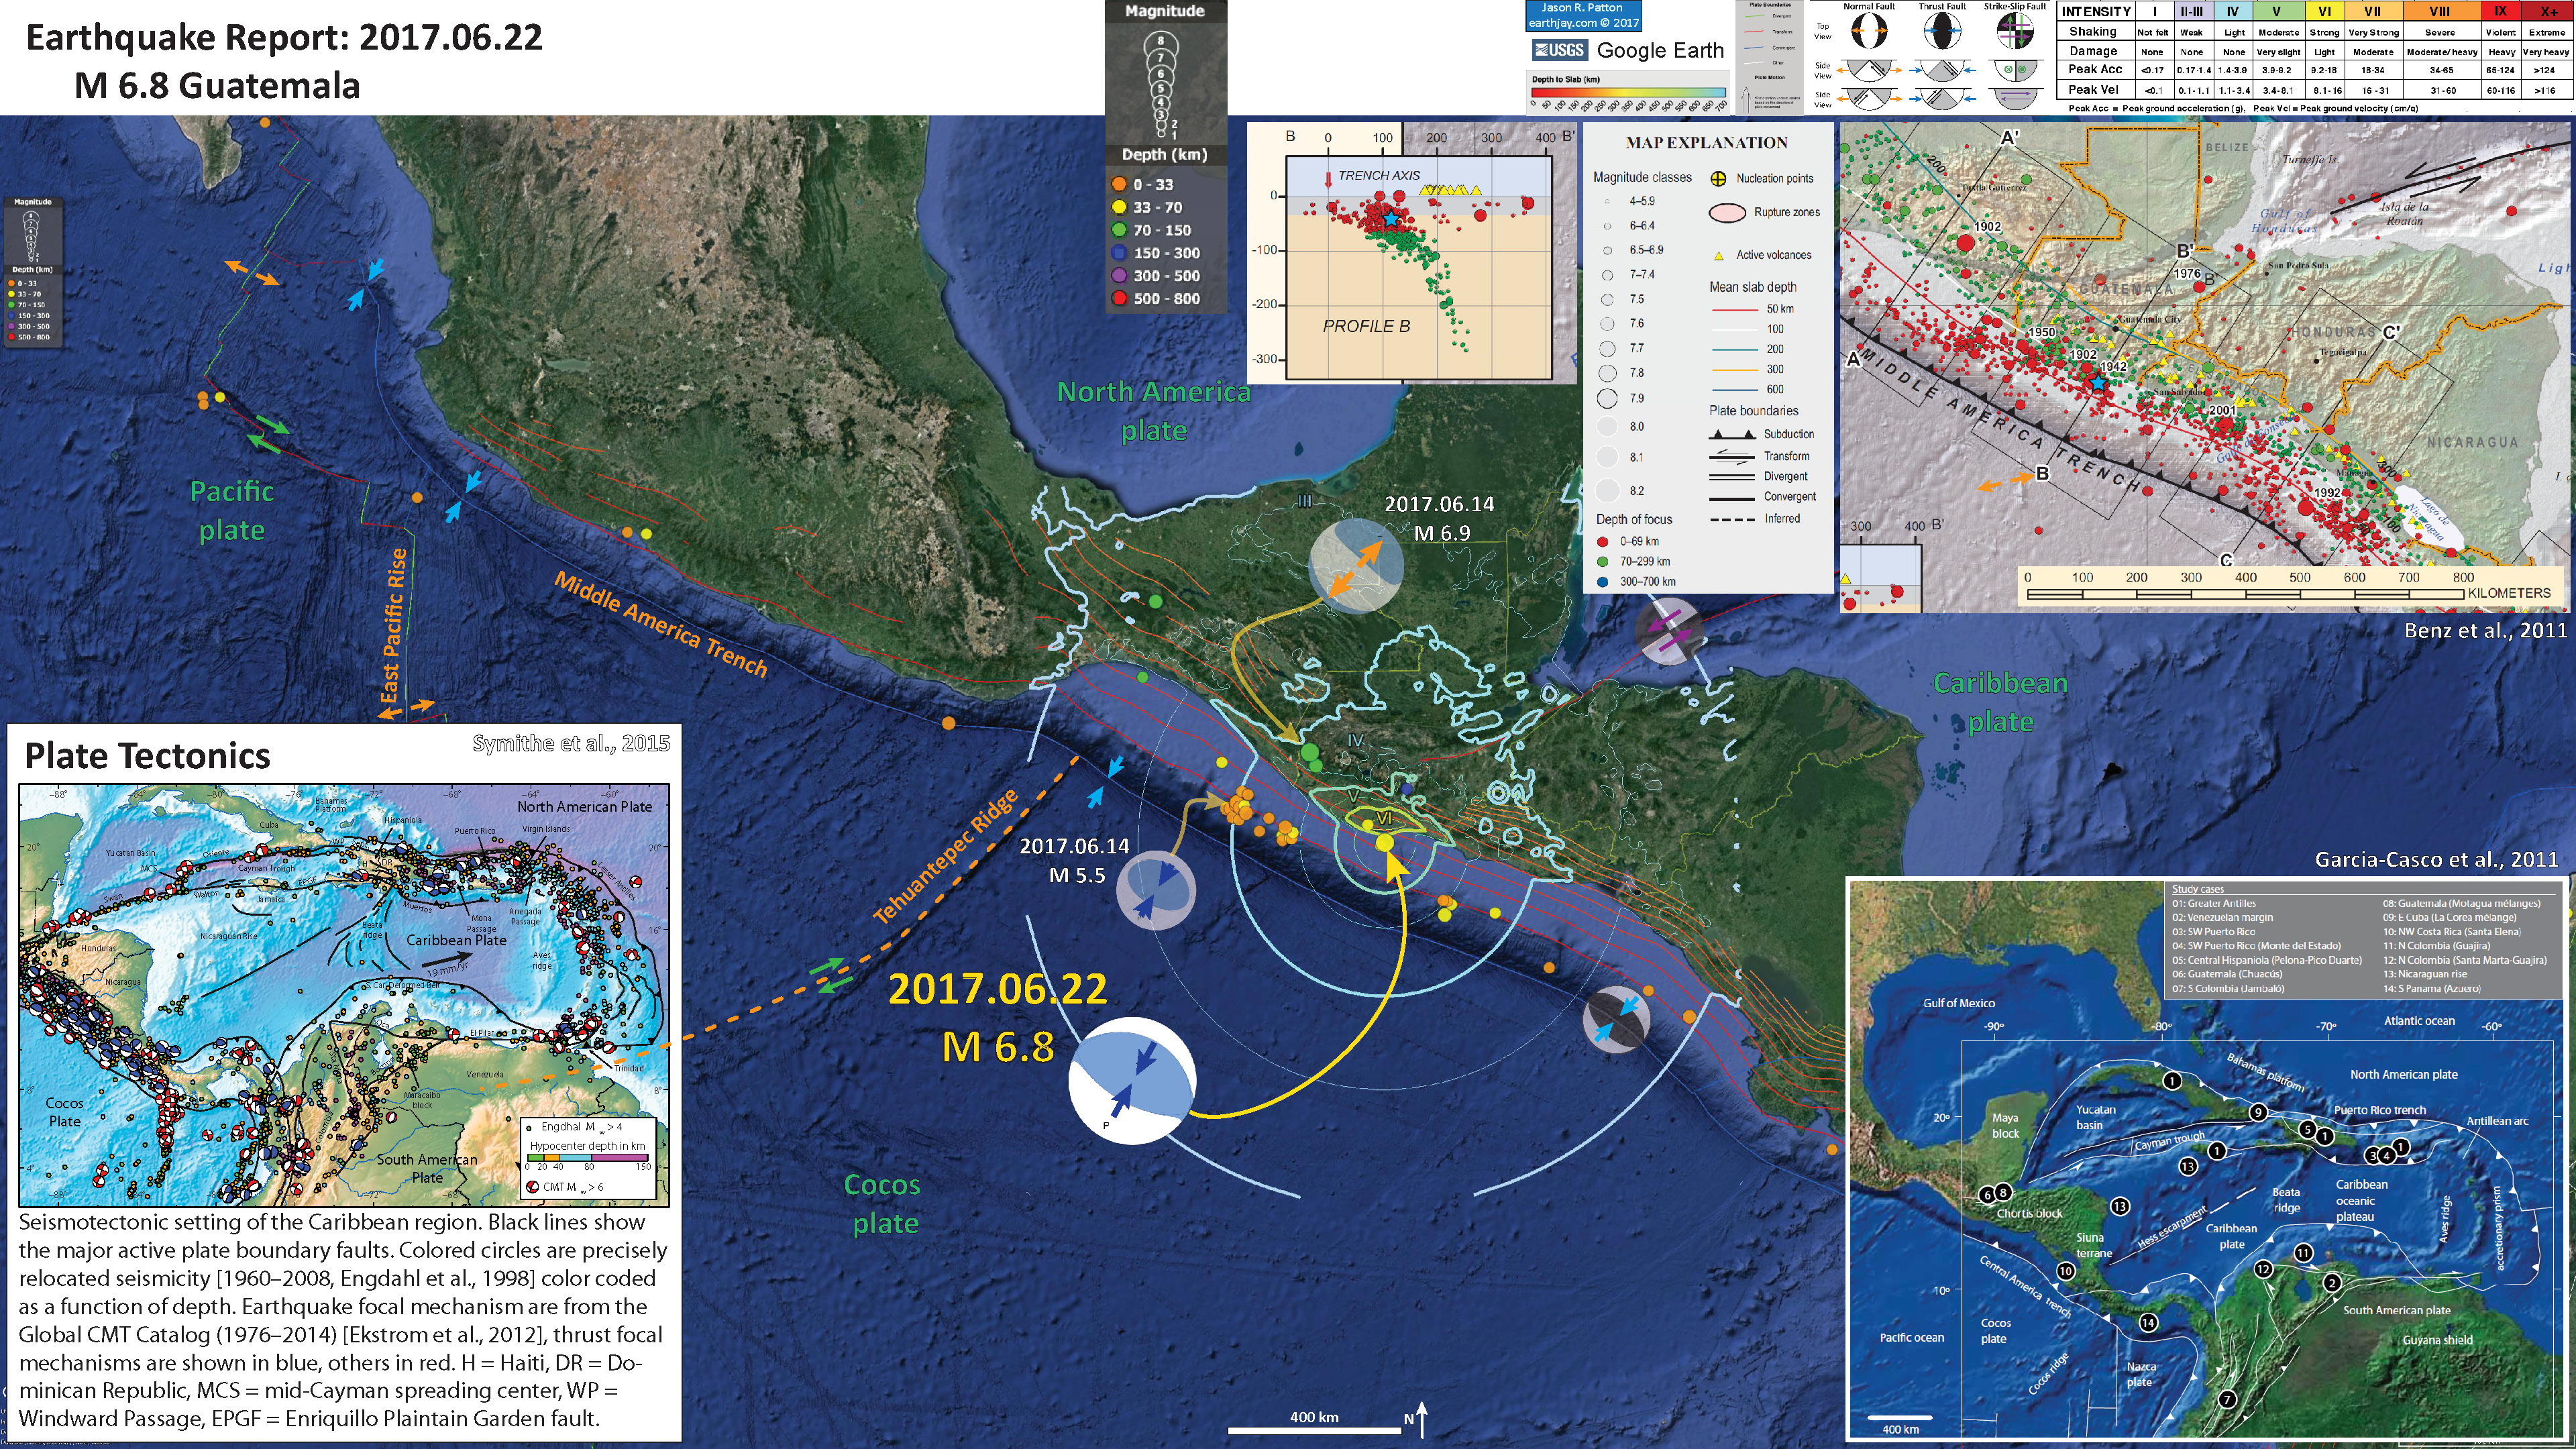
Seismotectonic setting of the Caribbean region. Black lines show the major active plate boundary faults. Colored circles are precisely relocated seismicity [1960–2008, Engdahl et al., 1998] color coded as a function of depth. Earthquake focal mechanism are from the Global CMT Catalog (1976–2014) [Ekstrom et al., 2012], thrust focal mechanisms are shown in blue, others in red. H = Haiti, DR = Dominican Republic, MCS = mid-Cayman spreading center, WP = Windward Passage, EPGF = Enriquillo Plaintain Garden fault.
- Here is the tectonic map from Garcia-Casco et al. (2011). I include their figure caption below in blockquote.

Plate tectonic configuration of the Caribbean region showing the location of the study cases presented in this issue (numbers refer to papers, arranged as in the issue), and other important geological features of the region (compiled from several sources).
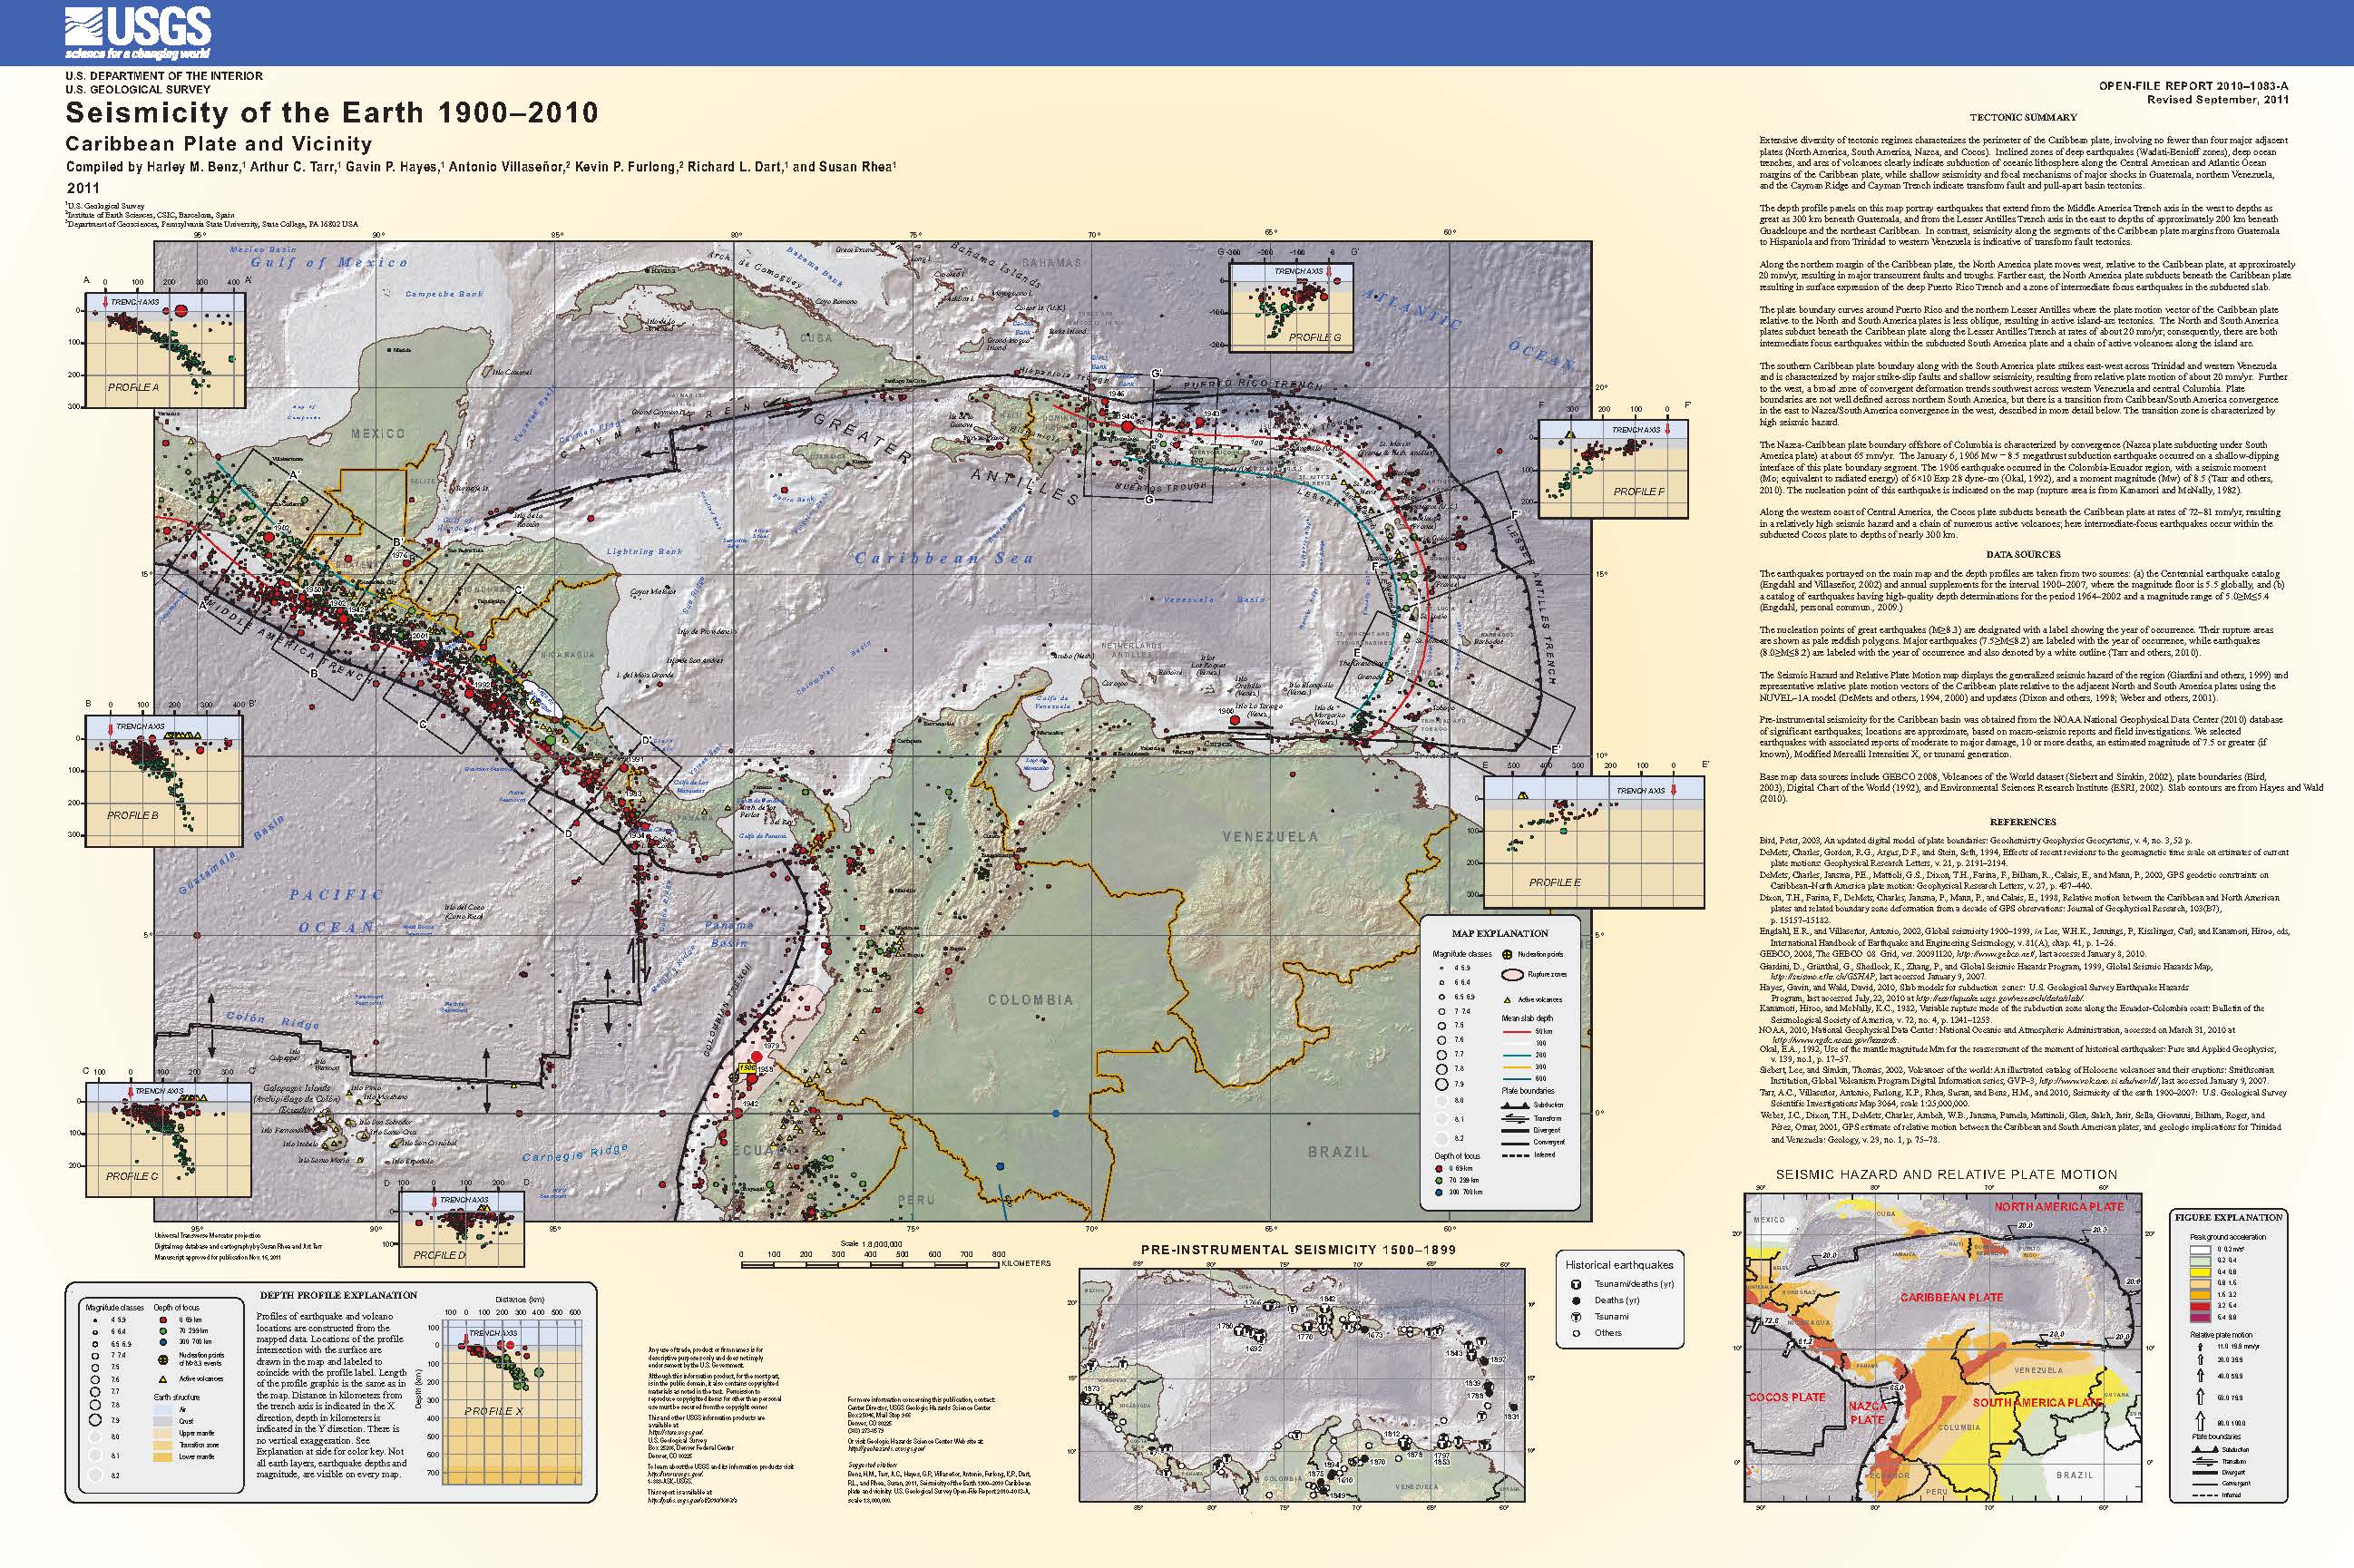
- Here is the Benz et al. (2011) Seismicity of the Earth poster for this region.
- Here is the map from Mann et a. (1991). Note how today’s earthquake is in an area that may have overlapping faults of different types.

A. Tectonic map of Cayman trough region showing strike-slip faults (heavy lines), oceanic crust (gray) in Cayman trough, and magnetic anomaly identifications (numbered bars) (after Rosencrantz et a., 1988). Arrows show relative displacement directions. Fault zones: OFZ – Oriente; DFZ- Dunvale; EPGFZ – Enriquillo-Plantain Garden; WFZ – Walton; SIFZ – Swan Islands; MFZ – Motagua. Bl. Late Miocene reconstruction of Cayman trough. C. Early Miocene reconstruction.
- Here is the large scale map from ten Brink et al. (2002) showing the bathymetry surrounding the Mid-Cayman Rise.

Bathymetry of central Cayman Trough adapted from Jacobs et al. (1989). Contour interval: 250 m. Dotted line: location of gravity transect.
- Here is the USGS Tectonic Summary for this 2018.01.10 M 7.6 earthquake. A more comprehensive review can be found here.
- The January 10, 2018, M 7.6 Great Swan Island, Honduras earthquake occurred as the result of strike slip faulting in the shallow crust near the boundary between the North America and Caribbean plates. Early focal mechanism solutions indicate that rupture occurred on a steeply dipping structure striking either west-northwest (right-lateral), or west-southwest (left-lateral). At the location of this earthquake, the North America plate moves to the west-southwest with respect to the Caribbean plate at a rate of approximately 19 mm/yr. Local to the January 10, 2018 earthquake, this motion is predominantly accommodated along the Swan Islands transform fault, a left-lateral structure. The location, depth and focal mechanism solution of today’s earthquake are consistent with rupture occurring along this plate boundary structure, or on a nearby and closely related fault.
- While commonly plotted as points on maps, earthquakes of this size are more appropriately described as slip over a larger fault area. Strike-slip-faulting events of the size of the January 10, 2018, earthquake are typically about 140×20 km (length x width).
- Nine other earthquakes of M 6 or larger have occurred within 400 km of the January 10, 2018 event over the preceding century. Previous strong earthquakes along the North America-Caribbean plate boundary in this region include the destructive M 7.5 Guatemala earthquake of February 4, 1976, which resulted in more than 23,000 fatalities. The 1976 earthquake occurred on the Motagua fault, a segment of the plate boundary that lies in southern Guatemala, about 650 km west-southwest of the hypocenter of the January 10, 2018, event. In May 2009, a M 7.3 earthquake occurred along the Swan Island transform fault approximately 300 km west of the January 10, 2018 event. The 2009 earthquake (which was much closer to land than the 2018 event) resulted in 7 fatalities, 40 injuries and 130 buildings being damaged or destroyed.
- From here.
Social Media
Finite fault model for tonight's M 7.6 EQ off Honduras – https://t.co/cEOVYyG2gP. Suggests relatively high slip, compact rupture. pic.twitter.com/tVvM5dHOy9
— Gavin Hayes (@gph_seismo) January 10, 2018
M7.6 Honduras quake is a left lateral strike-slip quake on the Swan Islands Transform Fault pic.twitter.com/pRofV9d9g0
— Jascha Polet (@CPPGeophysics) January 10, 2018
Today's M7.6 quake near Honduras occurred where the velocity on the Carribean – North American plate boundary is parallel to the boundary, and thus a strike-slip quake (figure adapted from DeMets et al., 2000) pic.twitter.com/ExKf2svi95
— Jascha Polet (@CPPGeophysics) January 10, 2018
Interested in seeing real-time seismograms of the #Honduras #earthquake? Select any seismic station to view data.https://t.co/XYHjPlTAFC pic.twitter.com/lnqNtUaLWE
— IRIS Earthquake Sci (@IRIS_EPO) January 10, 2018
Mw=7.5, NORTH OF HONDURAS (Depth: 15 km), 2018/01/10 02:51:31 UTC – Full details here: https://t.co/lStlUFIbrU pic.twitter.com/XYTsRVUkag
— Earthquakes (@geoscope_ipgp) January 10, 2018
This great overview map + explanations of the "Seismotectonics of the Caribbean Region and Vicinity" may be found at the USGS: https://t.co/vFh6AeD8hh pic.twitter.com/DLzLdRWvlC
— Jascha Polet (@CPPGeophysics) January 10, 2018
'Tectonic Aspects of the Guatemala Earthquake of 4 February 1976' | Science https://t.co/HKFjwzeYN7
— Ken Hudnut (@kwhudnut) January 10, 2018
What is that #earthquake beach ball? https://t.co/jf2cH7W4bl pic.twitter.com/QyY3G9iSrR
— IRIS Earthquake Sci (@IRIS_EPO) January 10, 2018
UPDATE: 2018.01.10
Autogenerated responses out to 1400km for peak ground displacements from geodetic obs. @UNAVCO for M7.6 44km E Great Swan Is. Honduras 2018-01-10 earthquake pic.twitter.com/rapjF3k8g4
— UNAVCO (@UNAVCO) January 10, 2018
#RT magnitude 7.6 #earthquake #honduras as seen on #raspberryshake #personal #seismograph in #Tegucigalpa and my #home in #Panama pic.twitter.com/ZOBKKObR6o
— Raspberry Shake (@raspishake) January 10, 2018
Nobody felt this shaking – but waves from the M7.6 Honduras earthquake rolled through #Victoria and #Vancouver last night after travelling nearly 5000 km in about 10-20 minutes. #NRCanSci pic.twitter.com/LNNJjBpG1R
— John Cassidy (@earthquakeguy) January 10, 2018
@UNAVCO Science Snapshot About Plate Motions in Caribbean near M7.6 44km E Great Swan Is. Honduras earthquake sets the geodynamics, https://t.co/xtTqjw40i7 pic.twitter.com/oQDCSm2JLh
— UNAVCO (@UNAVCO) January 10, 2018
temblor post with Shinji Toda static coulomb modeling shows increase in likelihood of earthquake on this plate boundary fault system adjacent to Cayman troughhttps://t.co/IycXcW8oNU pic.twitter.com/wJPfrd5JYD
— patton_cascadia (@patton_cascadia) January 10, 2018
The Mw 7.5 Honduras earthquake recorded in New Zealand, more than 12 000 km from the epicentre. Selected #GeoNet stations are shown north-to-south, P-wave arriving ~15 min after the origin time. pic.twitter.com/vA2Vs0z6Eg
— John Ristau (@SinistralSeismo) January 10, 2018
Looks like a nice example of the passage of the surface waves from a large regional earthquake dynamically triggering an earthquake in a volcanic area https://t.co/rdosRnQtPn
— Jascha Polet (@CPPGeophysics) January 11, 2018
Regional Seismicity
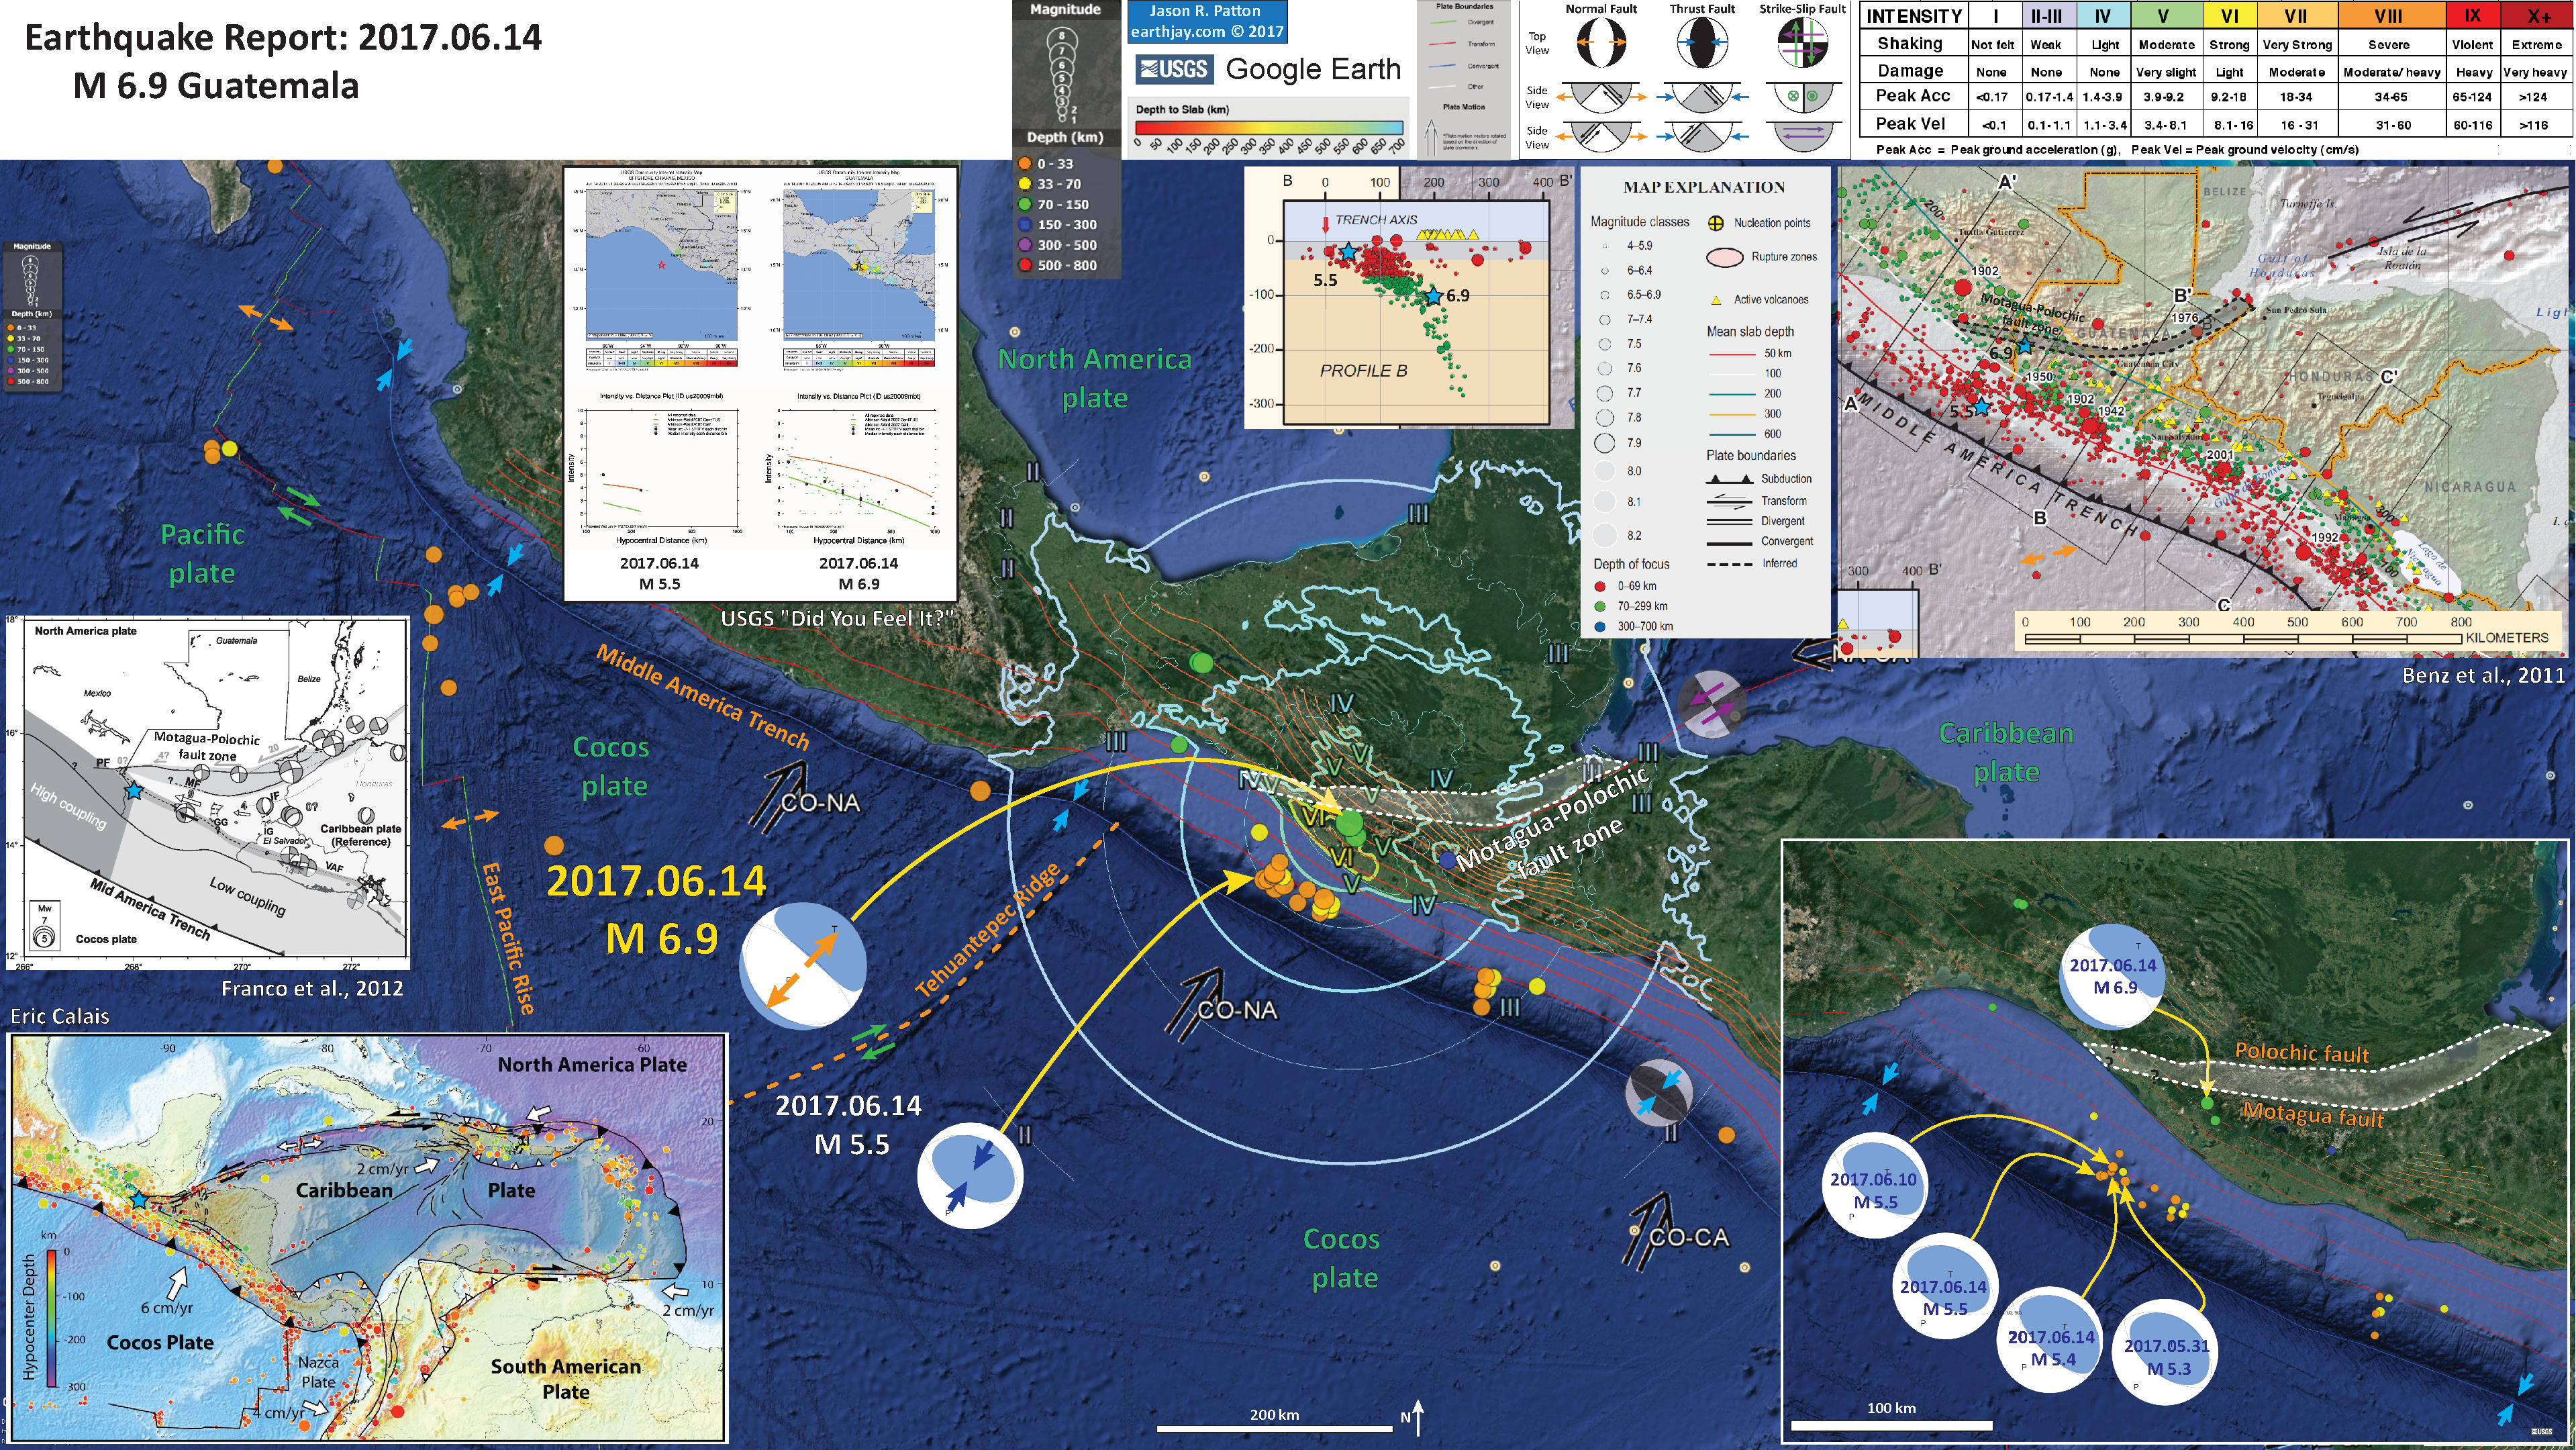
- There were some earthquakes associated with the Middle America Trench (MAT; a subduction zone) over the past year or so. There may be some relation between the earthquakes and the onshore structures of the Swan fault system, the Motagua-Polochic fault zone.
- First there was a sequence of earthquakes in June near where the Motagua-Polochic fault zone splays towards the MAT. Here are my earthquake reports for these 2017.06.14 and 2017.06.22 earthquakes. The interpretive posters are below.
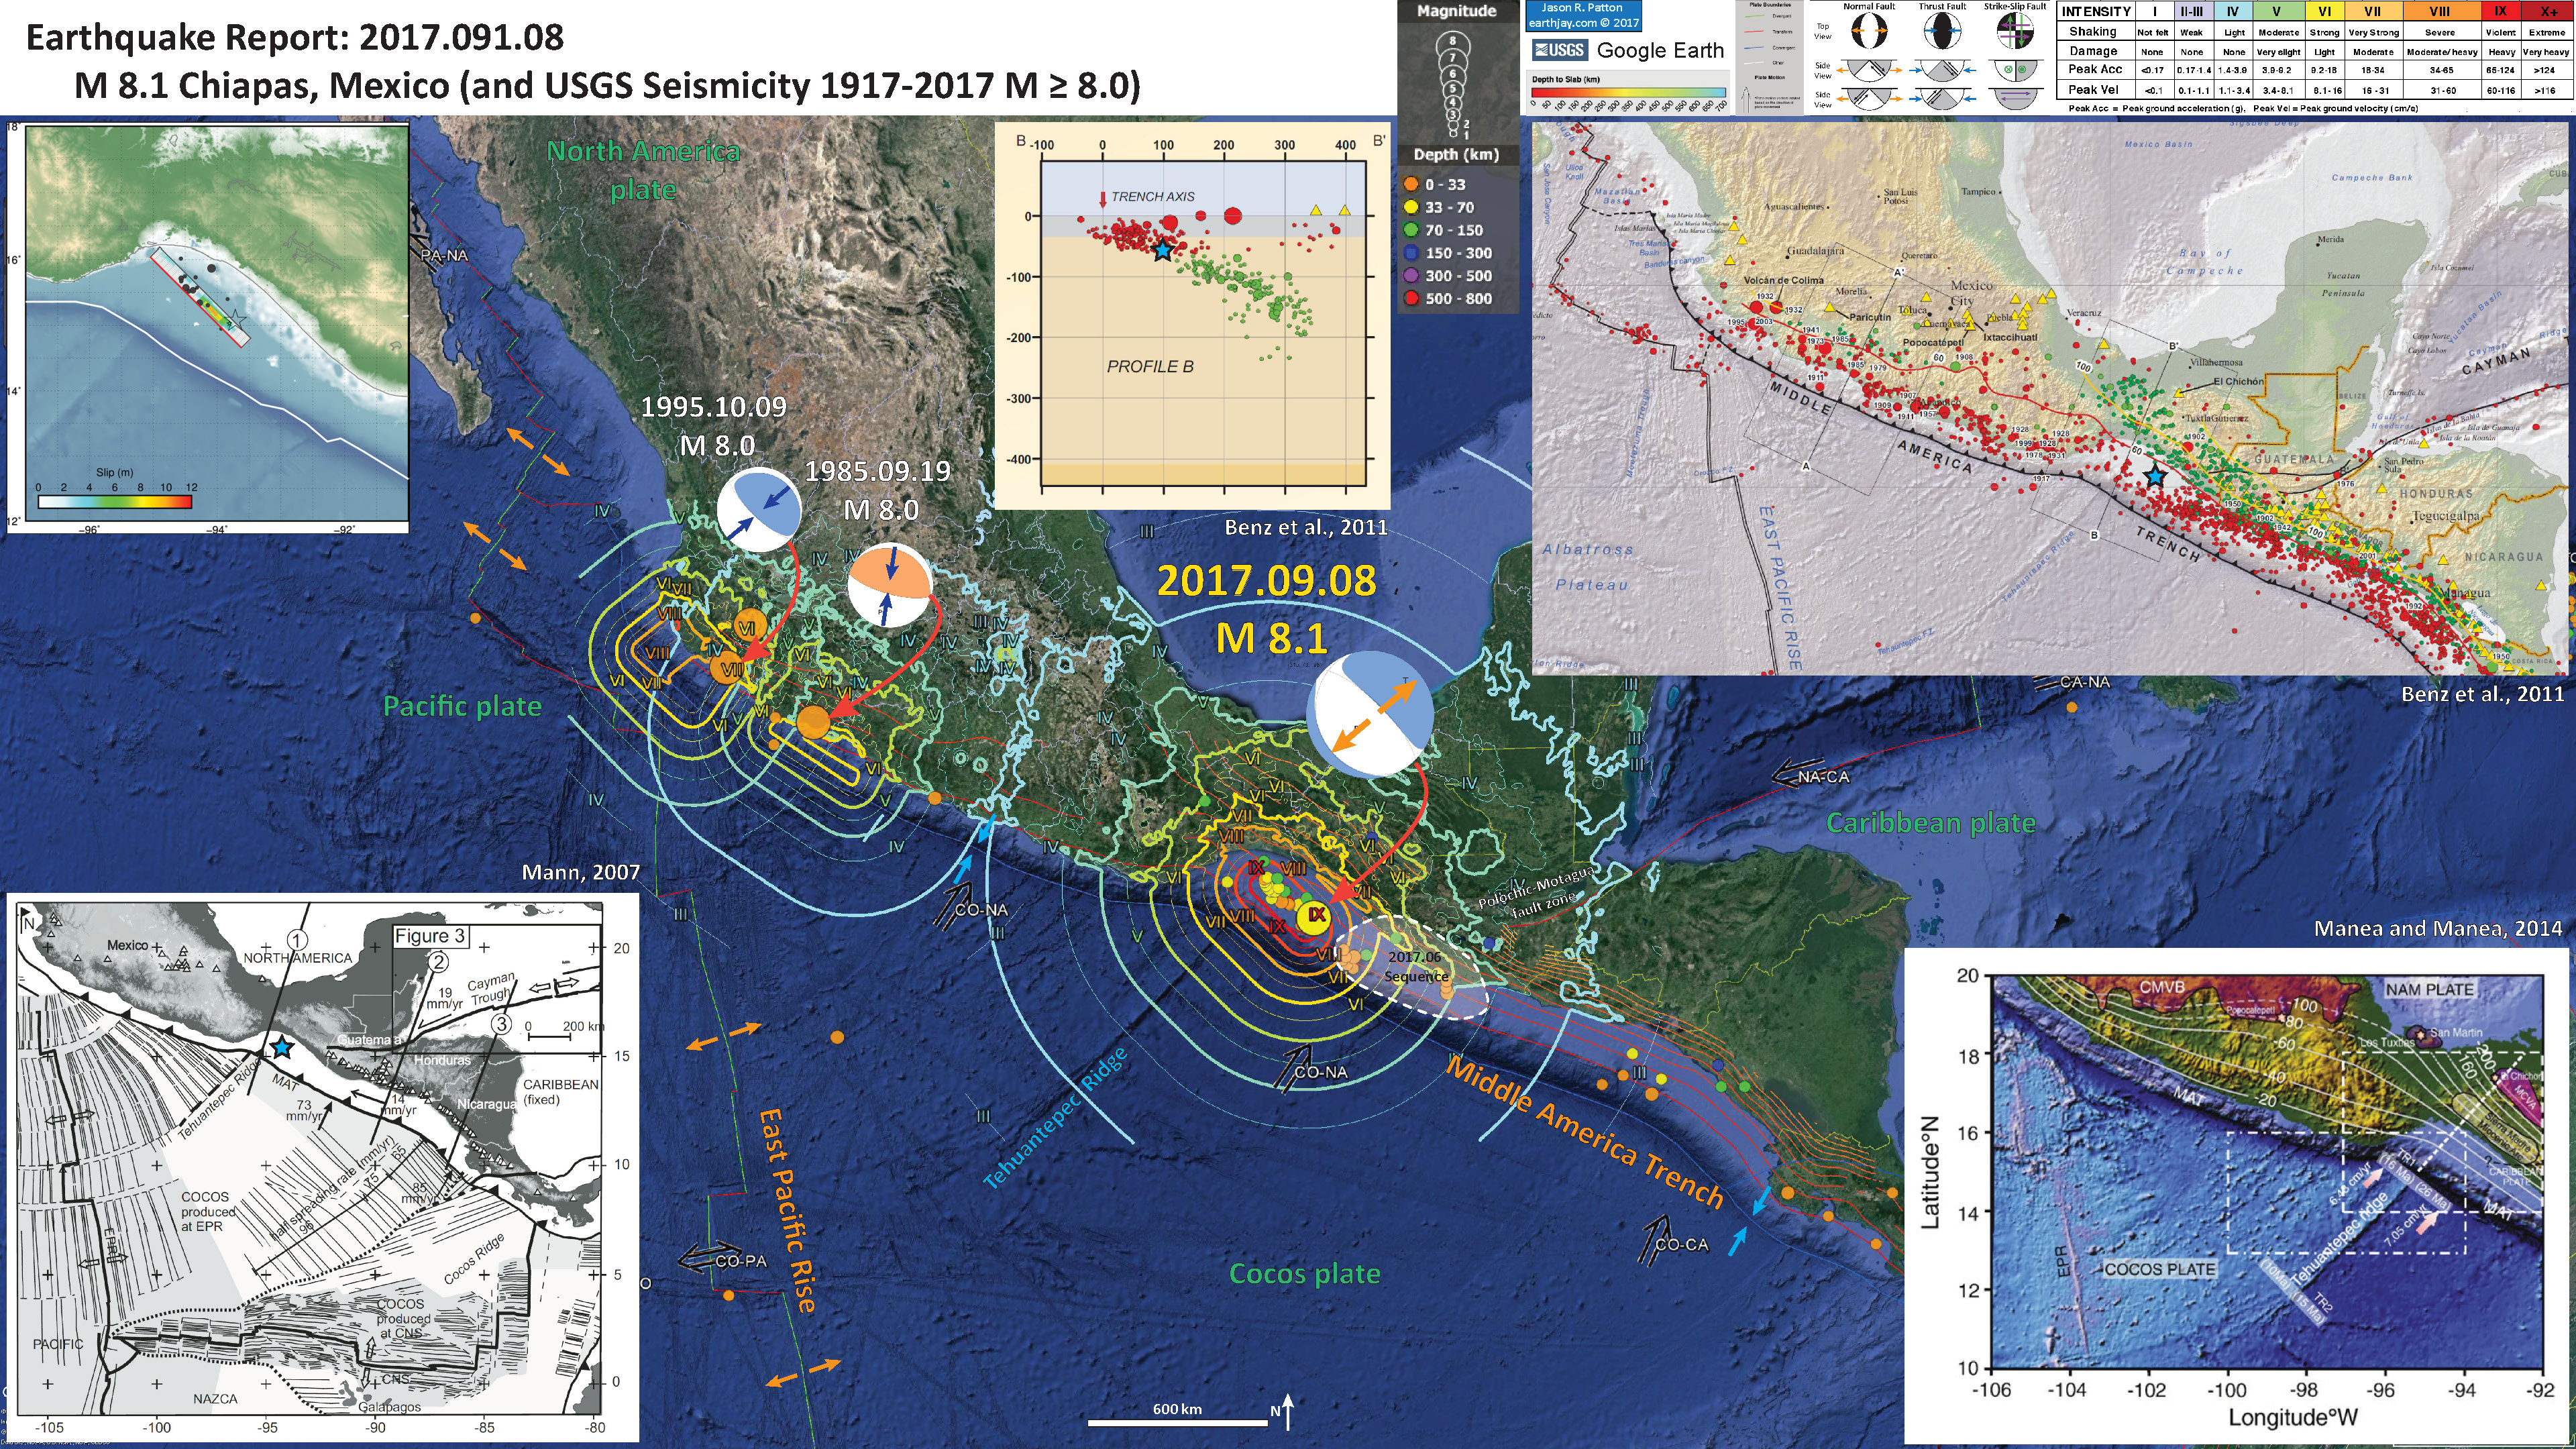
- Then, in September 2017, just to the north of the June sequence, there was a M 8.2 normal fault earthquake in the downgoing Cocos plate. Here is my earthquake report for this 2017.09.08 earthquake.
- 2016.01.17 1900-2016 Summary northern Caribbean
- 2018.01.10 M 7.6 Cayman Trough
- 2016.01.17 M 5.1 pair Cuba
Caribbean
General Overview
Earthquake Reports
- 2017.09.19 M 7.1 Puebla, Mexico
- 2017.09.19 M 7.1 Puebla, Mexico Update #1
- 2017.09.08 M 8.1 Chiapas, Mexico
- 2017.09.08 M 8.1 Chiapas, Mexico Update #1
- 2017.09.23 M 8.1 Chiapas, Mexico Update #2
- 2017.06.22 M 6.8 Guatemala
- 2017.06.14 M 6.9 Guatemala
- 2017.05.12 M 6.2 El Salvador
- 2017.03.29 M 5.7 Gulf of California
- 2016.11.24 M 7.0 El Salvador
- 2016.04.29 M 6.6 East Pacific Rise / MAT
- 2016.01.21 M 6.6 Mexico
- 2015.09.13 M 6.6 Gulf California
- 2015.09.13 M 6.6 Gulf California Update #1
- 2014.10.14 M 7.3 El Salvador
- 2013.10.20 M 6.4 Gulf California
Mexico | Central America
General Overview
Earthquake Reports
- Benz, H.M., Tarr, A.C., Hayes, G.P., Villaseñor, Antonio, Furlong, K.P., Dart, R.L., and Rhea, Susan, 2011. Seismicity of the Earth 1900–2010 Caribbean plate and vicinity: U.S. Geological Survey Open-File Report 2010–1083-A, scale 1:8,000,000.
- Franco, A., C. Lasserre H. Lyon-Caen V. Kostoglodov E. Molina M. Guzman-Speziale D. Monterosso V. Robles C. Figueroa W. Amaya E. Barrier L. Chiquin S. Moran O. Flores J. Romero J. A. Santiago M. Manea V. C. Manea, 2012. Fault kinematics in northern Central America and coupling along the subduction interface of the Cocos Plate, from GPS data in Chiapas (Mexico), Guatemala and El Salvador in Geophysical Journal International., v. 189, no. 3, p. 1223-1236. DOI: https://doi.org/10.1111/j.1365-246X.2012.05390.x
- Garcia-Casco, A., Projenza, J.A., Iturralde-Vinent, M.A., 2011. Subduction Zones of the Caribbean: the sedimentary, magmatic, metamorphic and ore-deposit records UNESCO/iugs igcp Project 546 Subduction Zones of the Caribbean in Geologica Acta, v. 9, no., 3-4, p. 217-224
- Hayes, G. P., D. J. Wald, and R. L. Johnson, 2012. Slab1.0: A three-dimensional model of global subduction zone geometries, J. Geophys. Res., 117, B01302, doi:10.1029/2011JB008524.
- Mann, P., Tyburski, S.A., and Rosencratz, E., 1991. Neogene development of the Swan Islands restraining-bend complex, Caribbean Sea in Geology, v. 19, p. 823-826.
- Symithe, S., E. Calais, J. B. de Chabalier, R. Robertson, and M. Higgins, 2015. Current block motions and strain accumulation on active faults in the Caribbean in J. Geophys. Res. Solid Earth, v. 120, p. 3748–3774, doi:10.1002/2014JB011779.
- Ten Brink, U.S., Coleman, D.F., and Dillon, W.P., 2002. The nature of the crust under Cayman Trough from gravity in Marine and Petroleum Geology, v. 119, p. 971-987.
2 thoughts on “Earthquake Report: Cayman Trough!”