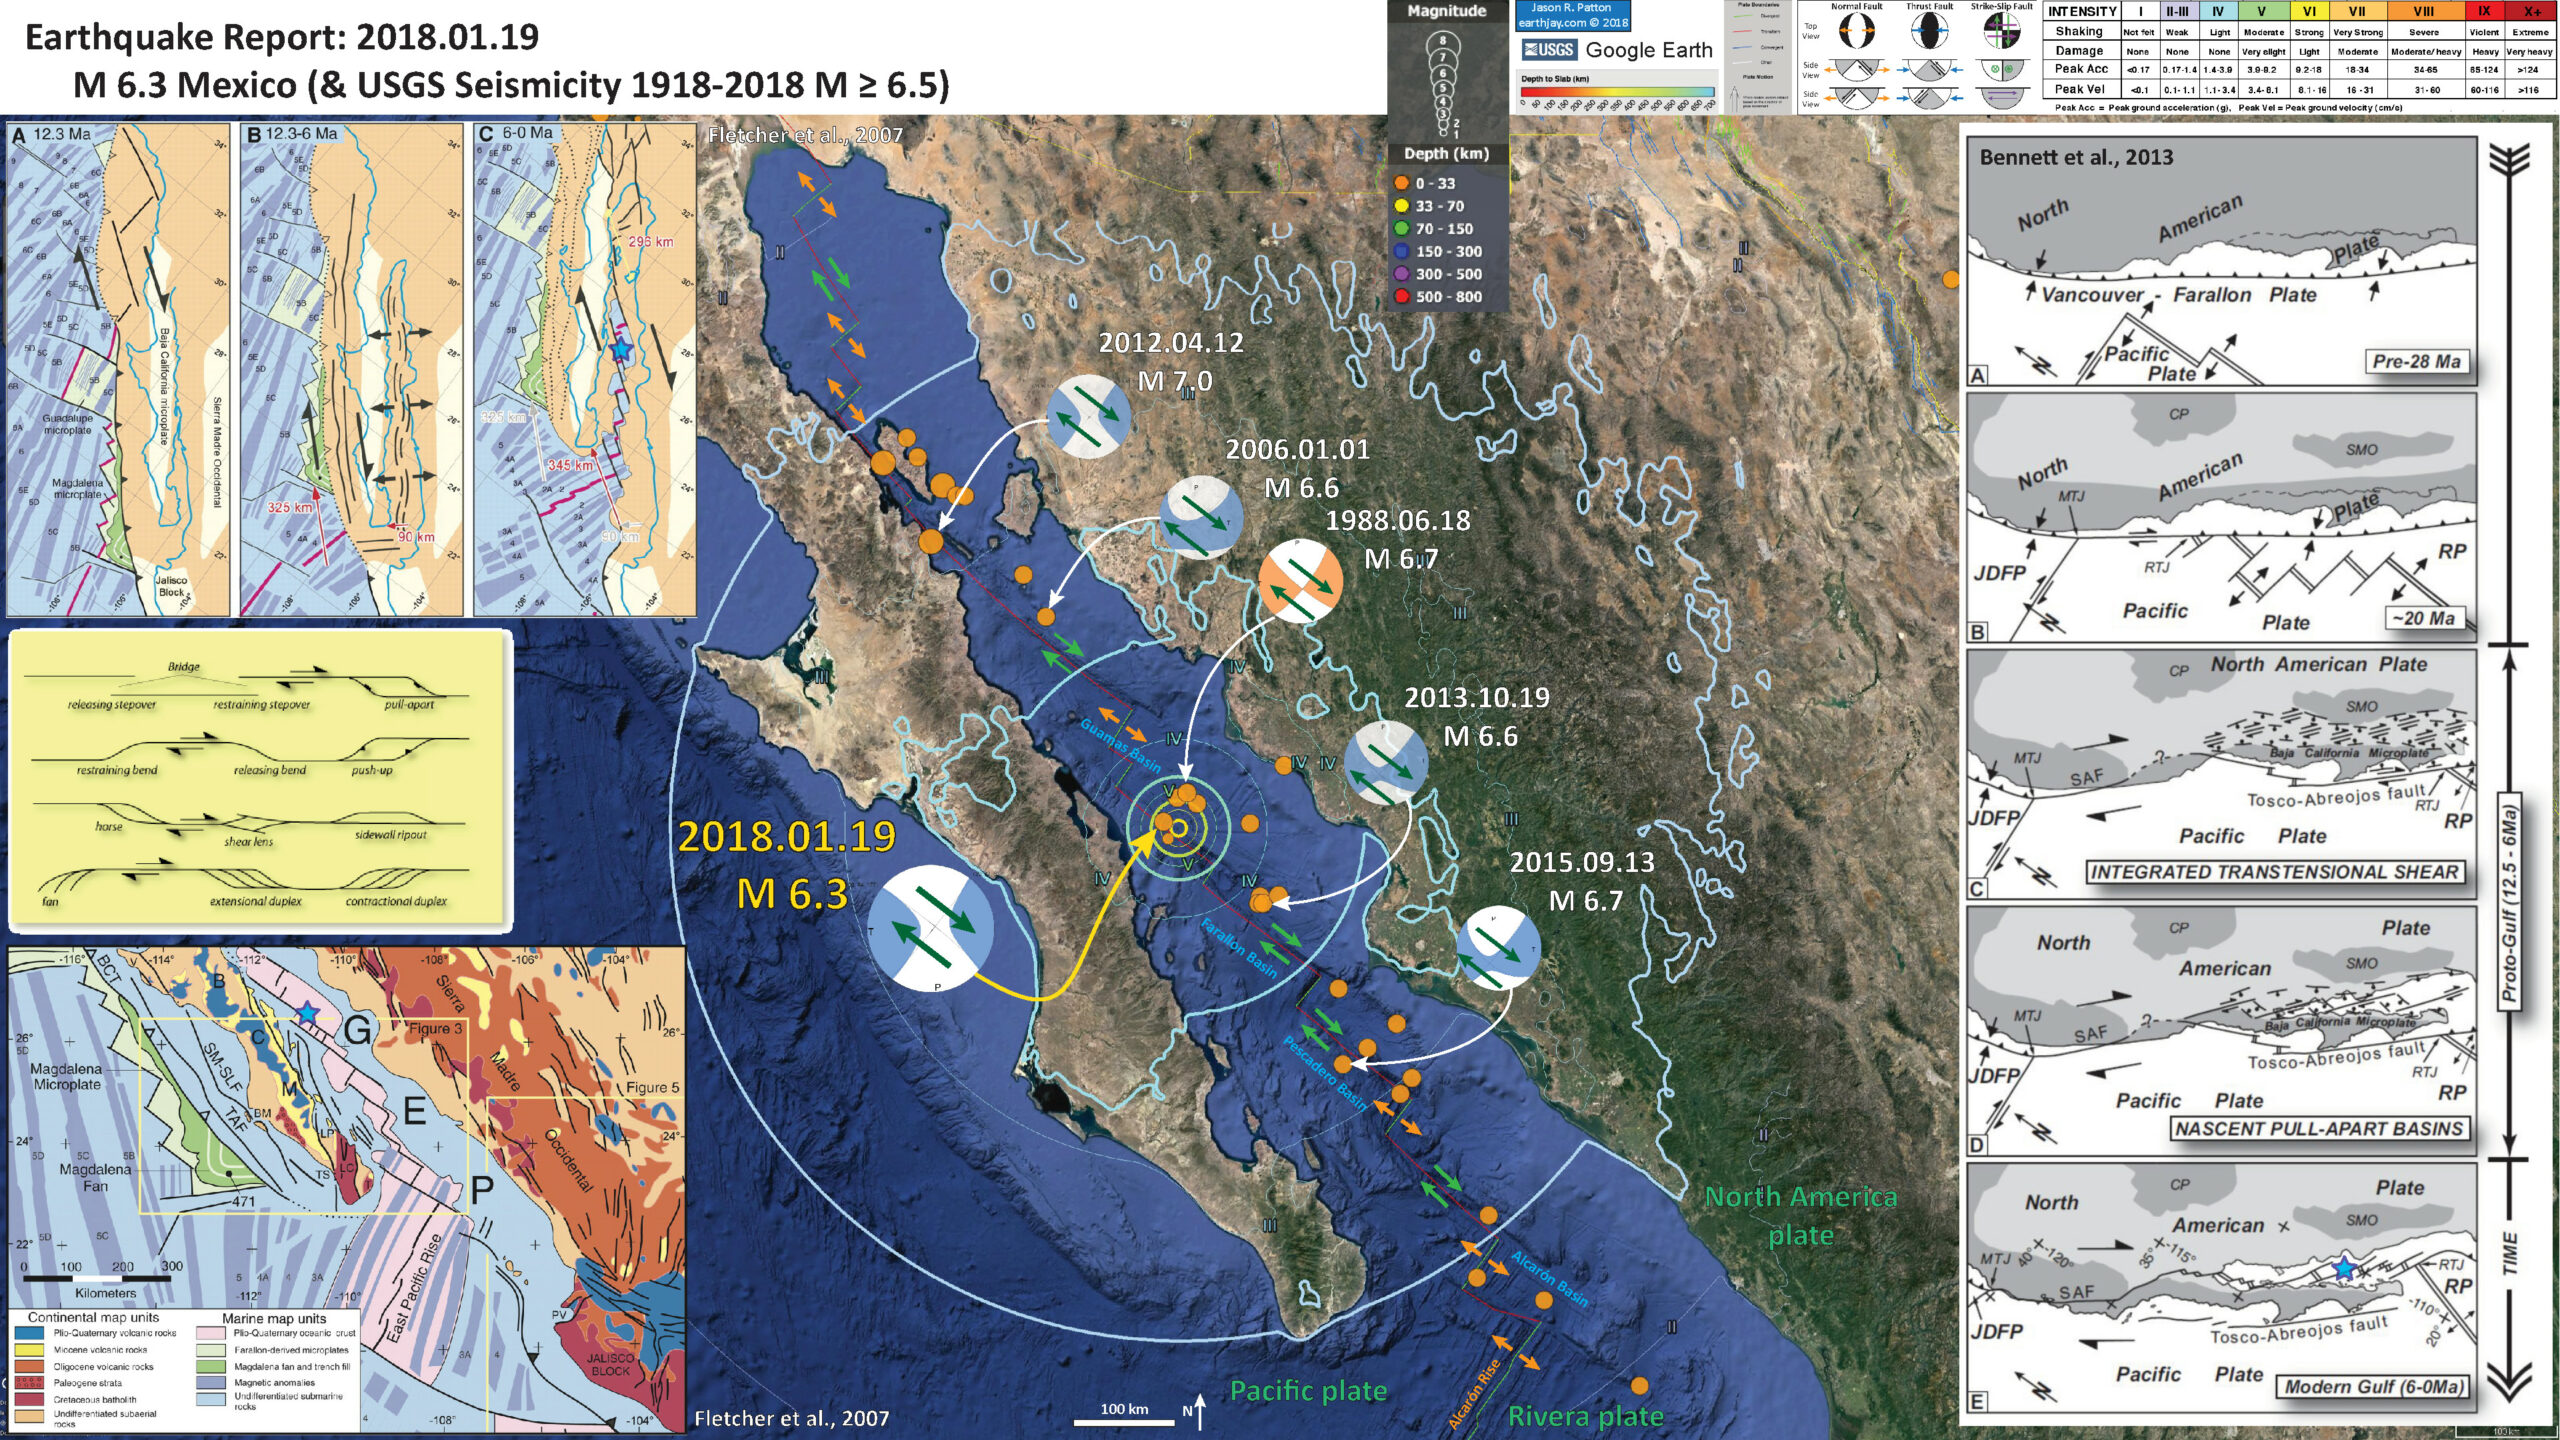
Today we had an earthquake with magnitude M 6.3 in the Gulf of California (GOC). The GOC is formed by transtension (extension along a strike-slip fault system) along the North-America-Pacific plate boundary. Transtension happens when the plate motion across a fault is not oriented parallel to the fault. This non-optimal relation (plate motion vs fault direction) can generally happen as a result of (1) a bending fault or (2) due to stepped offsets of the fault. The dextral (right-lateral) strike-slip faults here make “right-steps” and pull apart basins form in these locations.
The strike-slip faults are offset by oceanic spreading ridges. These spreading ridges are connected the East Pacific Rise to the south (and the Juan de Fuca Ridge and Gorda Rise to the north, via the San Andreas fault).
The geology of this region is much more complicated than this, but this is a good place to start when trying to understand the tectonics here. This M 6.3 earthquake happened on the southern boundary of the Guamas Basin, one of these pull apart basins.
So far there has been a single aftershock (M 4.5).
This M 6.3 earthquake appears to be pretty typical of this part of the Gulf. There have been several M 6 earthquakes in the last century. There have been a couple M 7 earthquakes, to the north.
Below is my interpretive poster for this earthquake
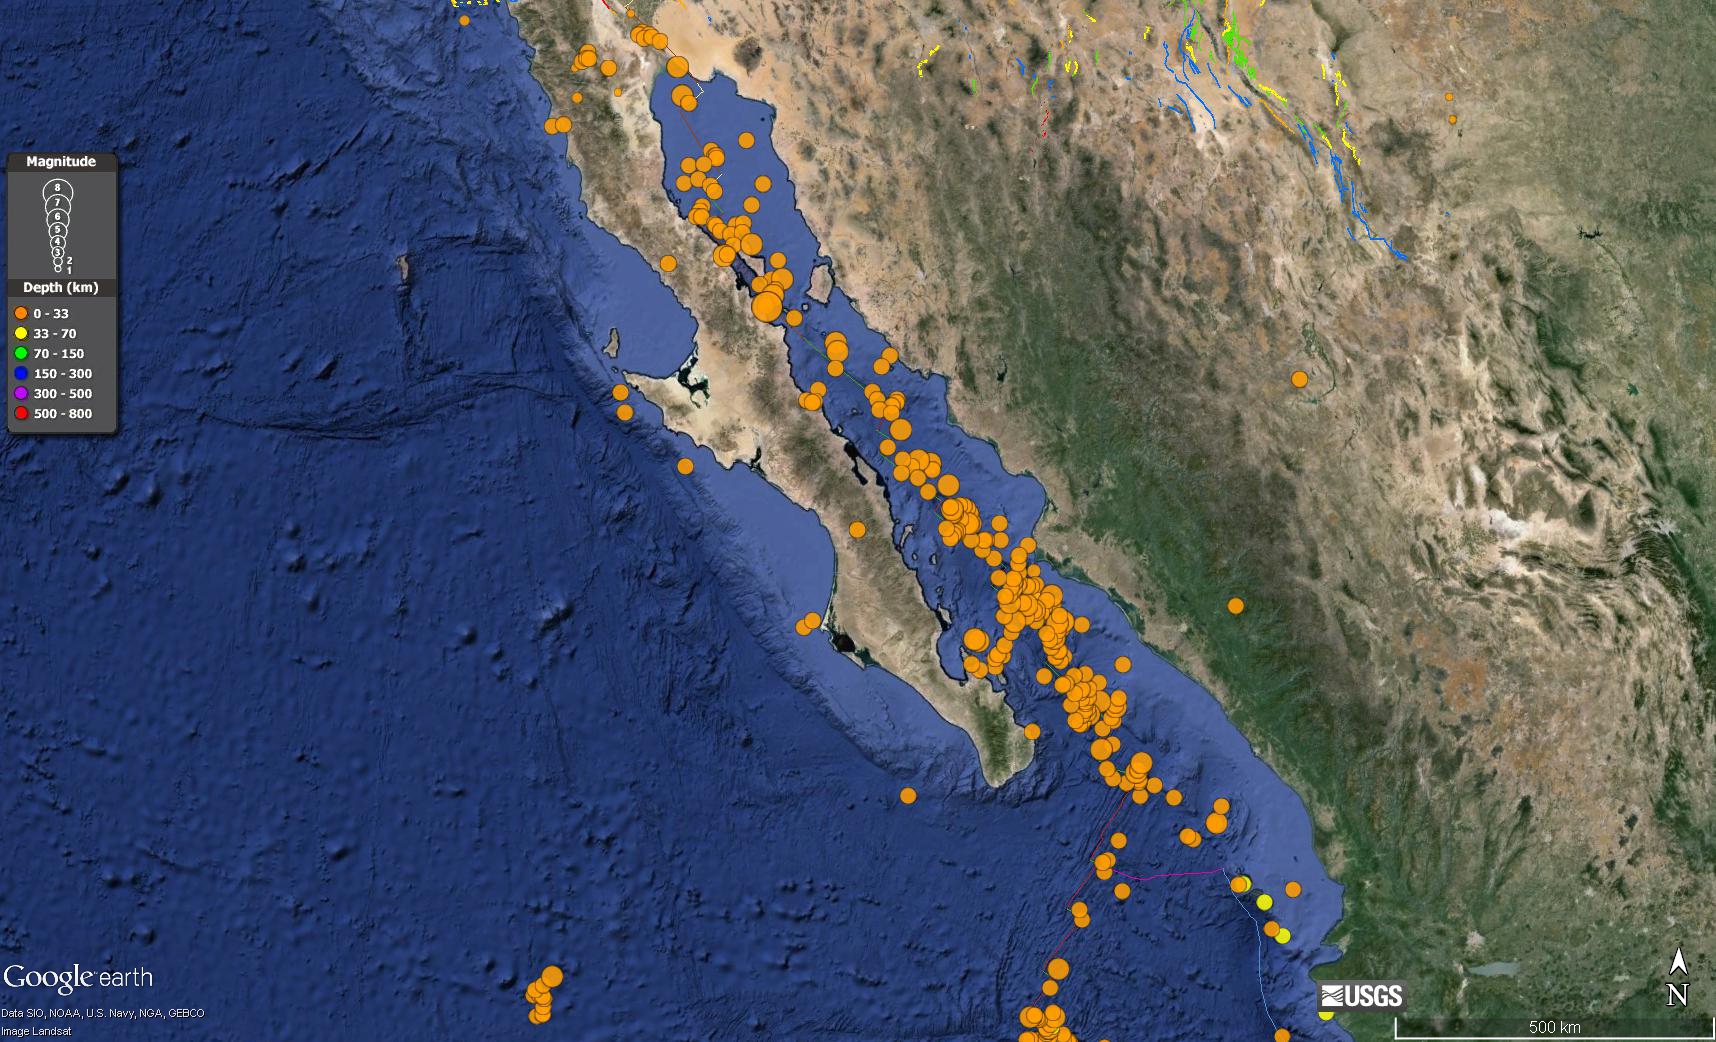
I plot the seismicity from the past month, with color representing depth and diameter representing magnitude (see legend). I include earthquake epicenters from 1918-2018 with magnitudes M ≥ 6.5.
I plot the USGS fault plane solutions (moment tensors in blue and focal mechanisms in orange) for the M 6.3 earthquakes, in addition to some relevant historic earthquakes.
I labeled the pull-apart basins in cyan and the faults in light orange. CdBF – C. de Ballenas fault; GF – Guaymas fault; CF – Carmen fault; FF – Farallon fault; PF – Pescadero fault; AF – Alcaron fault; AR – Alcaron Ridge (from Aragón-Arreola, M. and Martín-Barajas, A., 2007).
- I placed a moment tensor / focal mechanism legend on the poster. There is more material from the USGS web sites about moment tensors and focal mechanisms (the beach ball symbols). Both moment tensors and focal mechanisms are solutions to seismologic data that reveal two possible interpretations for fault orientation and sense of motion. One must use other information, like the regional tectonics, to interpret which of the two possibilities is more likely.
- I also include the shaking intensity contours on the map. These use the Modified Mercalli Intensity Scale (MMI; see the legend on the map). This is based upon a computer model estimate of ground motions, different from the “Did You Feel It?” estimate of ground motions that is actually based on real observations. The MMI is a qualitative measure of shaking intensity. More on the MMI scale can be found here and here. This is based upon a computer model estimate of ground motions, different from the “Did You Feel It?” estimate of ground motions that is actually based on real observations.
- In the lower left corner I include a map that shows the tectonic setting of this region, with the geological units colored relative to their age and type (marine or continental). This is from a paper that discusses the interaction between spreading ridges and subduction trenches (Fletcher et al., 2007). I place a blue star in the general location of today’s earthquake.
- In the upper left corner is the plate tectonic history for the past 12.3 Ma from Fletcher et al. (2007). I place a blue star in the general location of today’s earthquake.
- Between the 2 Fletcher et al. (2007) figures is a figure that shows how there can be extension and compression along strike-slip figures.
- Along the right side is the tectonic history of the GOC as interpreted by Bennett et al. (2013). I place a blue star in the general location of today’s earthquake. I used to think that the spreading ridges in the GOC were from the ridge that originally formed the Farallon plate. However, I have learned that the GOC extension formed as a result of the misfit of the plate boundary relative to plate motions (causing transtension).
I include some inset figures.

- On 2017.03.29 there was an M 5.7 earthquake in this same region as today’s M 6.3 earthquake. Here is my report and below is my interpretive poster.

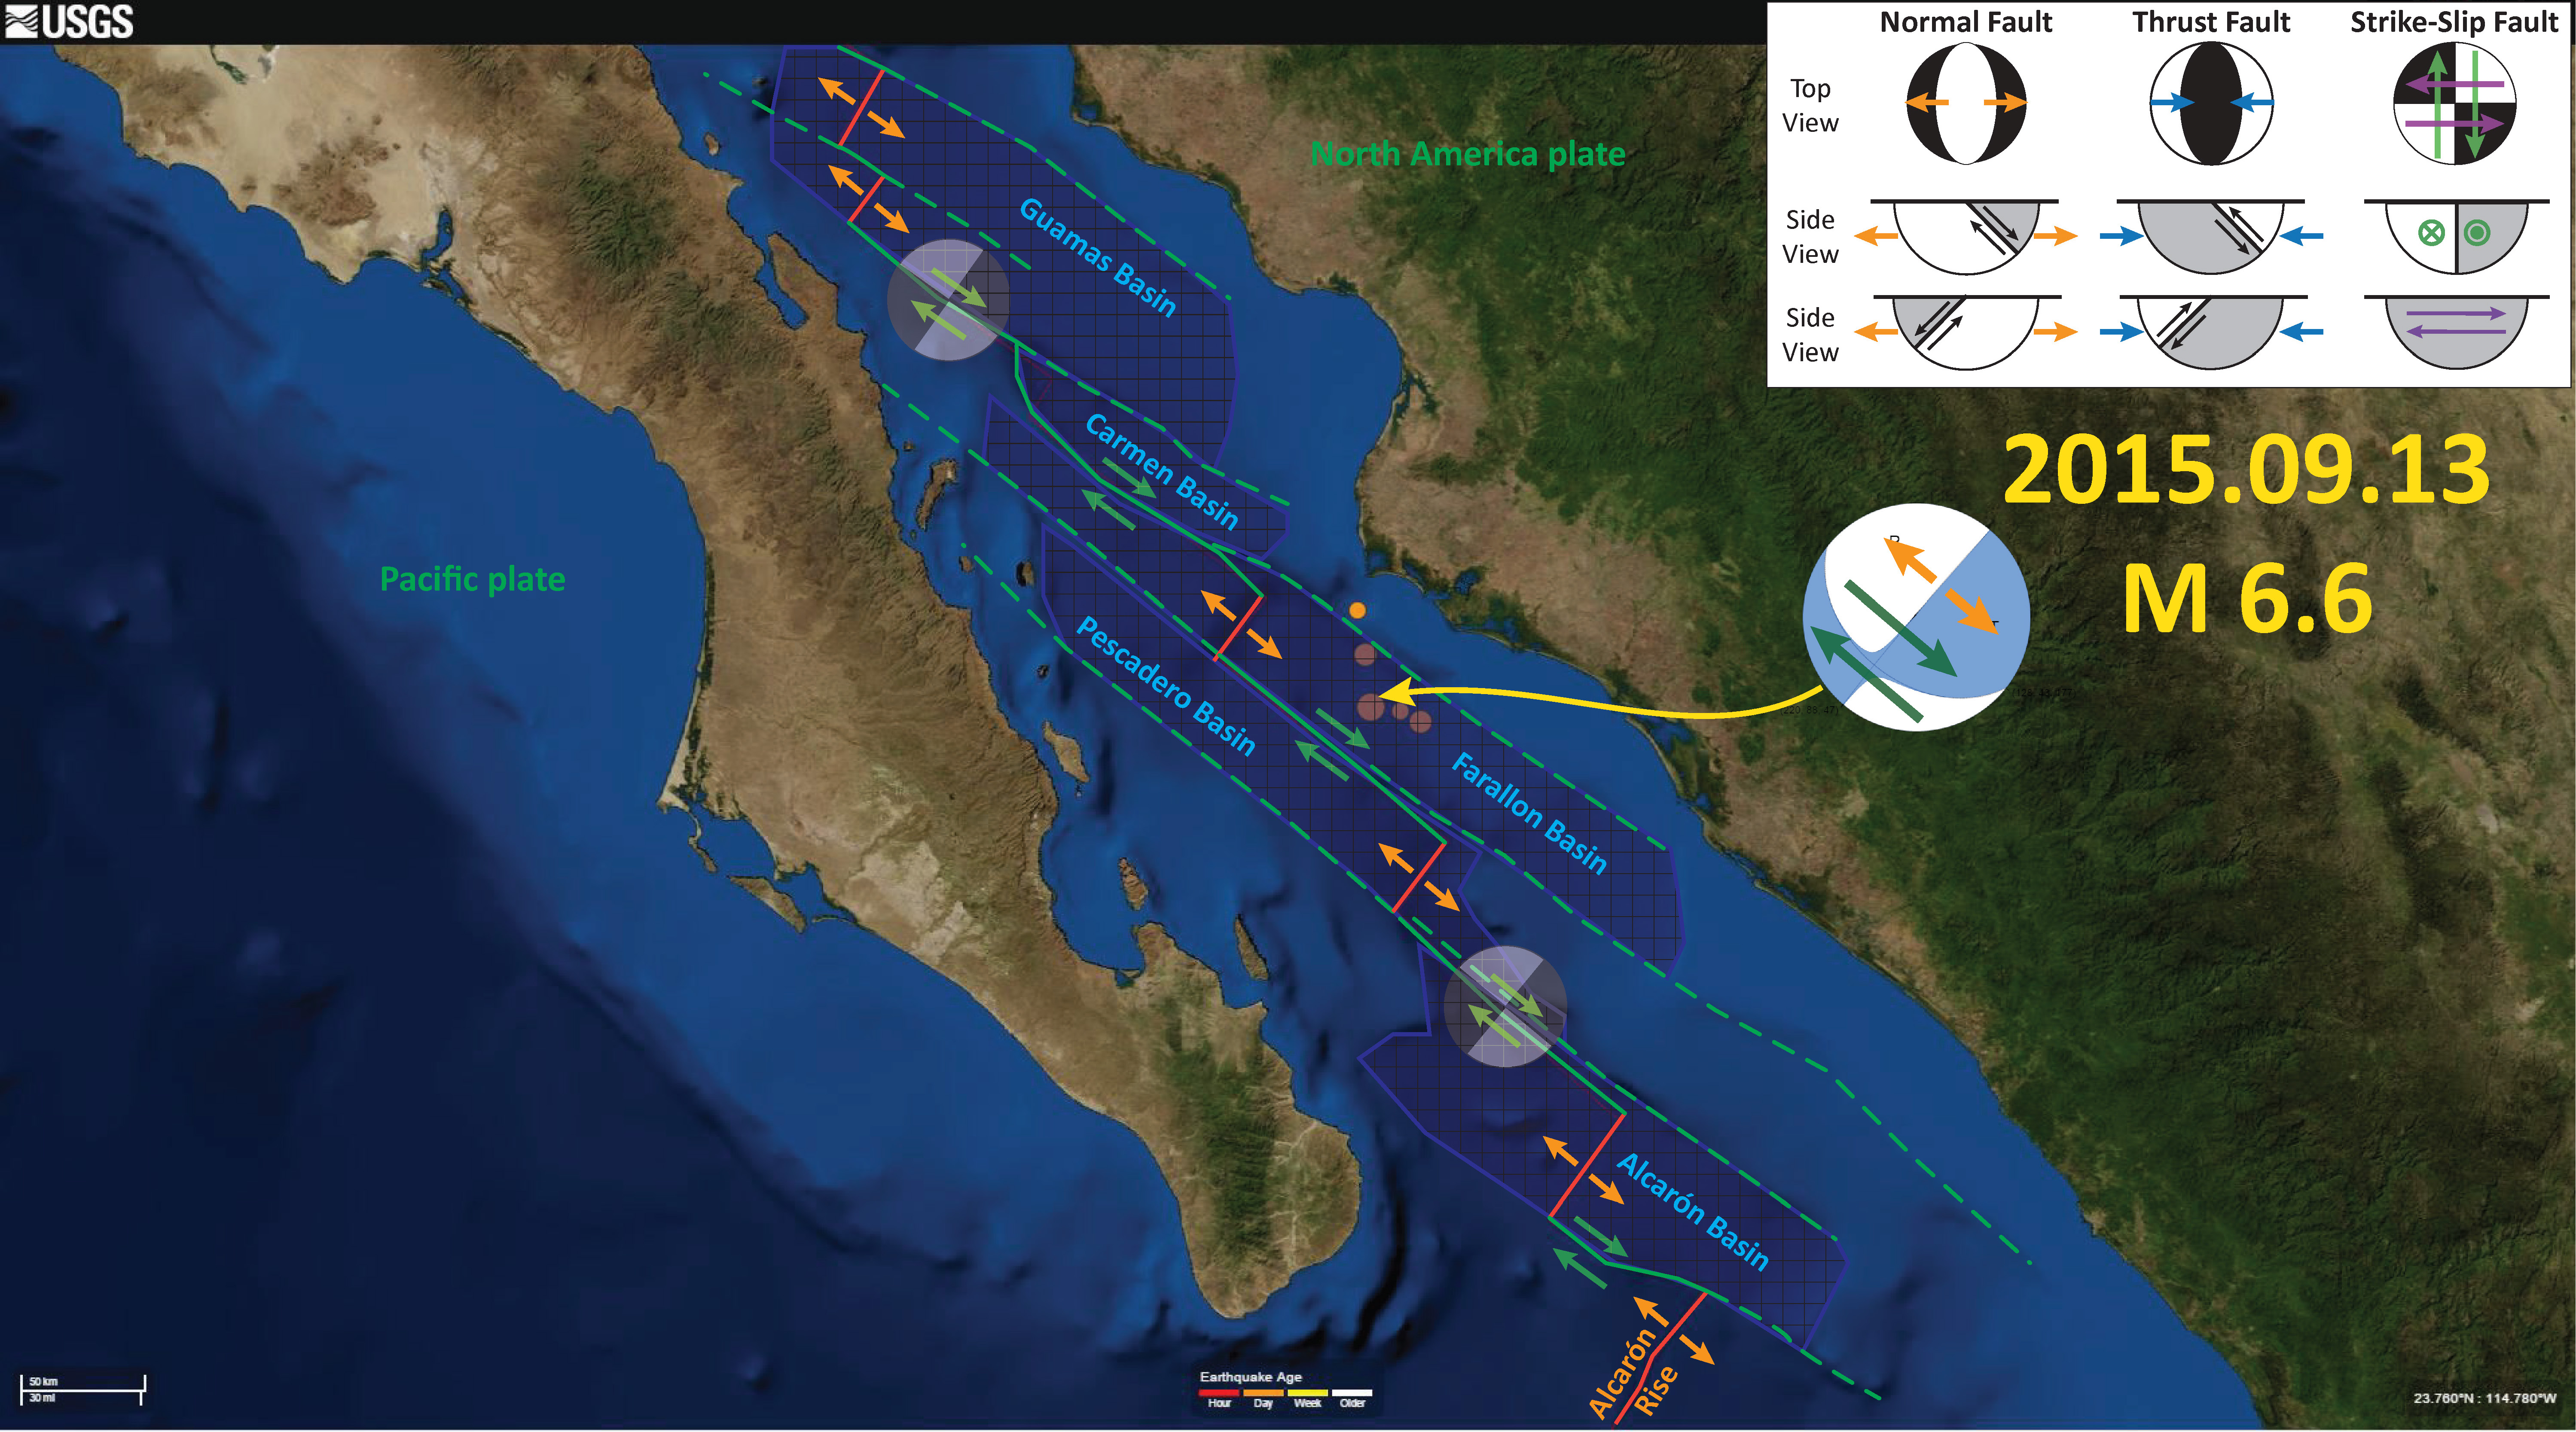
- There was an earthquake on 2015.09.13 (M 6.6) located in the area of the Farallon Basin (here is my earthquake report page and the update page). Below is a map I prepared that shows the general location of the pull-apart basins along this plate boundary.
- Here is a fantastic animation showing the tectonic history of the GOC for the past 11 million years (Bennet et al., 2016). This animation was created using existing geological maps and fault data (geometry, changing or static slip-rates) and backing out the motion on the faults to create a map of what the geology looked like in the past.
- There are several ways to do this and Bennett et al. (2016) use a Palinspastic reconstruction technique. These authors hypothesize that, based upon their observations, the transtension along this plate boundary promoted subsidence in the GOC. Read more about the Colorado River and how it responded to this tectonic forcing in their paper.
- This is the Bennet et al. (2013) figure from the poster, which shows their interpretation for the tectonic history of the GOC. This is based largely on their tectonic reconstructions in the northern GOC.
![]()
Modified integrated transtensional shear model for the tectonic evolution of the Gulf of California. North America plate fixed. (A) Prior to 28 Ma, the spreading center between Pacific and Vancouver-Farallon tectonic plates approached the subduction zone between North America and Vancouver-Farallon plates. (B) By ca. 20 Ma, contact between the Pacific and North America plates created early dextral transform relative plate motion. The Basin and Range extensional province (light gray) accommodated moderate extension throughout western North America. (C) The Rivera triple junction migrated the full length of the Baja California Peninsula by ca. 12.5 Ma, lengthening the Pacific–North American transform plate boundary. The proto–Gulf of California period commenced (ca.12.5 Ma) with transtensional strain distributed across two distinct transtensional deformation belts, west and east of the stable Baja California microplate. (D) In late proto–Gulf of California time, shear deformation gradually localized within a narrow belt of focused en- echelon dextral shear zones embedded within the greater Mexican Basin and Range extensional province. These shear zones and intervening extensional regions both experienced high-magnitude strain. (E) By ca. 6 Ma, Pacific–North America plate boundary strain was localized and focused crustal thinning and subsidence in transtensional pull-apart basins that formed the Gulf of California. Faults shown represent primary structures active during Quaternary time. RP—Rivera plate, JDFP—Juan de Fuca plate, RTJ—Rivera triple junction, MTJ—Mendocino triple junction, SAF— San Andreas fault, CP—Colorado Plateau, SMO—Sierra Madre Occidental.
- This is the Sutherland et al. (2012) interpretation of the geological history for the plate boundary in this region. These authors used seismic reflection data (multi-channel seismic) from a profile oriented parallel to the Alarcón Basin (perpendicular to the spreading ridge).

The model for the tectonic evolution of the Gulf of California (GOC). (A) The starting point of the evolution of the GOC began 14–12 Ma, where the Magdalena rise stalled off the west coast of Baja California; there was also a marked changed in the style of volcanism. Plate motion was split between the dying spreading ridge, subduction zone, and the new highly oblique extension in the proto–GOC. During this time, the dipping part of the subducted plate appears to have broken off, opening a slab window beneath the southern Baja peninsula. NAM—North American plate; PAC—Pacific plate. (B) Another major change in the system occurs near 8–7 Ma, where the volcanic style changes once again with many lavas of unusual composition deposited. Any minor component of spreading finally ceases and the Tosco-Abreojos fault forms within the borderlands west of Baja. Oblique extension continues in the GOC. (C) Seafloor spreading begins at the Alarcón Rise between 4 and 3 Ma. Small amounts of movement continue along the Tosco-Abreojos fault (TAF); even today the Baja peninsula is not fully transferred to the Pacific plate.
- This shows the location of the Sutherland et al. (2012) seismic reflection profile.

Map showing location of Alarcón transect and the major basins along the profile.
- This is the overview of the Sutherland et al. (2012) seismic reflection data.

An overview of multichannel seismic transect data presented in this paper. Seismic data are post-stack time migrated. TWTT—two-way travel time.
- This is an example of the Sutherland et al. (2012) seismic reflection data, showing their interpretation in the lower panel. Note the extensive normal (and perhaps strike-slip) faulting (remember, we are in an extensional basin).

East Cerralvo basin. The uninterpreted (top) and interpreted (bottom) seismic profi les are shown. TWTT—two-way traveltime. Basement reflections are highlighted in blue, and sedimentary sequence boundaries are separated by green lines, with faults shown in red. Basement has a reflective discontinuous appearance. Unit 1 (divided into 1a and 1b) is a synrift deposit, with a chaotic character; unit 2 (divided into 2a and 2b) exhibits rotation and divergence and appears to be synrift; unit 3 consists of postrift, layered deeper water marine sediments. Two surface-cutting normal faults at the southeast end appear younger than the main basin, although the exact relationship of faulting is unclear and they appear to be overprinted by current-controlled erosion.
- Here is a great diagram showing the major faults in the region (Umhoefer et al., 2002). I include their figure caption below.
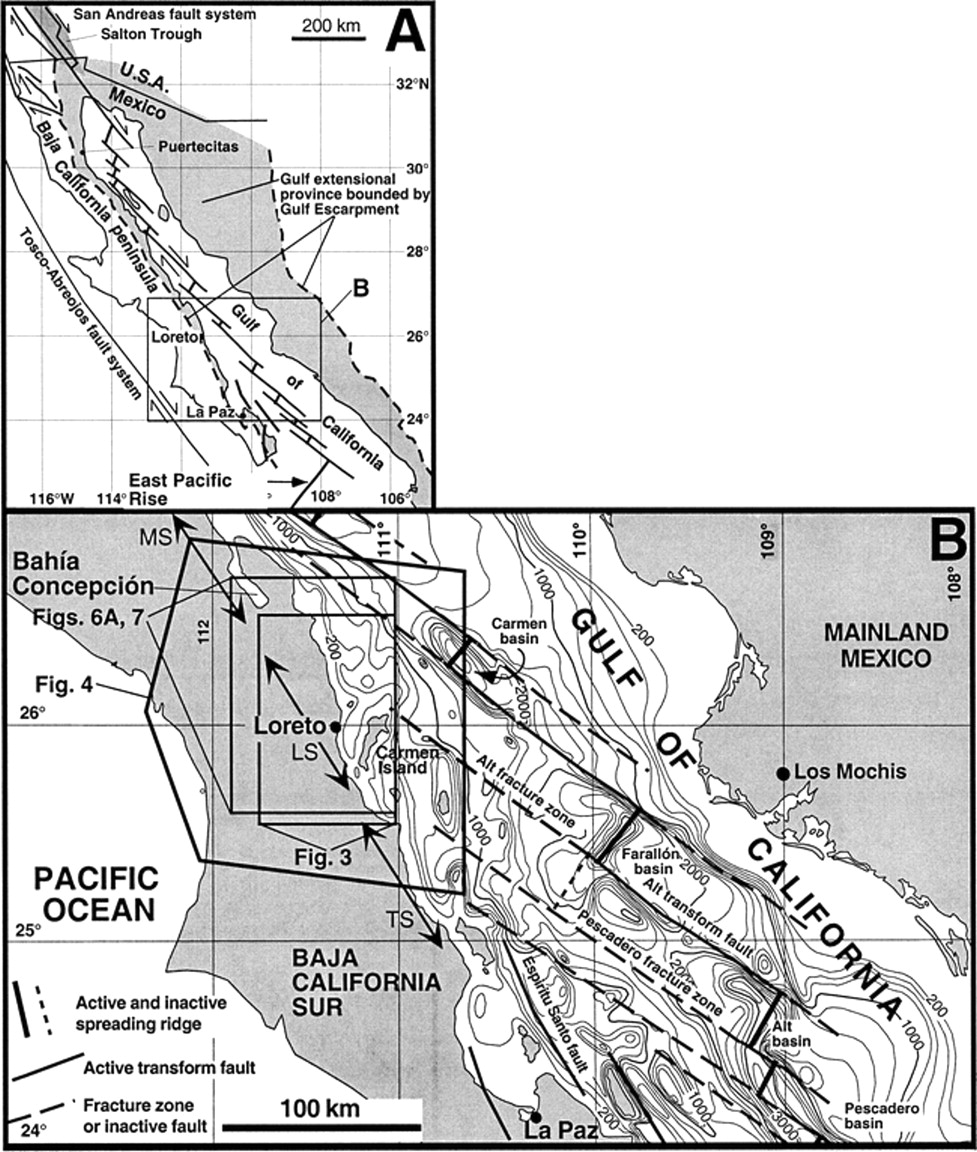
(A) Simplified map of the Gulf of California region and Baja California peninsula showing the present plate boundary and some major tectonic features related to the plate-tectonic history since 12 Ma. The Gulf extensional province in gray is bounded by the Main Gulf Escarpment (bold dashed lines), which runs through the Loreto area and is shown in Figure 3. The Salton trough in southern California is merely the northern part of the Gulf extensional province. (B) Map of part of the southern Gulf of California and Baja California peninsula showing bathymetry (in meters), the transform–spreading-ridge plate boundary, and the location of subsequent figures with maps. The bathymetry is after a map in Ness and Lyle (1991) and the transform–spreading-ridge plate boundary is from Lonsdale (1989). The lines with double arrows are the three proposed rift segments modified here after Axen (1995); MS—Mulege´ segment, LS—Loreto segment, TS—Timbabichi
segment.
- This map shows the magnetic anomalies and the geologic map for the land and the youngest oceanic crust.
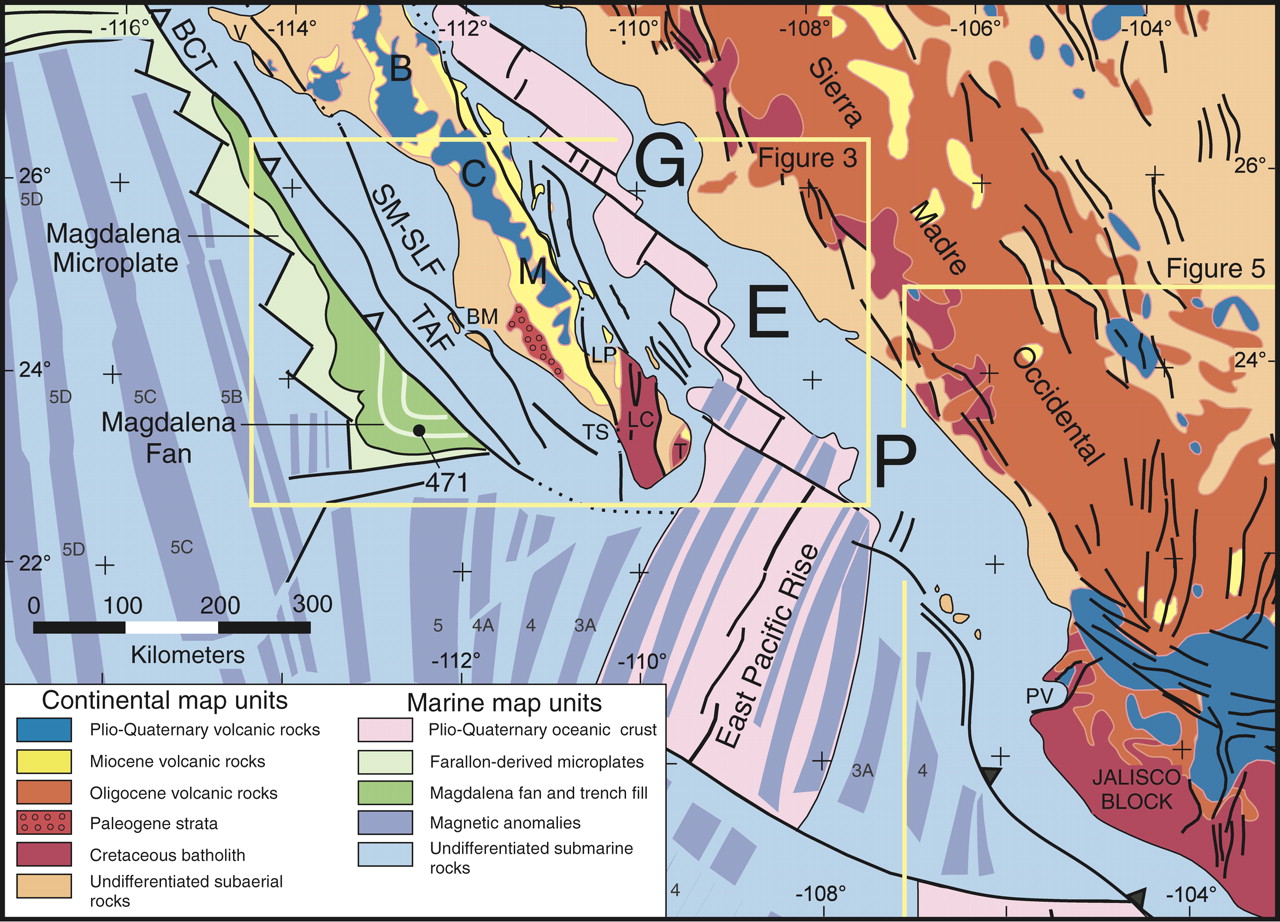
(A) Tectonic map of the southern Baja California microplate (BCM) and Gulf of California extensional province (GEP). The Magdalena fan is deposited on oceanic crust of the Farallon-derived Magdalena microplate located west of Baja California. Deep Sea Drilling Project Site 471 is shown as black dot on the Magdalena fan. Abbreviations: BCT—Baja California trench, BM—Bahia Magdalena, LC—Los Cabos block, T—Trinidad block, LP—La Paz, PV—Puerto Vallarta, SMSLF—Santa Margarita–San Lazaro fault, TAF—Tosco-Abreojos fault, TS—Todos Santos, V—Vizcaino peninsula. Geology is simplifi ed from Muehlberger (1996). Interpretation of marine magnetic anomalies, with numbers denoting the chron of positively magnetized stripes, is from Severinghaus and Atwater (1989) and Lonsdale (1991).
- This map shows a more broad view of the magnetic anomalies through time.
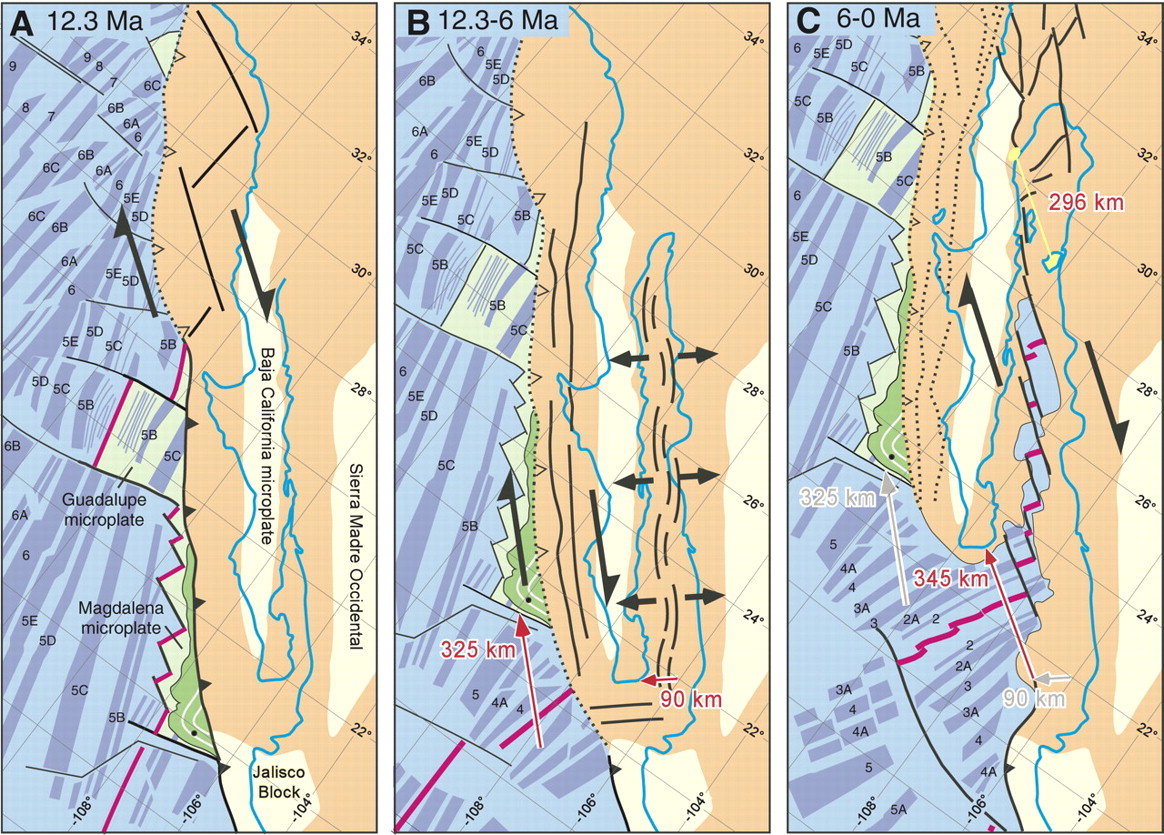
Map-view time slices showing the widely accepted model for the two-phase kinematic evolution of plate margin shearing around the Baja California microplate. (A) Configuration of active ridge segments (pink) west of Baja California just before they became largely abandoned ca. 12.3 Ma. (B) It is thought that plate motion from 12.3 to 6 Ma was kinematically partitioned into dextral strike slip (325 km) on faults west of Baja California and orthogonal rifting in the Gulf of California (90 km). This is known as the protogulf phase of rifting. (C) From 6 to 0 Ma faults west of Baja California are thought to have died and all plate motion was localized in the Gulf of California, which accommodated ~345 km of integrated transtensional shearing. Despite its wide acceptance, our data preclude this kinematic model. In all frames, the modern coastline is blue. Continental crust that accommodated post–12.3 Ma shearing is dark brown. Unfaulted microplates of continental crust are light tan. Farallon-derived microplates are light green. Middle Miocene trench-filling deposits like the Magdalena fan are colored dark green. Deep Sea Drilling Project Site 471 is the black dot on the southern Magdalena microplate. Yellow line (296 km) in the northern Gulf of California connects correlated terranes of Oskin and Stock (2003). Maps have Universal Transverse Mercator zone 12 projection with mainland Mexico fixed in present position.
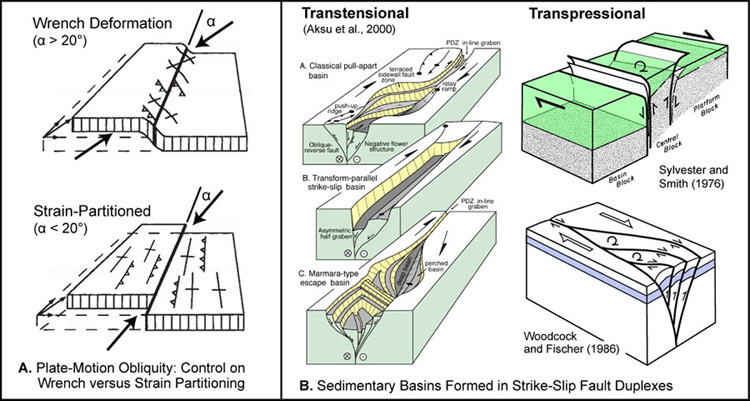
- This is a nice simple figure, from the University of Sydney here, showing the terminology of strike slip faulting. It may help with the following figures.
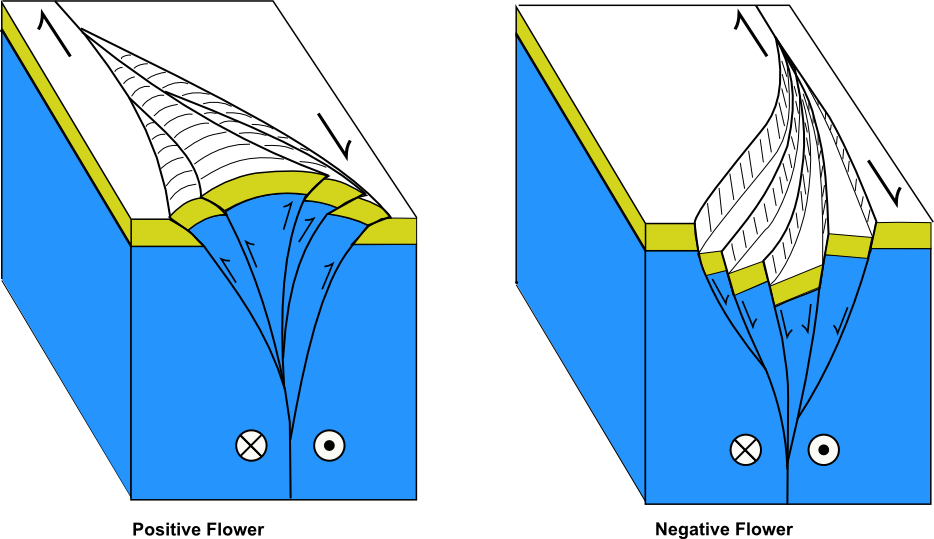
- Here is a fault block diagram showing how strike-slip step overs can create localized compression (positive flower) or extension (negative flower). More on strike-slip tectonics (and the source of this image) here.
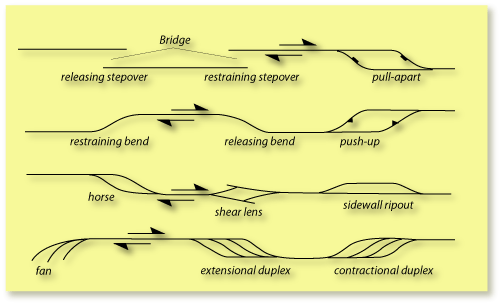
- Here is another great figure showing how sedimentary basins can be developed as a result of step overs in strike slip fault systems (source: Becky Dorsey, University of Oregon, Dept. of Geological Sciences).
- I also put together an animation of seismicity from 1065 – 2015. First, here is a map that shows the spatial extent of this animation.
- Here is the animation link (2 MB mp4 file) if you cannot view the embedded video below. Note how the animation begins in 1965, but has the recent seismicity plotted for reference.
- This is an animation from Tanya Atwater. Click on this link to take you to yt (if the embedded video below does not work).
- Here is an animation from IRIS. This link takes you to yt (if you cannot view the embedded version below). Here is a link to download the 21 MB mp4 vile file.
Update
- I just found a paper that includes a map of the pull-apart basins in the northern GOC (Aragón-Arreola and Martín-Barajas, 2007). Today’s M 6.3 earthquake happened along the Carmen fault zone (labelled 11), close to where the letter L is located..
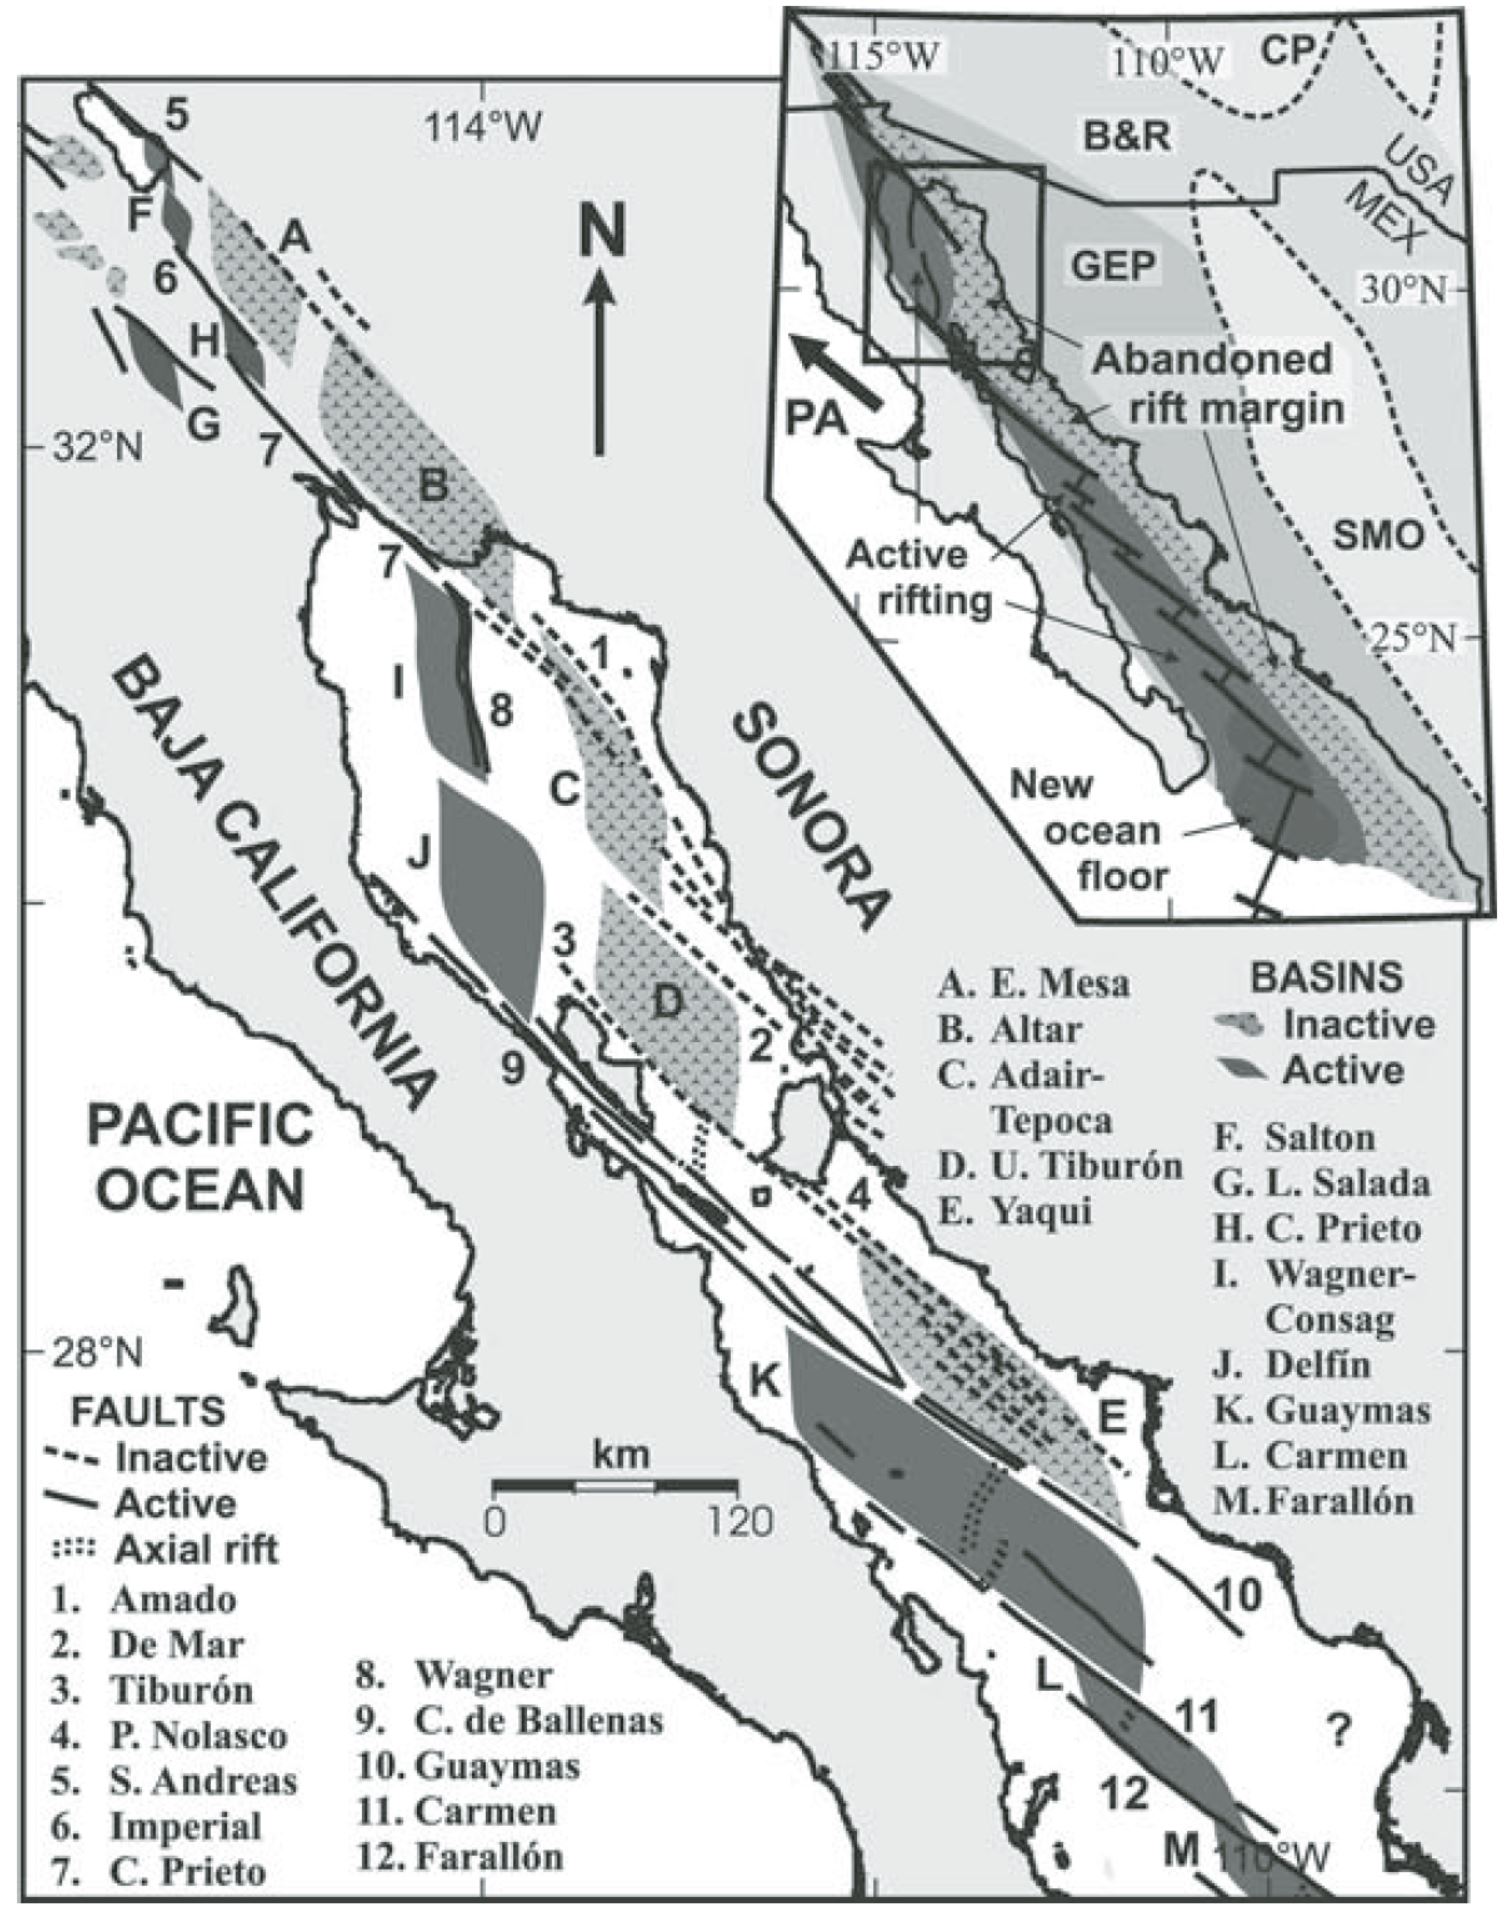
Eastern Gulf of California contains abandoned rift basins, while active rifting occurs in the western Gulf (Lonsdale, 1989; Fenby and Gastil, 1991; Persaud et al., 2003; Aragón-Arreola et al., 2005; this study). Eastern Gulf constitutes abandoned rift margin (see inset). PA—Pacifi c plate; GC—Gulf of California; GEP—Gulf Extensional Province; B&R—Basin
and Range Province; SMO—Sierra Madre Occidental; CP—Colorado Plateau: ITI—Isla Tiburón; IAG—Isla Ángel de la Guarda.
Social Media
Gulf of California #Earthquake
Mw 6.3, Depth 10km
Focal Mechanism by @GFZ_Potsdam pic.twitter.com/Tah7HaHGCt— Ehsan Kosari (@ehsan_seismo) January 19, 2018
M6.3 Earthquake, Max. Intensity V (light to moderate shaking felt) – 77km NNE of Loreto, Mexico (in the Gulf of California). 2018-01-19 09:17 AM local time. PAGER: Green. (Low likelihood of casualties and damage). @USGS Event Page: https://t.co/11DCL51sX8 pic.twitter.com/PlWUe2vq8m
— SCEC (@SCEC) January 19, 2018
Mw=6.3, GULF OF CALIFORNIA (Depth: 6 km), 2018/01/19 16:17:44 UTC – Full details here: https://t.co/wIoiiCn8Sg pic.twitter.com/JS5Pmd33K4
— Earthquakes (@geoscope_ipgp) January 19, 2018
Gulf of California Tectonic Setting—Earthquakes & the Spreading Ridge https://t.co/jyEv9N5ly1 #earthquake #GulfofCalifornia pic.twitter.com/7sbuPtoIv1
— IRIS Earthquake Sci (@IRIS_EPO) January 19, 2018
Felt #earthquake (#sismo) M6.1 strikes 147 km SW of Ciudad Obregón (#Mexico) 9 min ago. https://t.co/w8mm58brIO pic.twitter.com/7oCiT5Jesw
— EMSC (@LastQuake) January 19, 2018
- 2018.01.19 M 6.3 Gulf of California
- 2017.09.19 M 7.1 Puebla, Mexico
- 2017.09.19 M 7.1 Puebla, Mexico Update #1
- 2017.09.08 M 8.1 Chiapas, Mexico
- 2017.09.08 M 8.1 Chiapas, Mexico Update #1
- 2017.09.23 M 8.1 Chiapas, Mexico Update #2
- 2017.06.22 M 6.8 Guatemala
- 2017.06.14 M 6.9 Guatemala
- 2017.05.12 M 6.2 El Salvador
- 2017.03.29 M 5.7 Gulf of California
- 2016.11.24 M 7.0 El Salvador
- 2016.04.29 M 6.6 East Pacific Rise / MAT
- 2016.01.21 M 6.6 Mexico
- 2015.09.13 M 6.6 Gulf California
- 2015.09.13 M 6.6 Gulf California Update #1
- 2014.10.14 M 7.3 El Salvador
- 2013.10.20 M 6.4 Gulf California
Mexico | Central America
General Overview
Earthquake Reports
References:
- Aragón-Arreola, M. and Martín-Barajas, A., 2007. Westward migration of extension in the northern Gulf of California, Mexico in Geology, v. 35; no. 6; p. 571–574; doi: 10.1130/G23360A.1
- Bennett, S.E.K., Oskin, M.E., and Irionondo, A., 2013. Transtensional rifting in the proto–Gulf of California near Bahía Kino, Sonora, México in GSA Bulletin; November/December 2013; v. 125; no. 11/12; p. 1752–1782; doi: 10.1130/B30676.1
- Bennett, S.E.K., Darin, M., Dorsey, R.J., Skinner, L.A., Umhoefer, P.J., and Oskin, M.E., 2016. Animated tectonic reconstruction of the Lower Colorado River region: implications for Late Miocene to Present deformation in Reynolds, R.E. eds., Proceedings for the 2016 Desert Symposium
- Fletcher, J.M., Grove, M., Kimbrough, D., Lovera, O., and Gehrels, G.E., 2007. Ridge-trench interactions and the Neogene tectonic evolution of the Magdalena shelf and southern Gulf of California: Insights from detrital zircon U-Pb ages from the Magdalena fan and adjacent areas in GSA Bulletin, v. 119, no. 11/12, p. 1313-1336.
- Sutherland, Fiona H.Kent, Graham M.Harding, Alistair J., Umhoefer, Paul J., Driscoll, Neal W., Lizarralde, Daniel, Fletcher, John M., Axen, Gary J., Holbrook, W. Steven, Gonzalez-Fernandez, Antonio, Lonsdale, Peter, 2012. Middle Miocene to early Pliocene oblique extension in the southern Gulf of California in Geosphere; August 2012; v. 8; no. 4; p. 752–770; doi:10.1130/GES00770.1
- Umhoefer, P.J., Mayer, L., and Dorse, R.J., 2002. Evolution of the margin of the Gulf of California near Loreto, Baja California Peninsula, Mexico in GSA Bulletin, v. 114, no. 7, p. 849-868.