An anniversary is for the Gorkha (Nepal) Earthquake from 1 year ago. I have several Earthquake Reports listed below. These include a variety of observations and comparisons with historic and prehistoric earthquakes that I compiled.
USGS slip models: http://earthjay.com/?p=2478
First Report: http://earthjay.com/?p=2357
Comparison with historic EQs http://earthjay.com/?p=2361
USGS Intensity Reports http://earthjay.com/?p=2387
Surface Displacement and Ground Motion Models http://earthjay.com/?p=2391
More historic comparisons http://earthjay.com/?p=2396
Coseismic Surface Deformation Model http://earthjay.com/?p=2410
Aftershock Report http://earthjay.com/?p=2437
Mainshock & Aftershock Update #1 http://earthjay.com/?p=2439
Mainshock & Aftershock Update #2 http://earthjay.com/?p=2450
Mainshock & Aftershock Update #3 (and interview with Ian Pierce and Steven Angster) http://earthjay.com/?p=2466
Here is a summary of the observations:
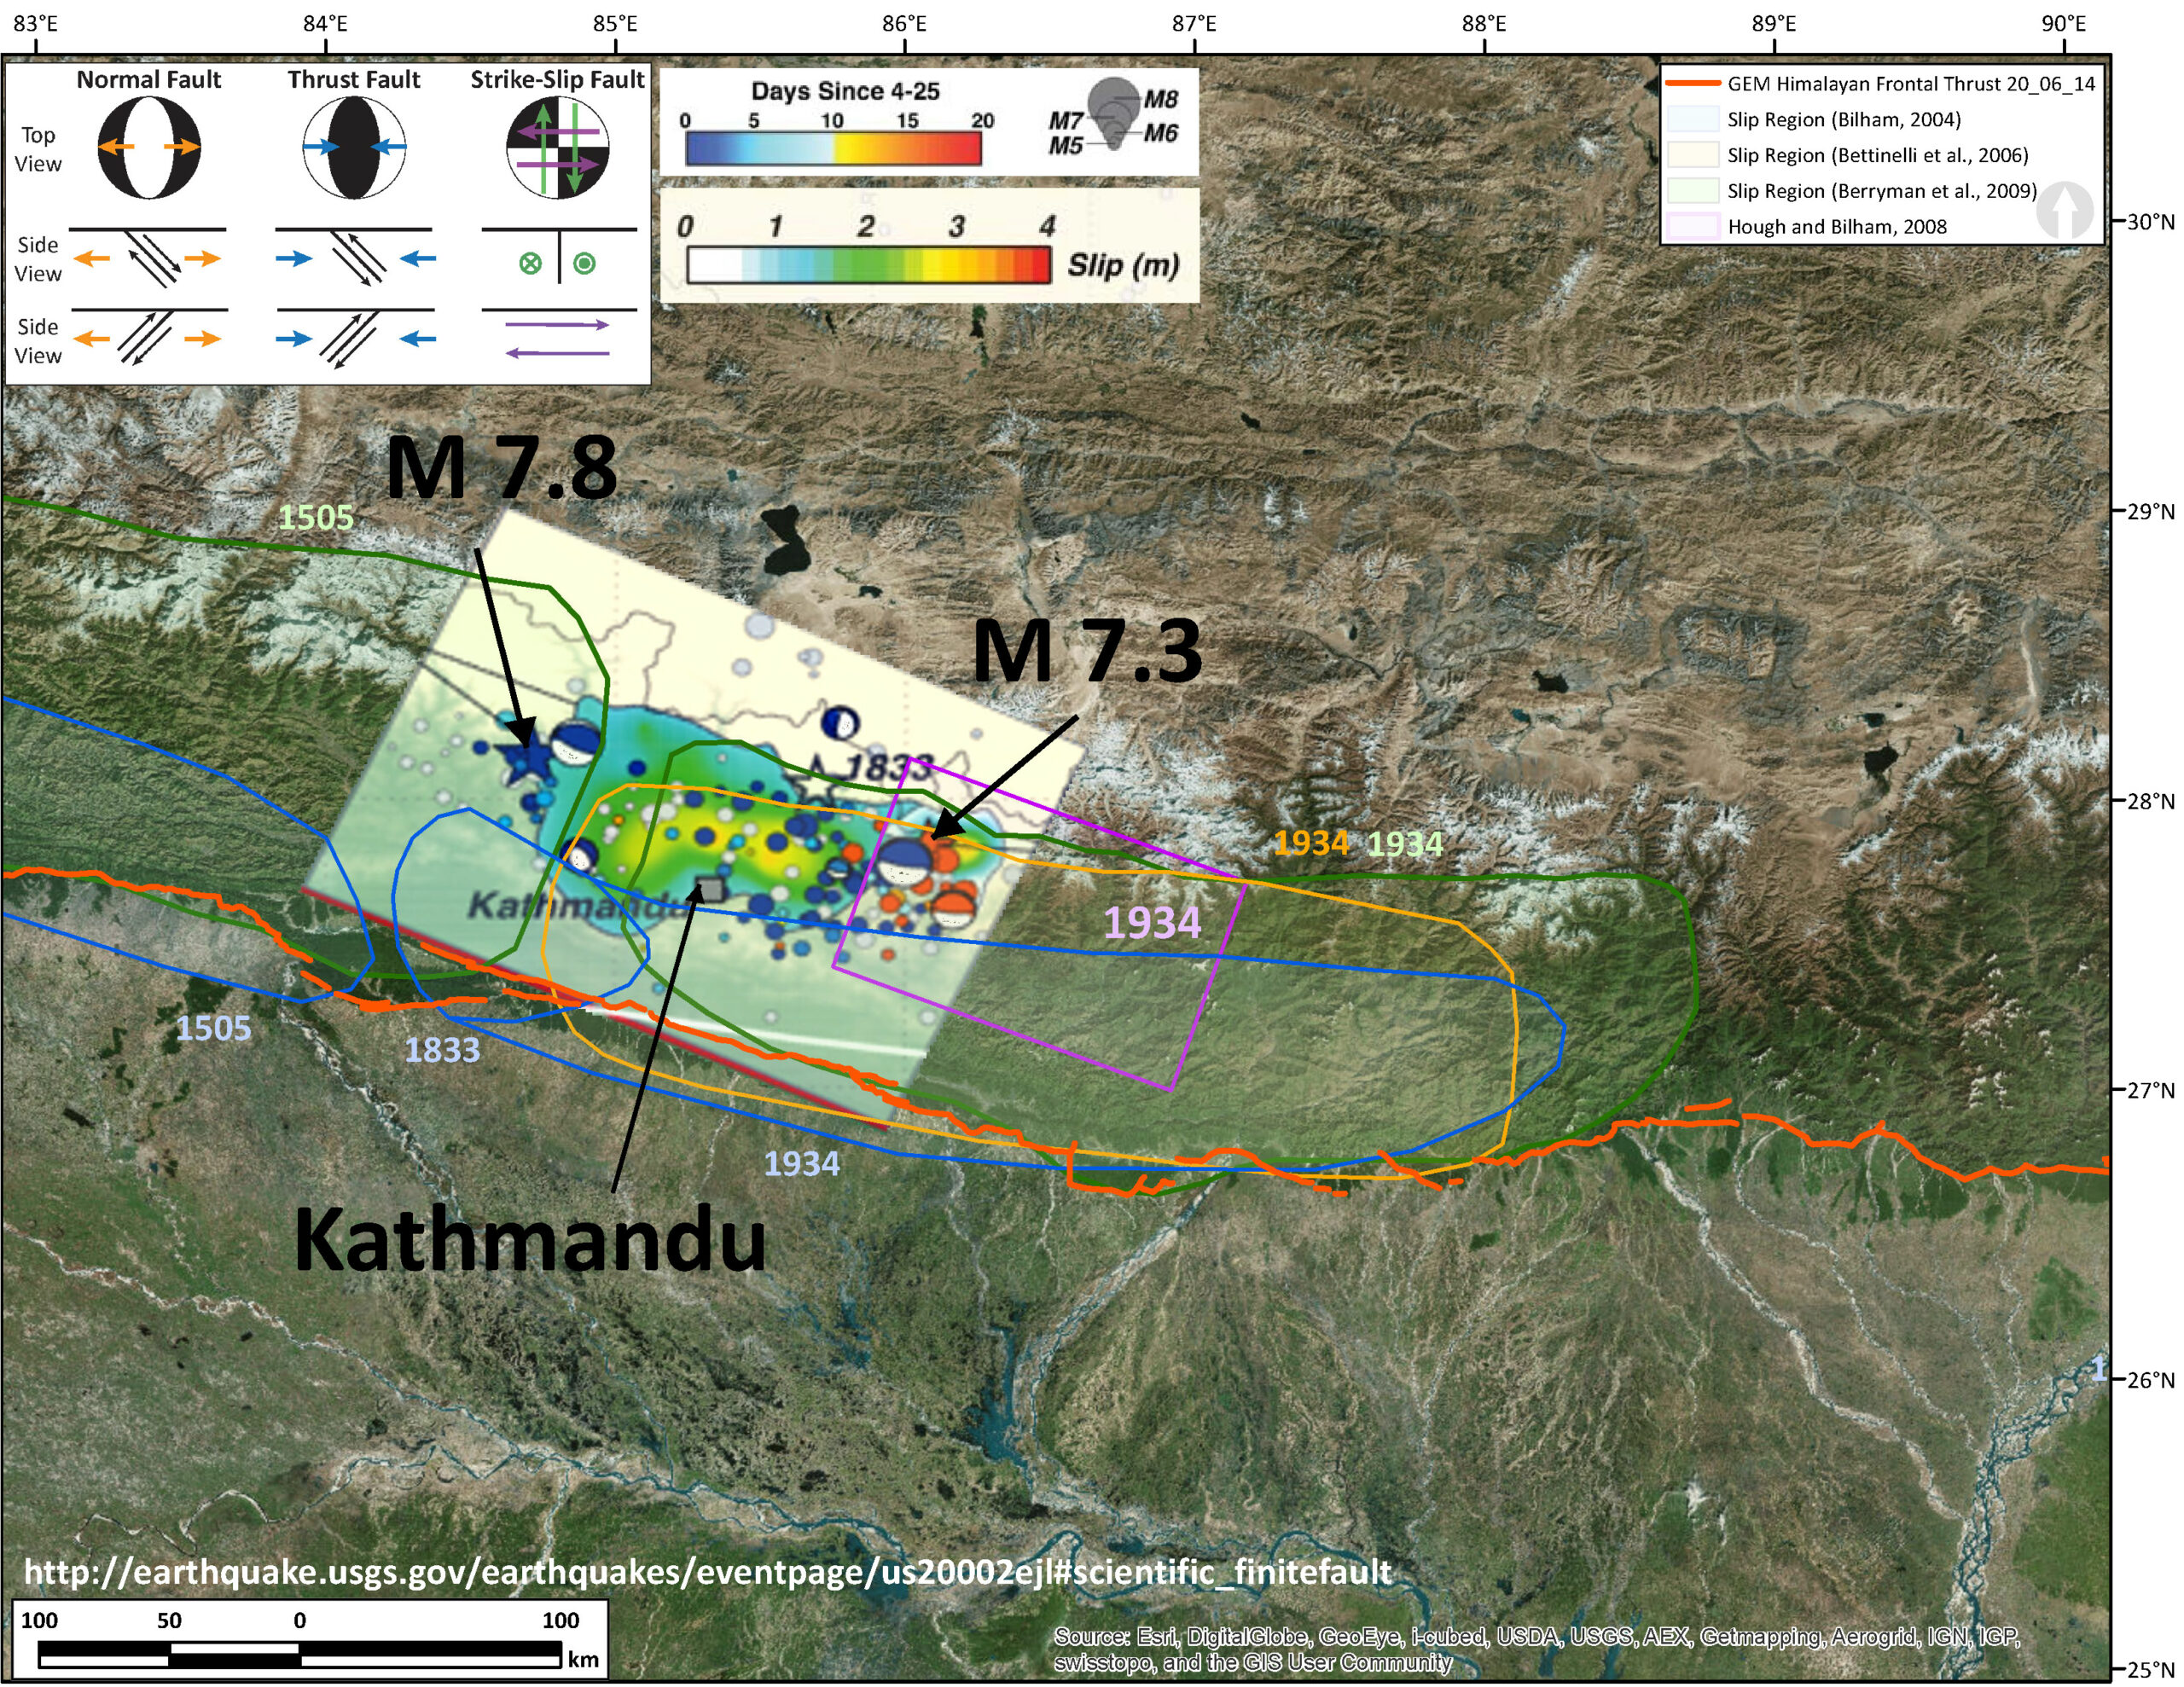
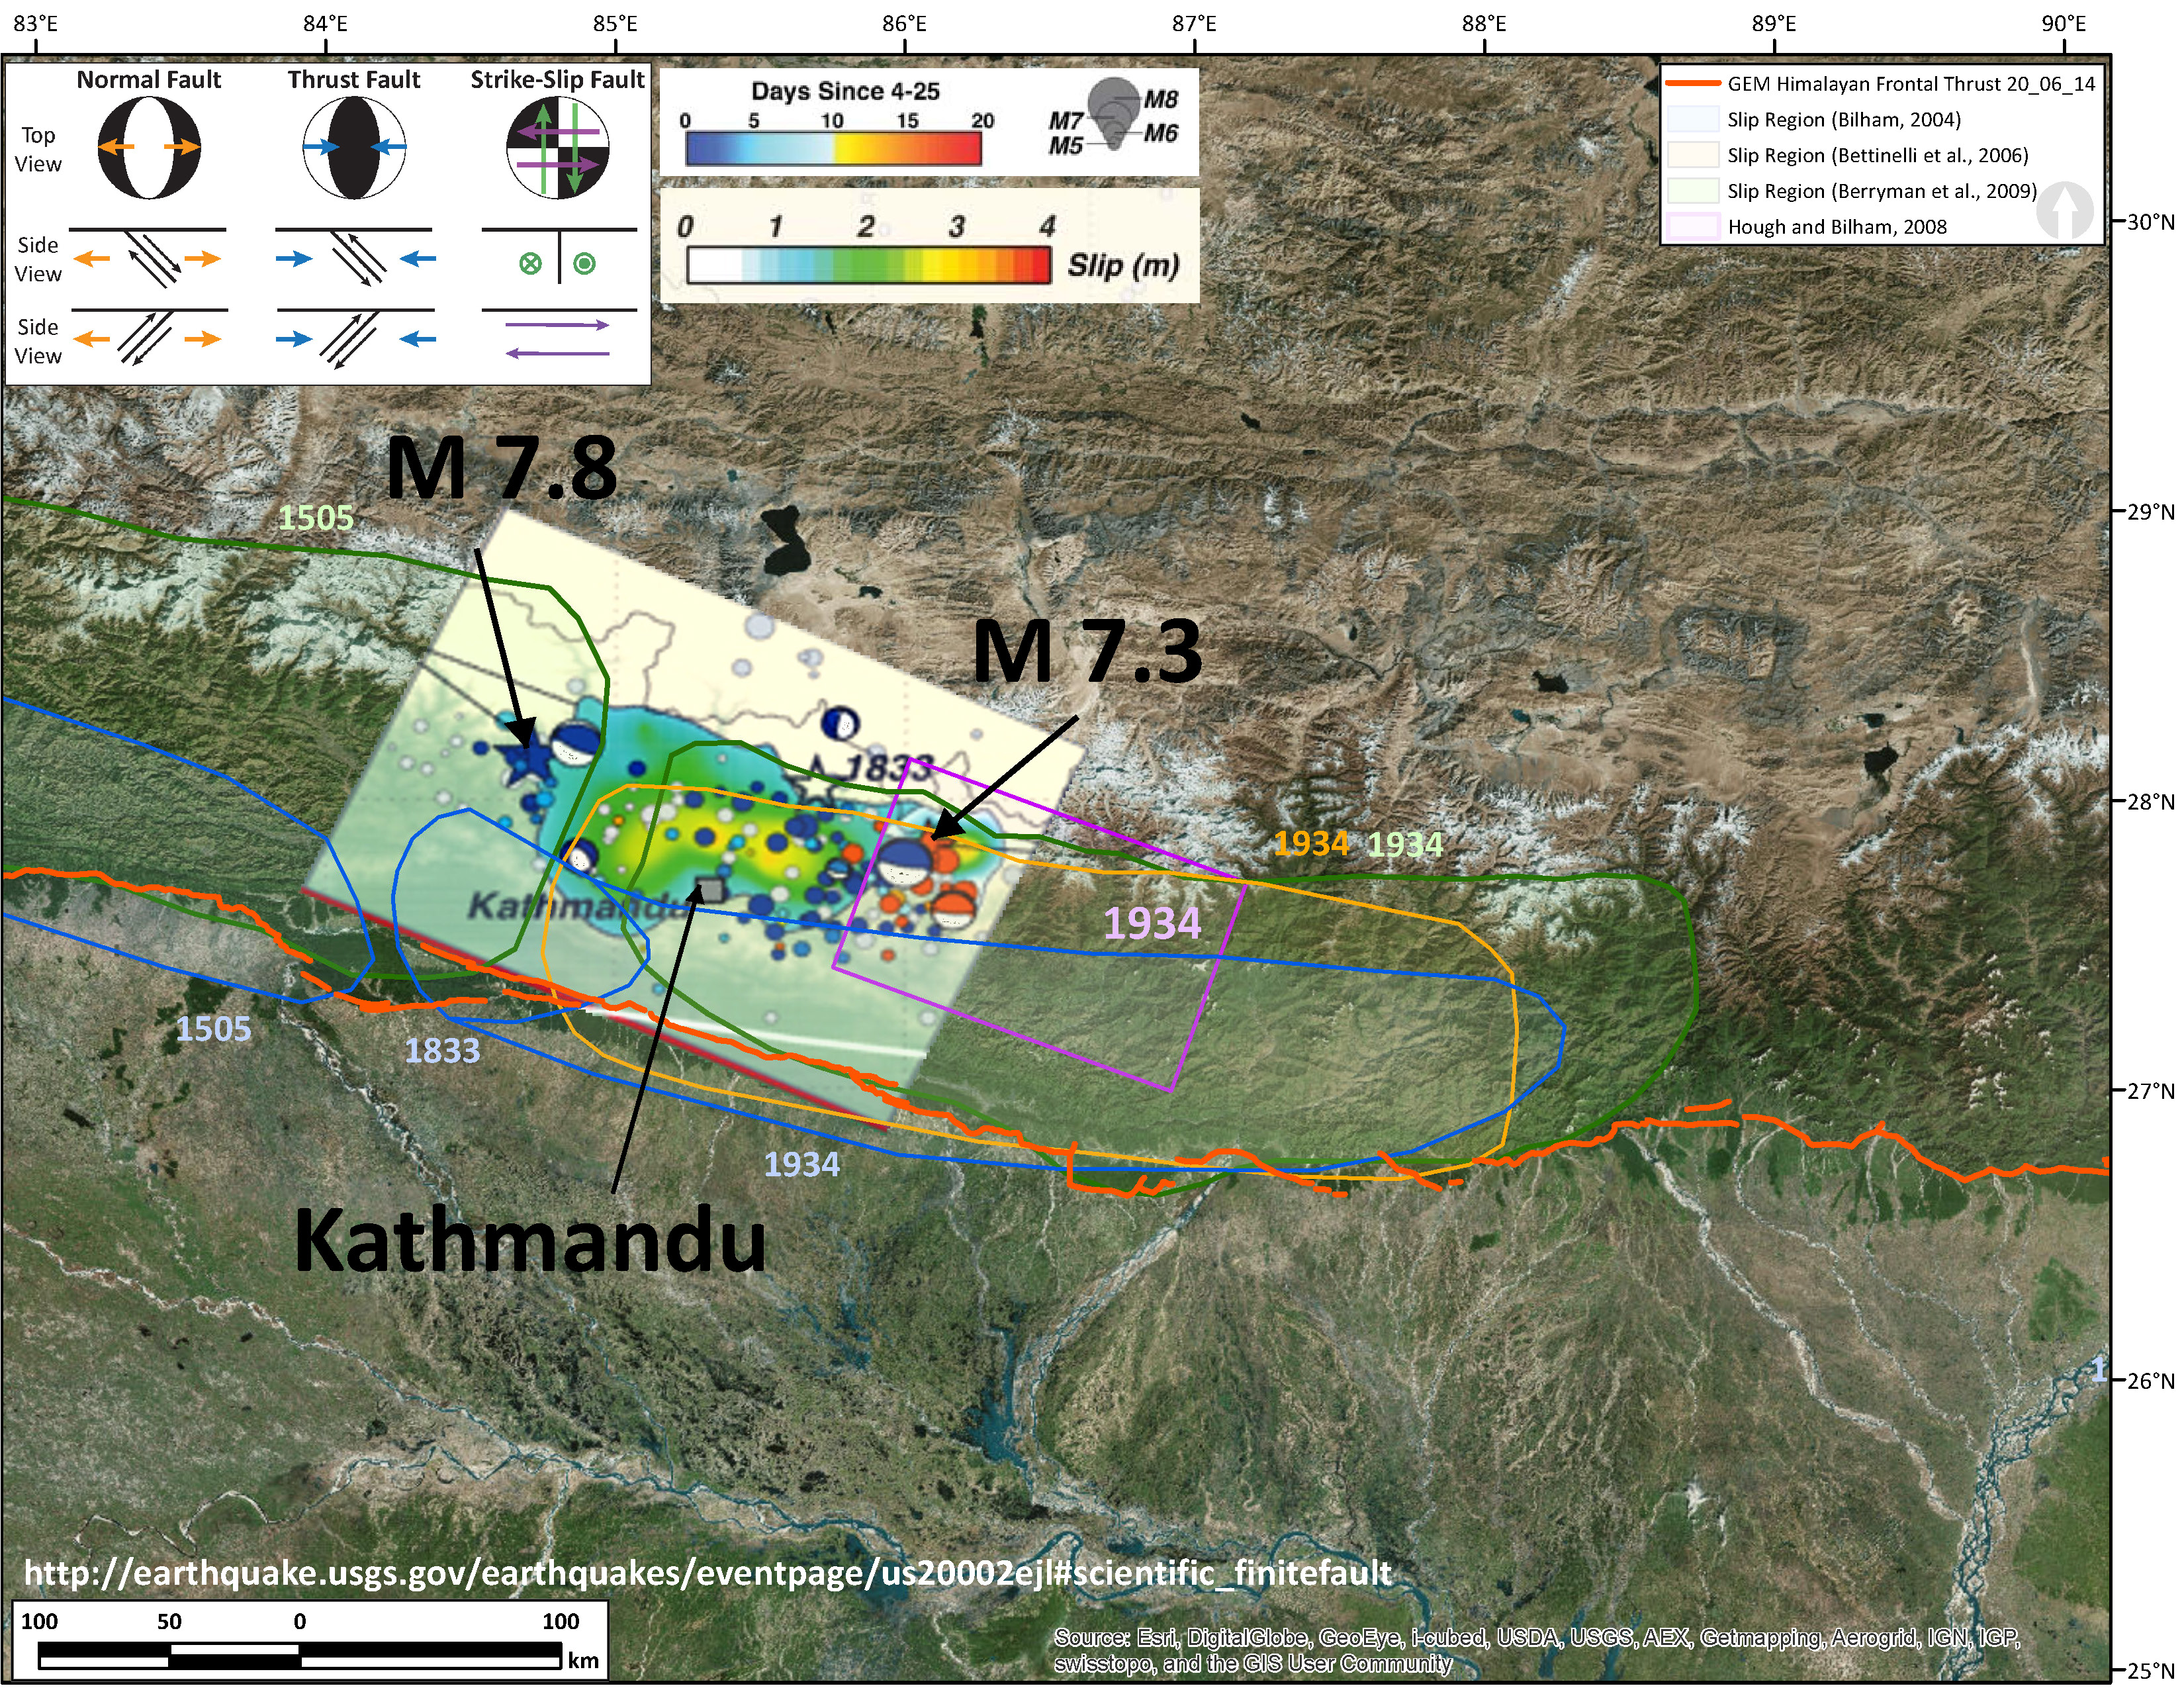
Mw 7.8 Earthquake Finite Fault Plane Solution from the USGS.
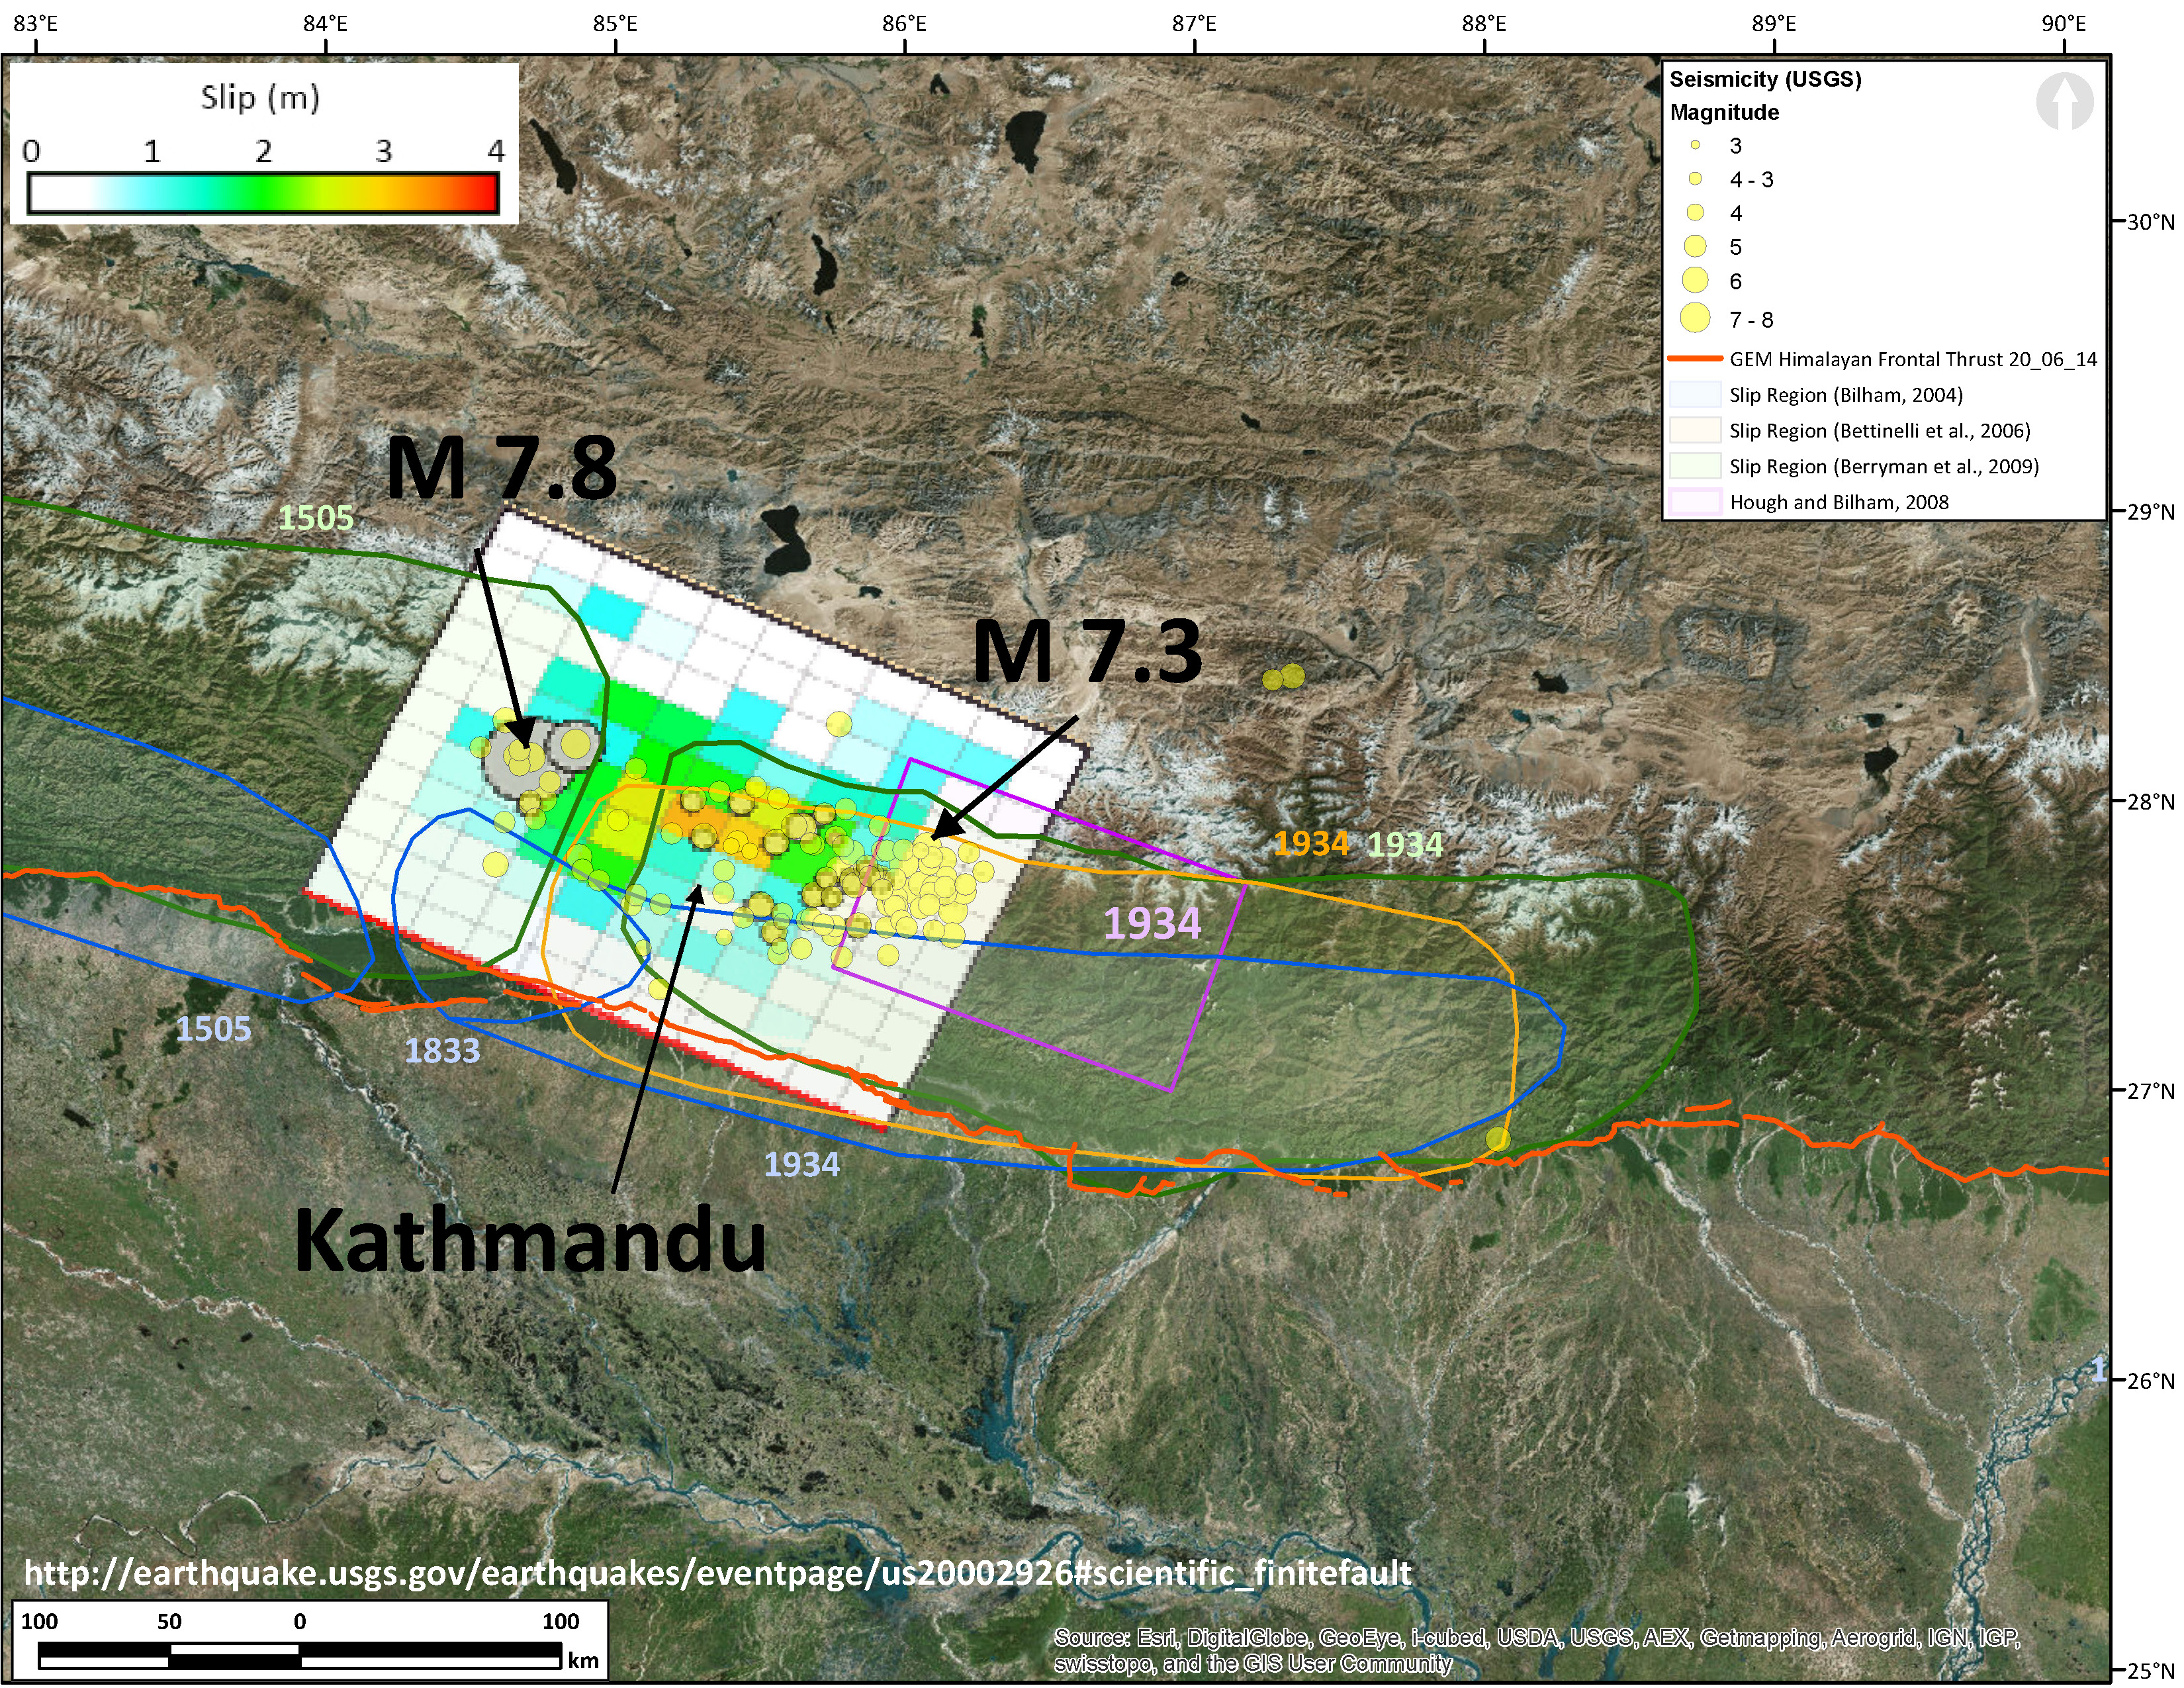
Mw 7.3 Earthquake Finite Fault Plane Solution.
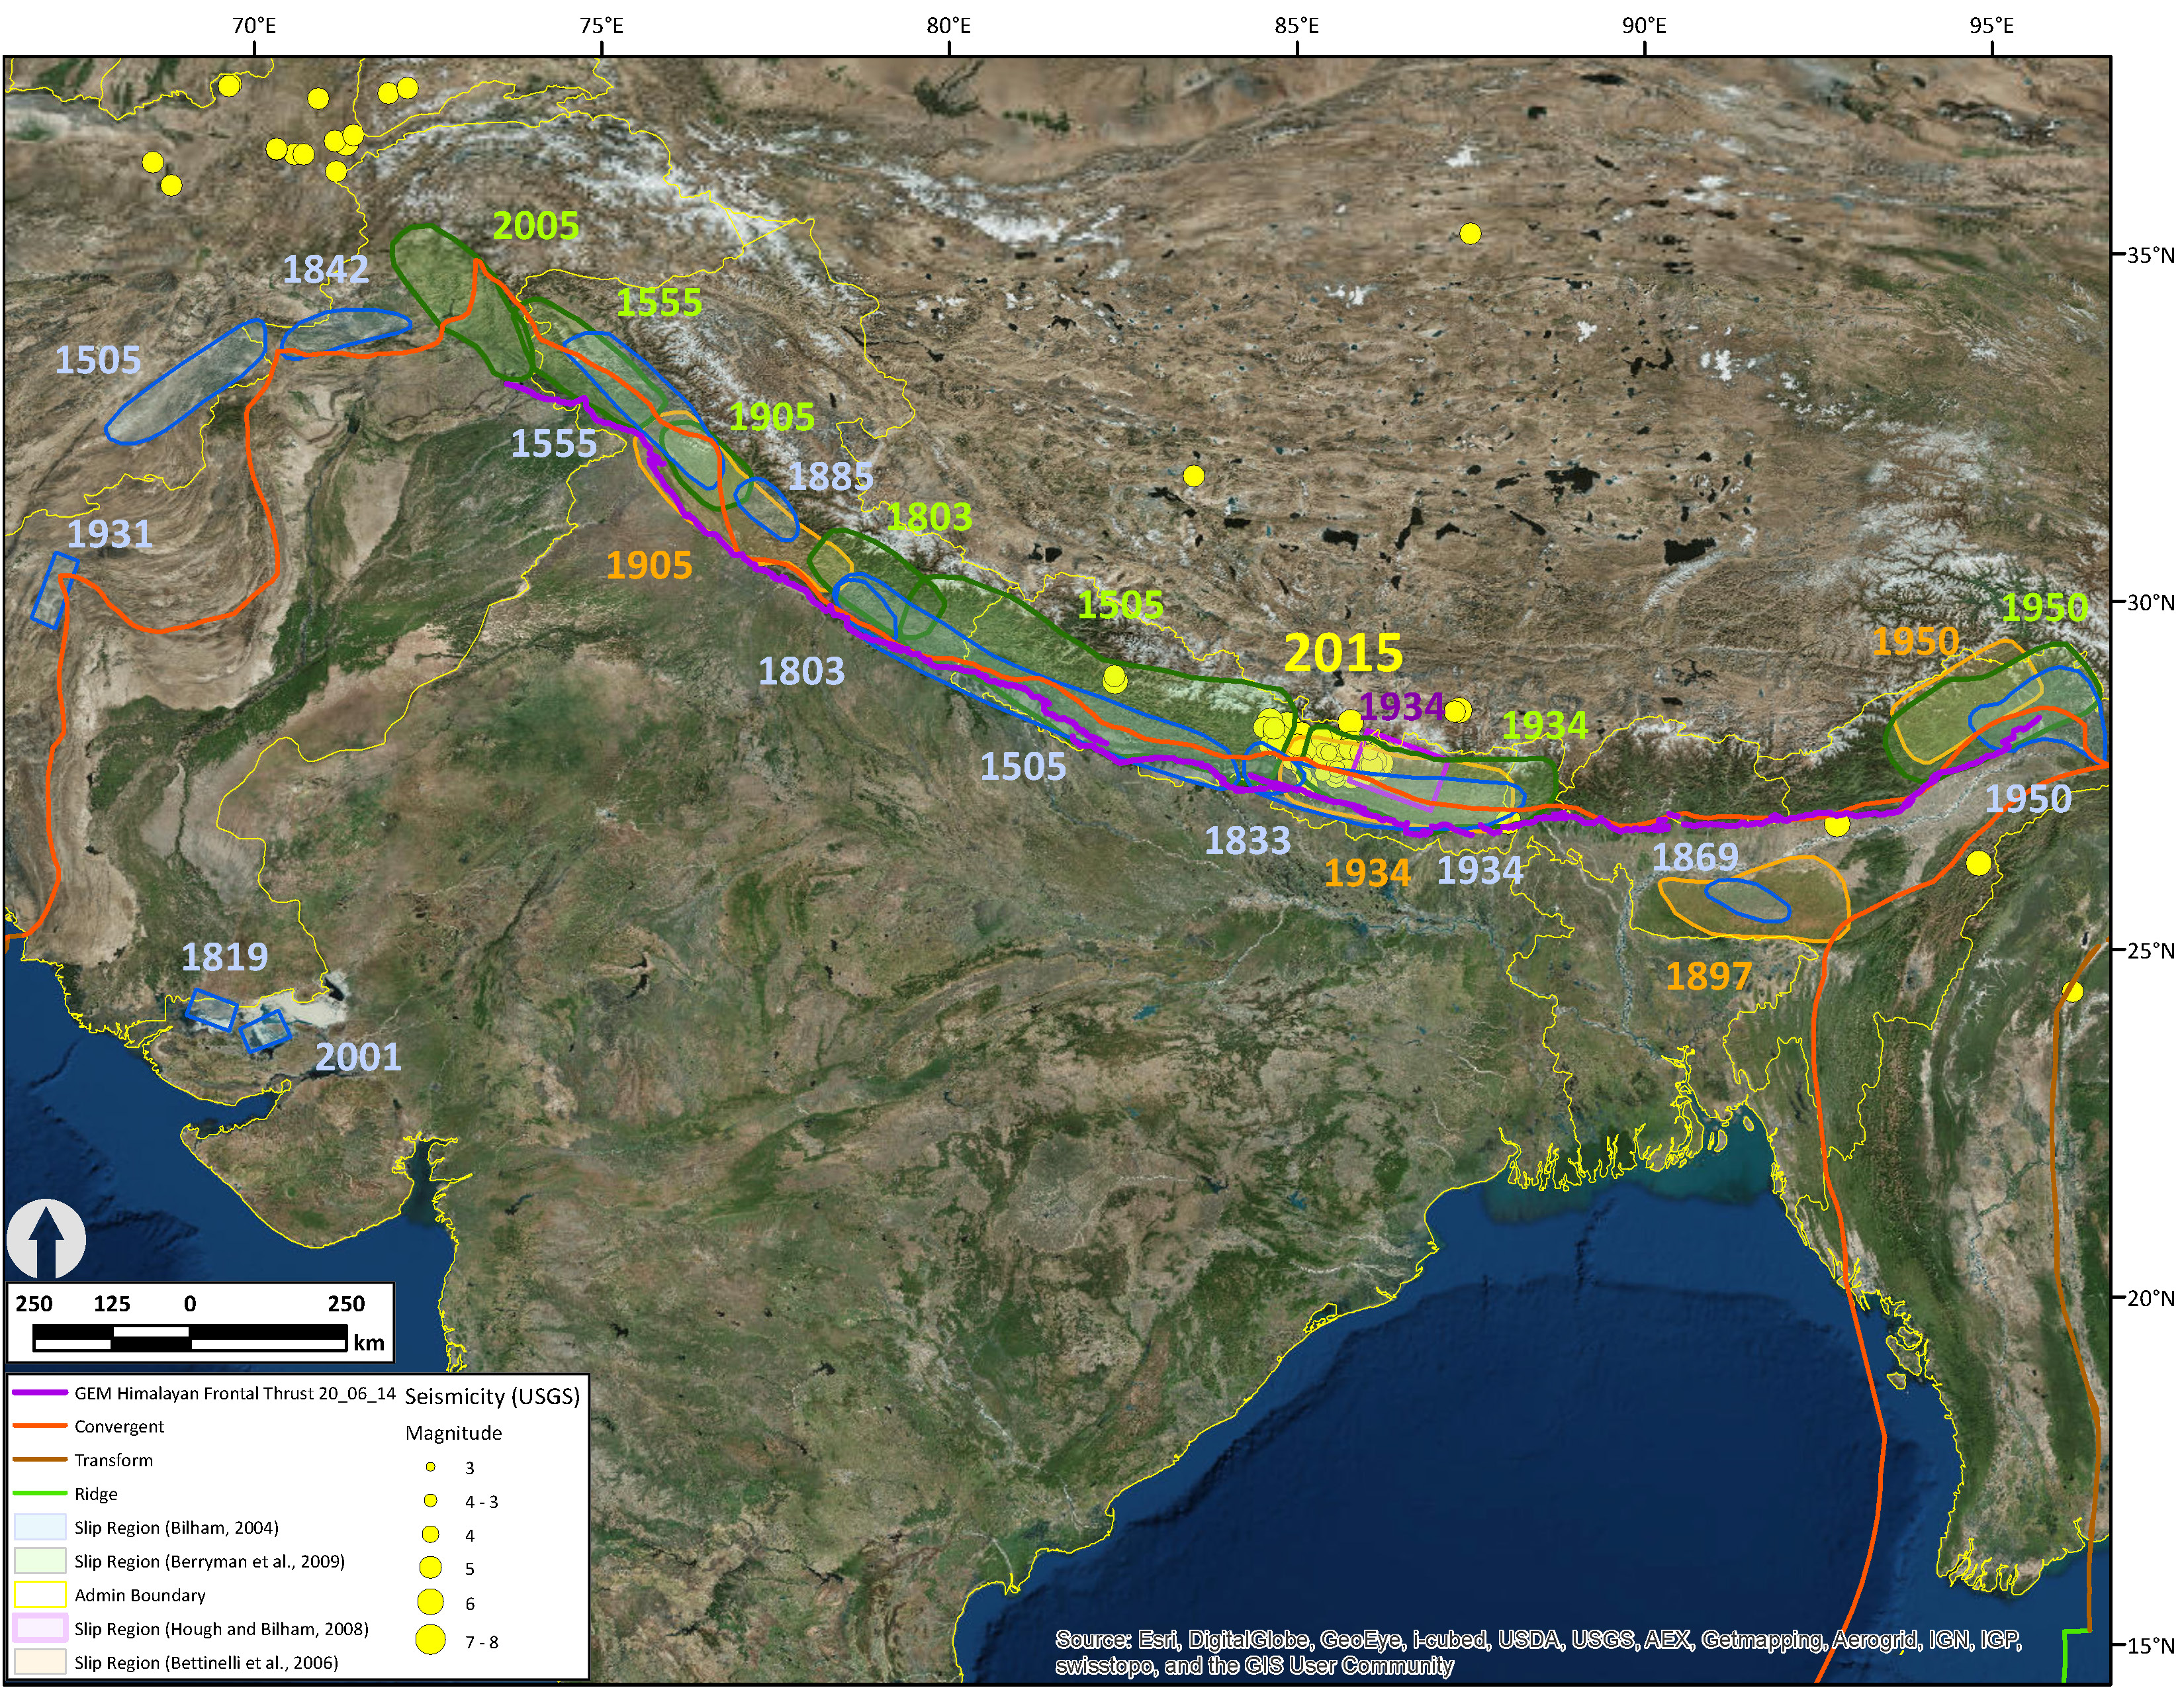
Here is the map that I put together. I have placed the USGS epicenters with two color schemes. The size of the yellow dots represents earthquake magnitude. The degree of redness designates the time (earlier-April = pink & later-May = red). Note how there are some pink colored epicenters in the region of the M 7.3 earthquake. These pink colored earthquakes all occurred in April. The red ones are from May. These epicenters may not be plotted with the greatest certainty, though any uncertainty is possibly shared between them. So, there relative positions are possibly good.
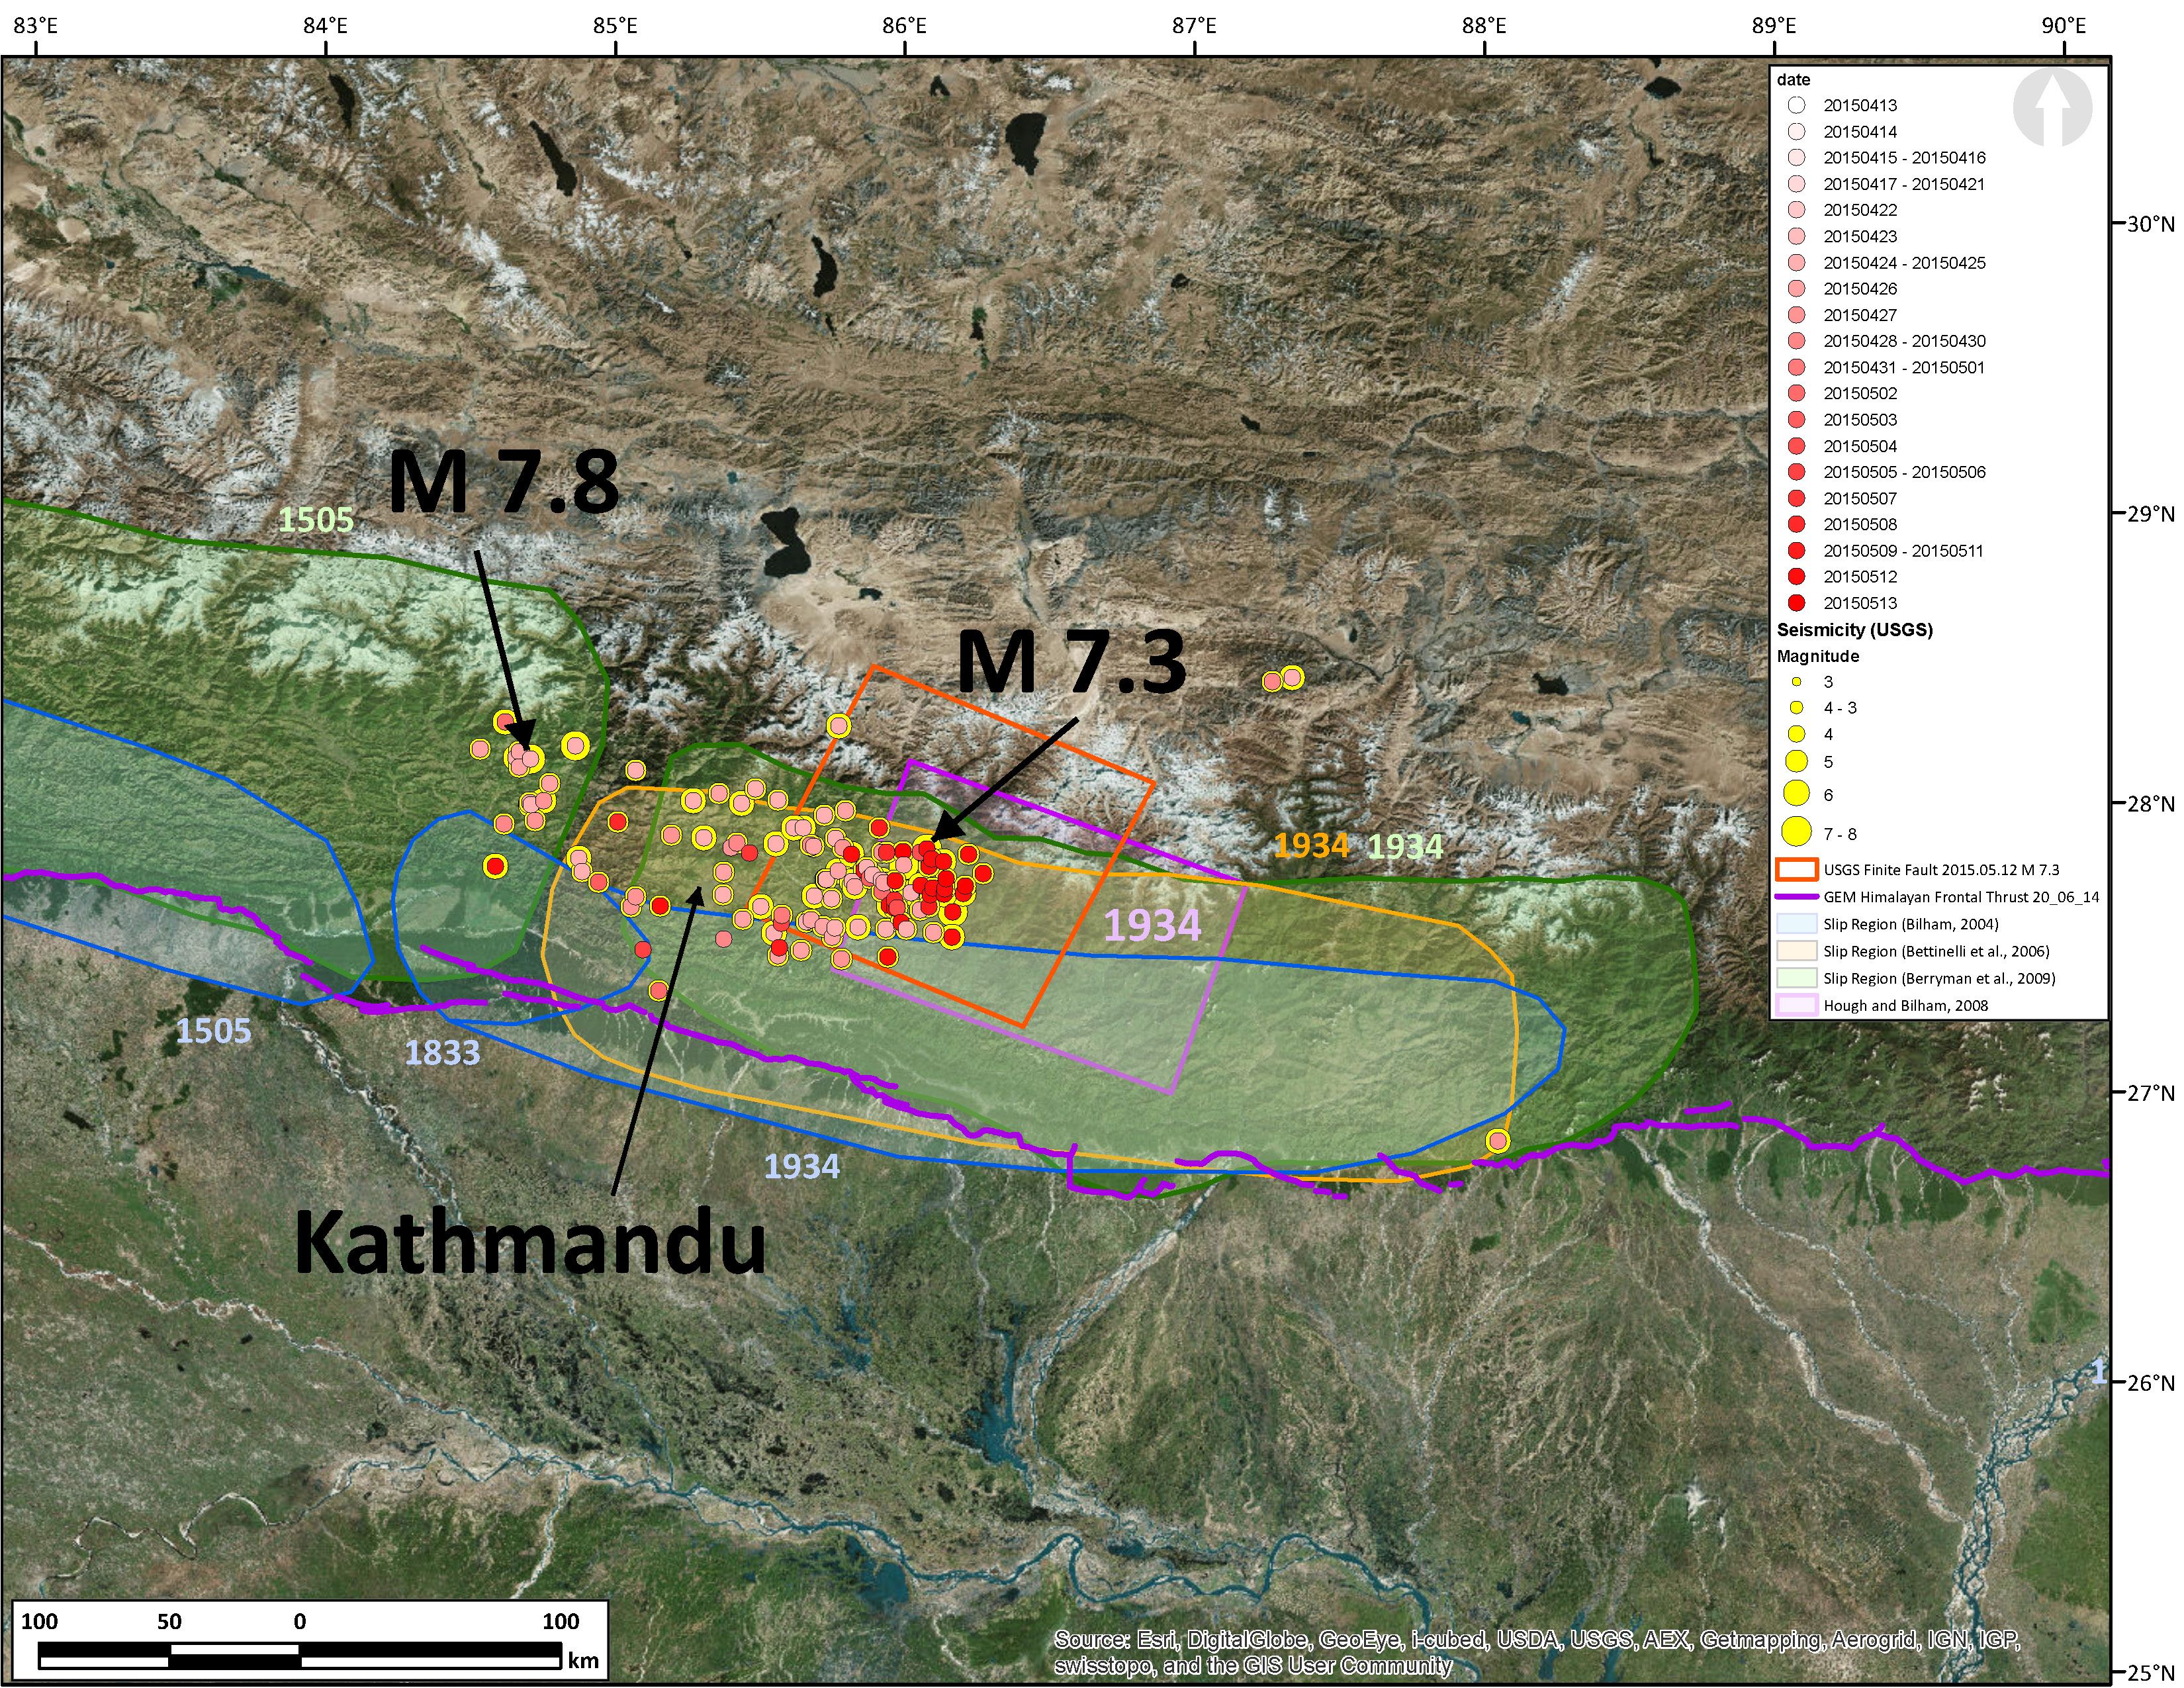
Here is an updated regional map that incorporates Hough and Bilham (2008 ) and today’s seismicity. The historic and prehistoric earthquake slip patches are also shown. The three other data sets now include Bilham (2004), Bettinelli et al (2006), and Berryman et al. (2009). I provide information about how I compiled these data sets on this page.
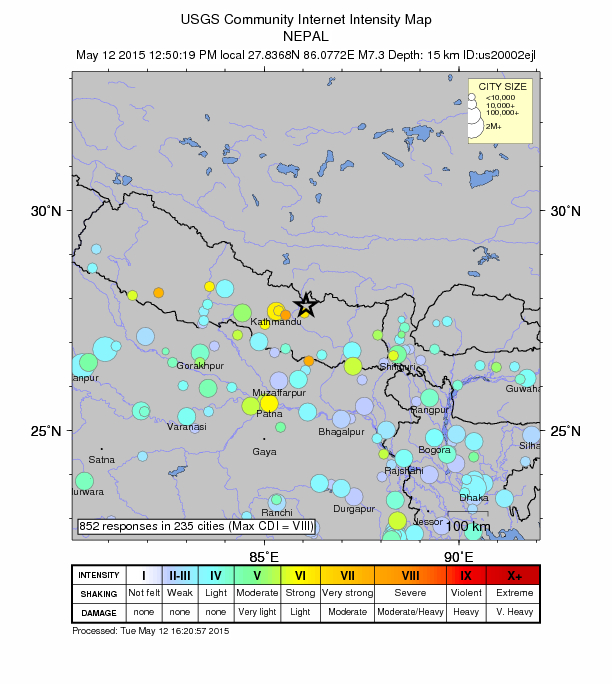
Here is the updated DYFI map. Note how broadly this earthquake was felt.
Here are two visualizations of the seismic waves as they propagate through the Earth. These are records from the USArray Transportable Array. Your tax dollars at work, unless congress defunds these projects. This first video shows vertical motion as red and blue.
This second video shows horizontal motion with magnitude and direction.
-
References:
- Bassin, C., Laske, G. and Masters, G., 2000. The Current Limits of Resolution for Surface Wave Tomography in North America, EOS Trans AGU, 81, F897, 2000.
- Bilham, R., Gaur, V.K., Molnar, P., 2001. Himalayan Seismic Hazard, Science, v. 293, p/ 1,442-1,444.
- Bilham, R., 2004. Earthquakes in India and the Himalaya: tectonics, geodesy and history, Annals of Geophysics, v. 42, no. 2/3, p. 839-858.
- Bettinelli, P., Avouac, J-P., Flouzat, M., Jouanne, F., Bollinger, L., Willis, P., and Chikitrar, G.R., 2006. Plate motion of India and interseismic strain in the Nepal Himalaya from GPS and DORIS measurements, Journal of Geodesy, v. 80, p. 567-589
- Berryman, K., Ries, W., Litchfield, N. (2009) The Himalayan Frontal Thrust: Attributes for seismic hazard Version 1.0, December 2014, GEM Faulted Earth Project, available from http://www.nexus.globalquakemodel.org/.
- Hough, S.E. and Bilham, R., 2008. Site response of the Ganges basin inferred from re-evaluated macroseismic observations from the 1897 Shillong, 1905 Kangra, and 1934 Nepal earthquakes, Journal of Earth System Sciences, v. 117, S2, November 2008, p. 773-782.
- Ji, C., Wald, D.J., and Helmberger, D.V., 2002. Source description of the 1999 Hector Mine, California earthquake; Part I: Wavelet domain inversion theory and resolution analysis, Bull. Seism. Soc. Am., Vol 92, No. 4. pp. 1192-1207, 2002.
- Ji, C., Helmberger, D. V., Wald, D. J., and Ma, K. F., 2003. Slip history and dynamic implications of the 1999 Chi-Chi, Taiwan, earthquake, J Geophys Res-Sol Ea, 108(B9).
- Lindsey, E., R. Natsuaki, X. Xu, M. Shimada, H. Hashimoto, and D. Sandwell, (2015), Gorkha Mw 7.8 Earthquake: Line of Sight Deformation from ALOS-2 Interferometry, Seismological Research Letters, in prep, http://topex.ucsd.edu/nepal
- Shao, G. F., Li, X. Y., Ji, C., and Maeda, T., 2011. Focal mechanism and slip history of the 2011 M-w 9.1 off the Pacific coast of Tohoku Earthquake, constrained with teleseismic body and surface waves, Earth Planets Space, 63(7), 559-564.