Here is an update to my preliminary report about the M 7.8 subduction zone earthquake in Ecuador. Here is my first report. More information about this earthquake is on that report page. Here is the USGS website for the M 7.8 earthquake.
-
The updates are as follows.
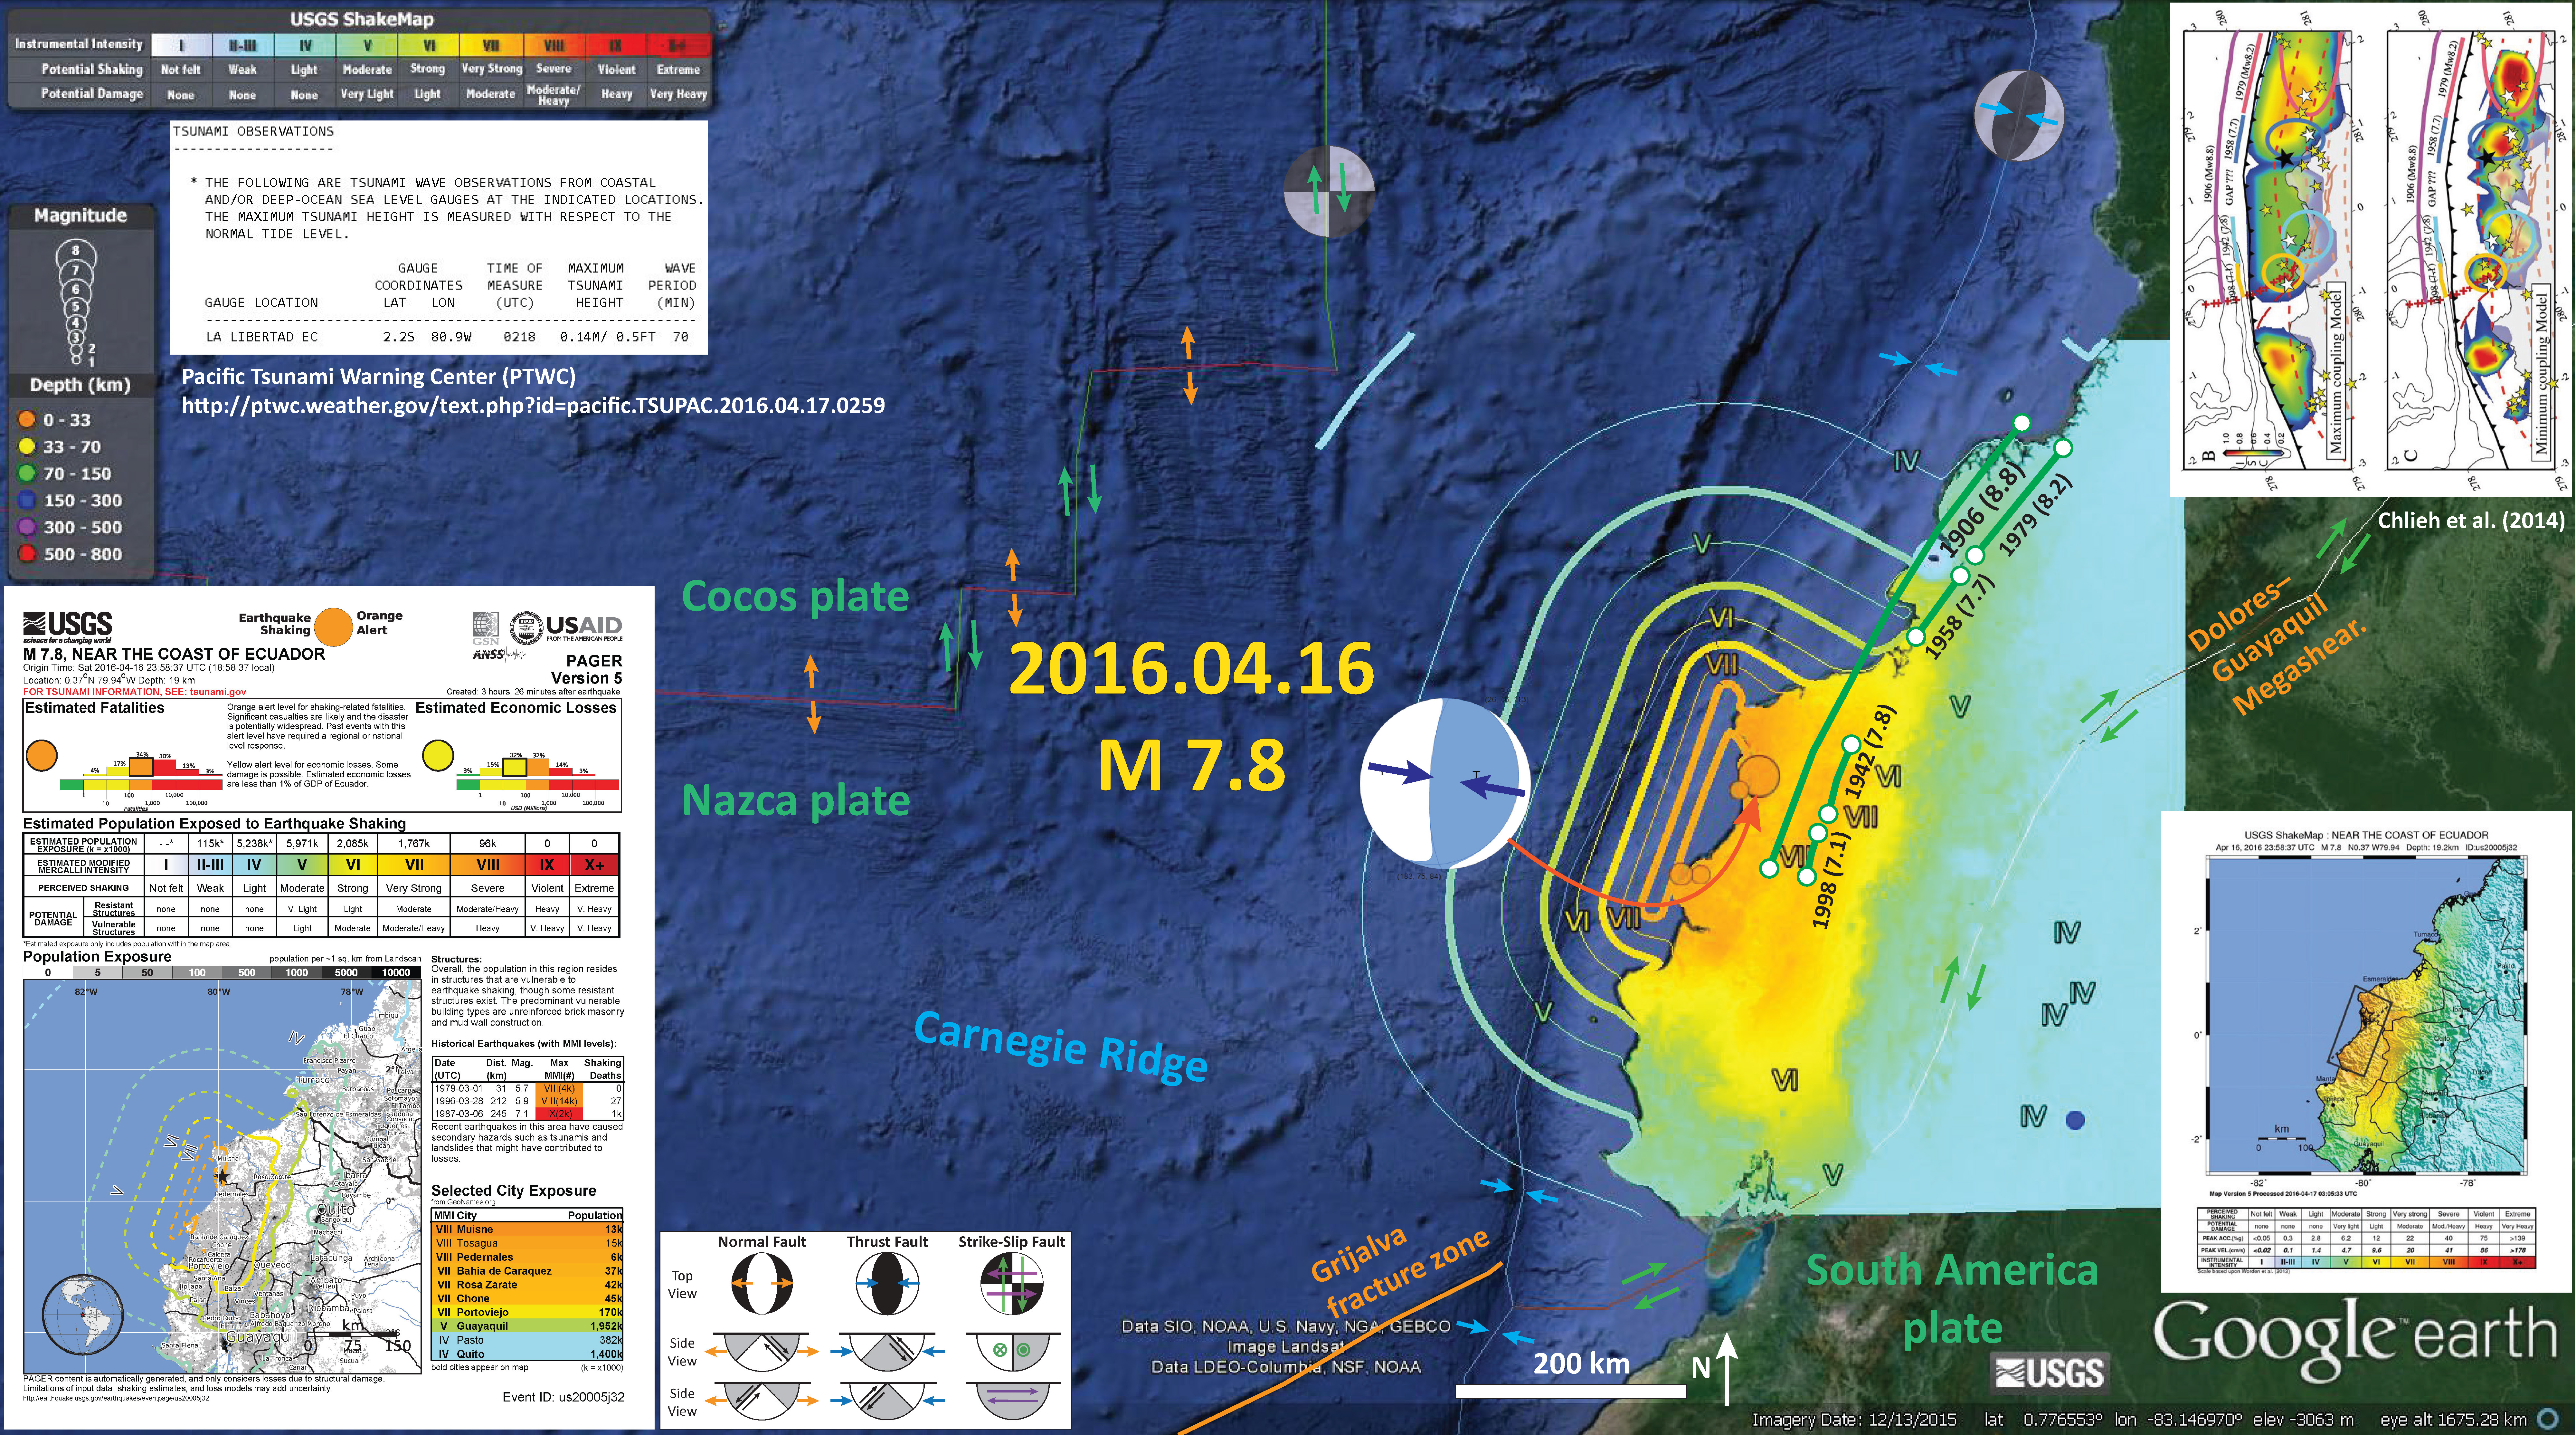
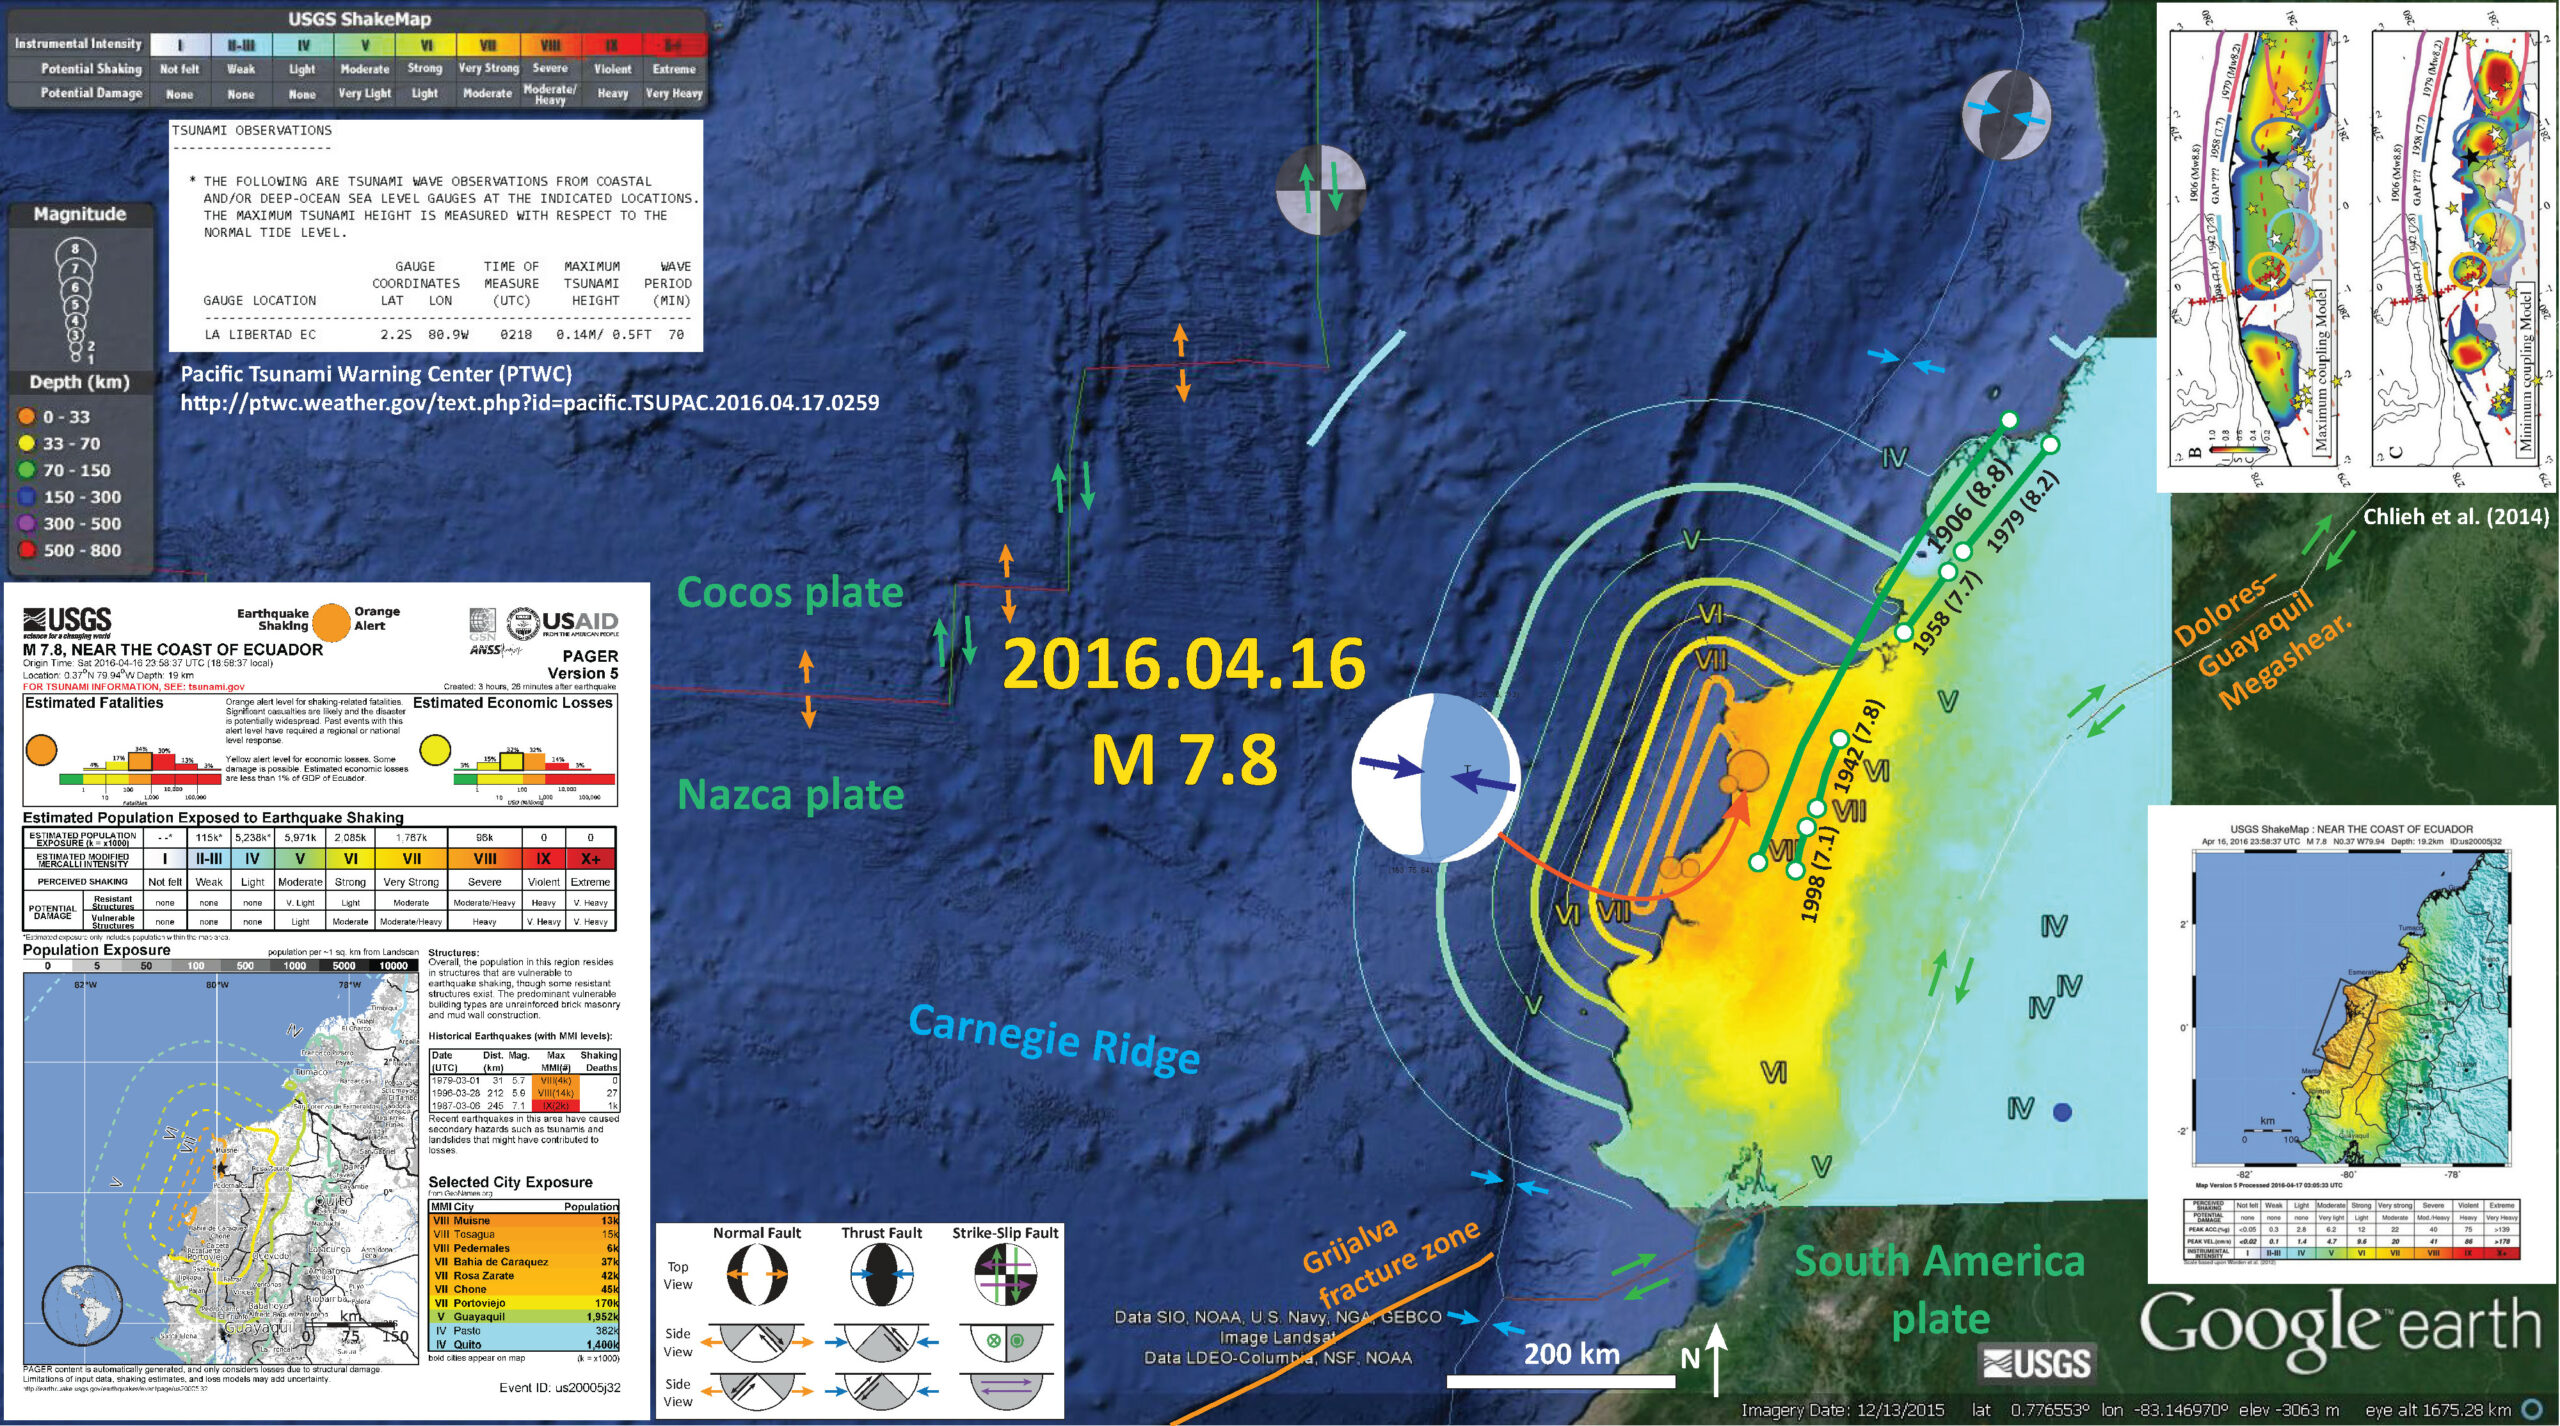
- The major update is the change in estimate for ground motions. I plot this map with the revised shakemap that uses Modified Mercalli Intensity (MMI) scale. The USGS calculated a fault plane and applied slip on that fault plane to get this new estimate of ground motions. These new estimates led to a new PAGER report, which produced revised estimates of probability of damage to people and their belongings.
- A second update here is the singular tsunami observation.
- A third update is that I have included a figure from Chlieh et al. (2014) on this poster. I took his rupture lengths and plotted them on the map as green lines with white balls at their termini. I have labeled these slip patches with their year and magnitude. These are also shown in the Chlieh inset figure.
- A fourth update is that I include the revised shakemap as an inset because this shows the outline of the USGS fault slip model.
- A fifth update is a map of historic focal mechanisms posted to twitter by Jascha Polet, a seismologist at Cal Poly Pomona.
- Finally, I prepared an animation that shows the seismicity of this region from 1900-2016 for earthquakes with a magnitude greater than or equal to M 6.0. Here is the kml file that I used to prepare this animation.

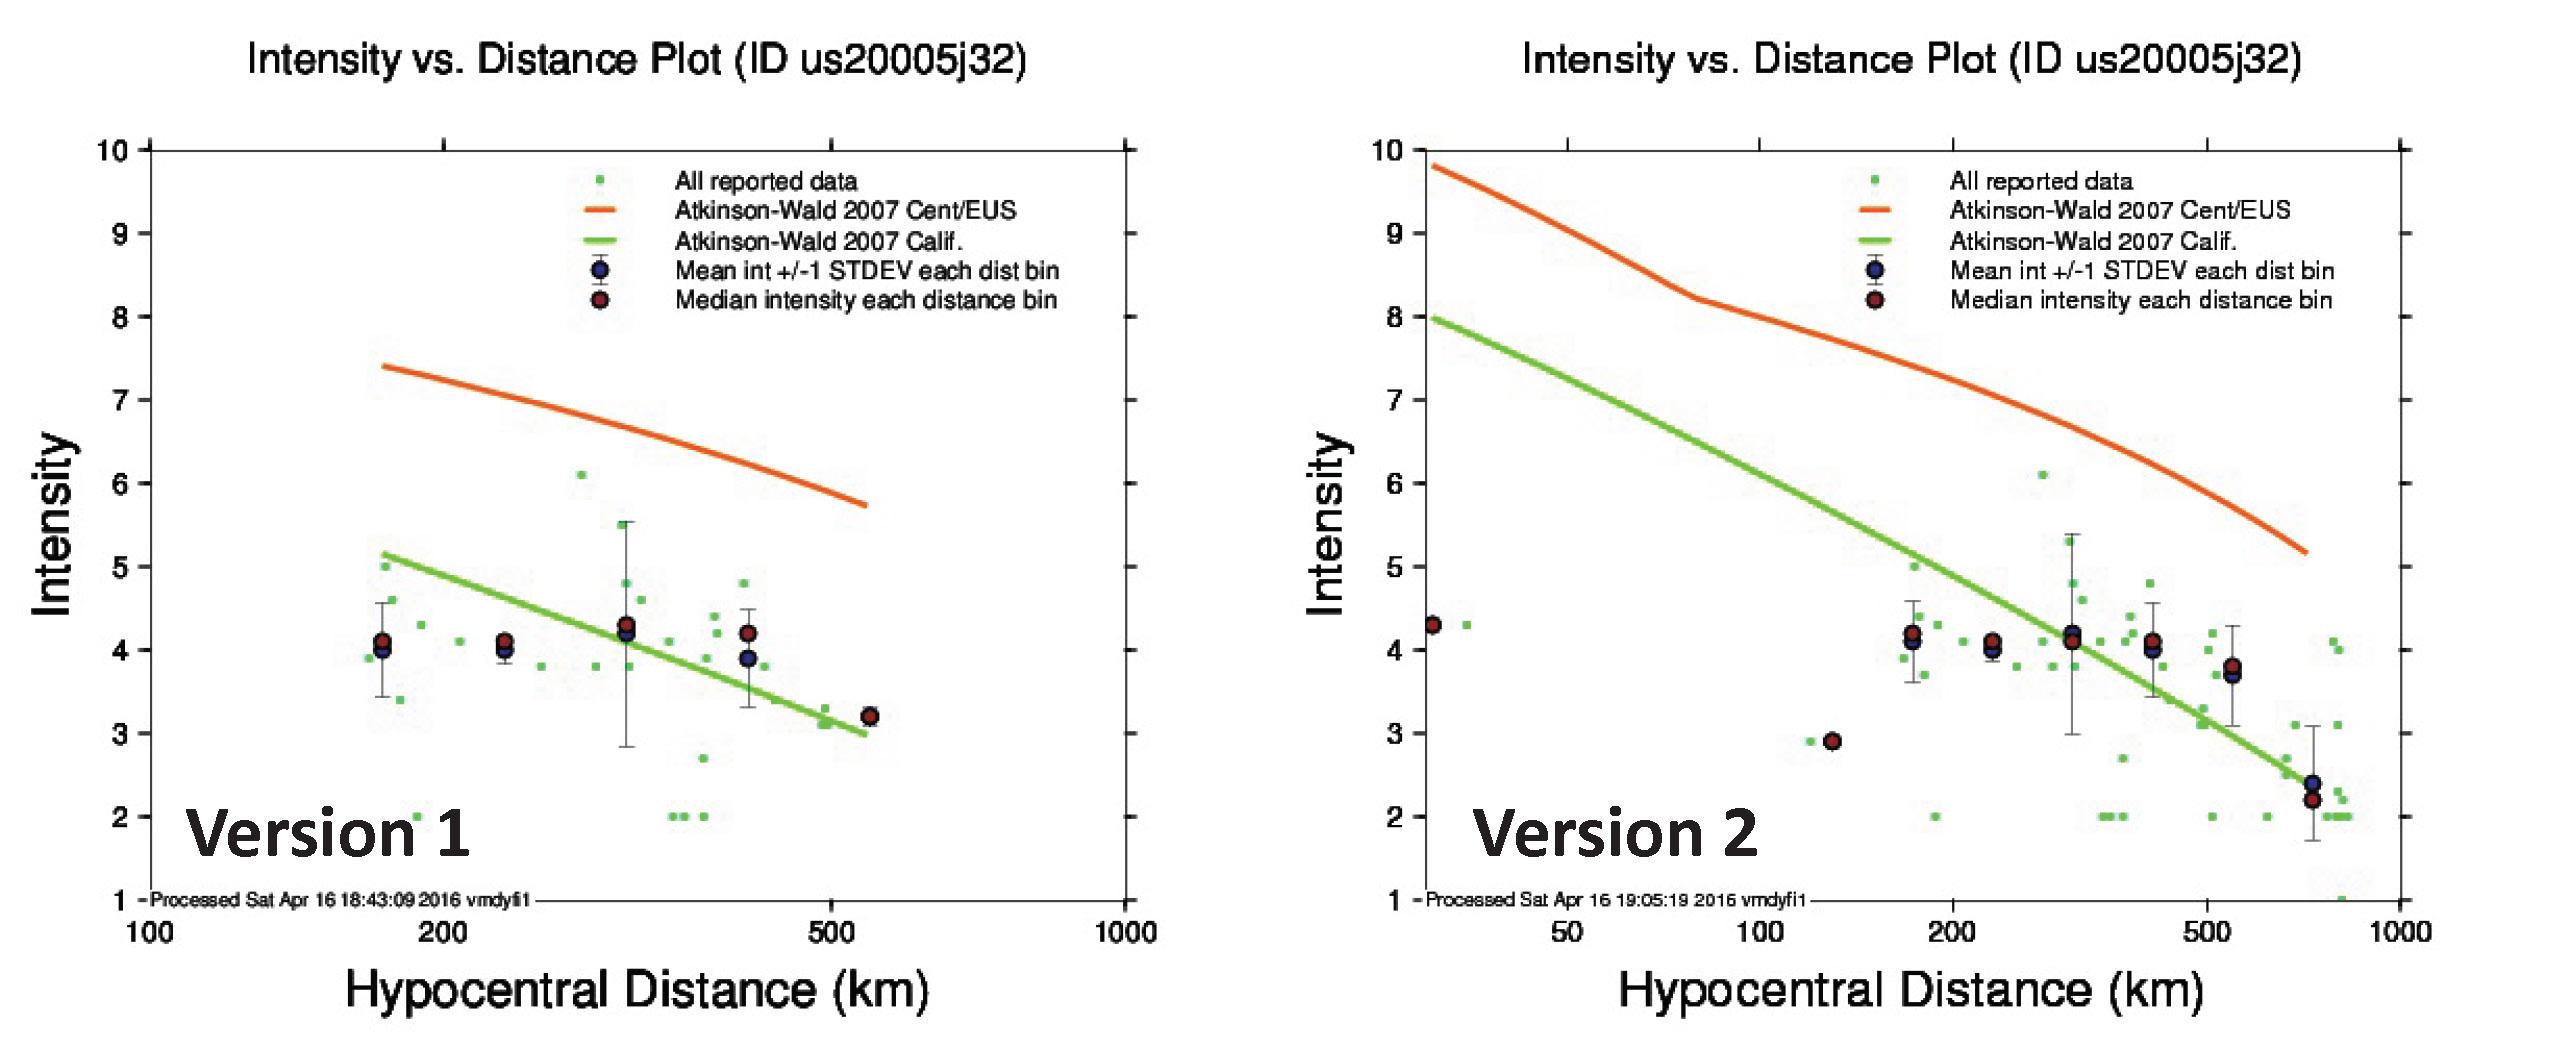
Here is a comparison of the attenuation relations. Version 1 is from reports that were made less than an hour after the earthquake. Version 2 (my numbers) incorporate additional reports.

-
For better viewing, I include the Chlieh et al. (2014) figure below. There are other figures on the first report page. Chlieh et al. (2014) use GPS data to infer the spatial variation and degree to which the subduction zone megathrust is seismogenically coupled. They consider plate motion rates and estimate the moment (earthquake energy) deficit along this fault (how much strain that plate convergence has imparted upon the fault over time). Then they compare this moment deficit to regions of the fault that have slipped historically.
- Moment deficit along strike and historic earthquake locations. Today’s earthquake may have occurred in the region marked “gap” in these figures.
(A) Along-strike variations of the annual moment deficit for all the interseismic models shown in Fig.5. (B)Maximum ISC model and (C)Minimum ISC model. (A)The blue, green and red lines correspond to the along-strike variation of the annual moment deficit rate respectively for models with smoothing coefficient λ1 =1.0, 0.25 and 0.1. (B) Smoother solution of Fig.5 ith a maximum moment deficit rate of 4.5 ×10¹⁸N m/yr. (C)Rougher solution of Fig.5 with a minimum moment deficit rate of 2.5 ×10¹⁸N m/yr. Yellow stars are the epicenters of subduction earthquakes with magnitude Mw>6.0 from the last 400 yr catalogue (Beauval et al., 2013). (For interpretation of the references to color in this figure legend, the reader is referred to the web version of this article.)
-
Tsunami Observations:
- Below are the current observations of tsunamis from this earthquake. This report is from the Pacific Tsunami Warning Center (PTWC). Note the small maximum tsunami height. This is good for those in Ecuador.
-
These were posted by Jascha Polet on Twitter.
- Here is a map that shows historic focal mechanisms with color representing depth.
- Here is a a cross section that shows historic focal mechanisms with color representing depth.
-
Here is the animation. First I provide a screen shot and then a link and the embedded video.
- Here is a link to the video file embedded below (4 MB mp4)
-
References
- Chlieh, M. Mothes, P.A>, Nocquet, J-M., Jarrin, P., Charvis, P., Cisneros, D., Font, Y., Color, J-Y., Villegas-Lanza, J-C., Rolandone, F., Vallée, M., Regnier, M., Sogovia, M., Martin, X., and Yepes, H., 2014. Distribution of discrete seismic asperities and aseismic slip along the Ecuadorian megathrust in Earth and Planetary Science Letters, v. 400, p. 292–301
- Gutscher, M-A., Malavieille, J., Lallemand, S., and Collor, J-Y., 1999. Tectonic segmentation of the North Andean margin: impact of the Carnegie Ridge collision in Earth and Planetary Science Letters, v.168, p. 255–270
- Hayes, G. P., D. J. Wald, and R. L. Johnson, 2012. Slab1.0: A three-dimensional model of global subduction zone geometries, J. Geophys. Res., 117, B01302, doi:10.1029/2011JB008524.
- Rhea, Susan, Hayes, Gavin, Villaseñor, Antonio, Furlong, K.P., Tarr, A.C., and Benz, H.M., 2010. Seismicity of the earth 1900–2007, Nazca Plate and South America: U.S. Geological Survey Open-File Report 2010–1083-E, 1 sheet, scale 1:12,000,000.

seems to be a lot of small tremors in CA. do you anticipate s-thing larger given the position of the Ecuadorian quake?
The earthquakes in Ecuador are just too far away to have a general affect on earthquakes in CA.
I just wondered whether or not there is a causal relationship between the quakes in Japan and Equador?
no, there is not. they are just too far from each other… :-)
Thanks. I thought so too but wasn’t sure whether the shifts in plates could extend that far or not.
generally 10s to 100s km max, depending upon the earthquake.
however, as the seismic waves travel through Earth, they might trigger earthquakes. this is called dynamic triggering. but this only happens immediately after the earthquake. once the seismic waves pass, there is no impact. also, for dynamic triggering to work, those faults need to be just about ready to rupture.