There have been many aftershocks in the region of the 4/1/14 M 8.2 subduction zone earthquake offshore Iquique, Chile. There was a swarm of earthquakes up to M 6.7 in the weeks prior to the current main shock, here is my page about those foreshocks. Then there have been many aftershocks. These aftershocks will be used, in part, to model and define the fault zone that the mainshock probably directly influenced (the slip patch). Earlier there was a M 6.2 aftershock near the coast. This M 6.2 earthquake, while much smaller in magnitude than the mainshock, was much closer in distance to the people who felt it. Tonight there was a magnitude M 7.6 aftershock near the coastline. While I was writing this, there was another M 6.2 aftershock. Here is the USGS page for that earthquake.
This earthquake swarm began a few weeks ago with a swarm that had earthquakes as large as magnitude M 6.7. These epicenters were in the region of a M 8.8 subduction zone earthquake in northern Chile that ruptured last in 1877, just south of the rupture zone from the 1868 M 8.8 earthquake. Since those two earthquakes, this region has not had a large magnitude earthquake. Given plate convergence there, people have used GPS to measure how much they think this part of the subduction zone is “ready to go” (aka moment deficit). I include some plots of this on the main page for the M 8.2 earthquake and more figures about “moment deficits” here. We might have expected a larger magnitude earthquake, but there are reasons to expect earthquakes of any range in magnitude (we have such a short record of earthquake history, it is nearly impossible to know very well about what we really would expect). In 2001 there was an earthquake pair (M 8.4 and 7.6) in Peru that were both within the possible slip patch for the 1868 earthquake. The pre-instrumental slip patches are not well constrained.
- Here is my main page for the M 8.2 earthquake.
- Here is my main page for the tsunami from the M 8.2 earthquake.
- I placed some tsunami records on this page.
Here is a map with tonight’s M 7.6 aftershock. The YELLOW EPICENTER in the southeast part of the swarm is tonight’s aftershock.
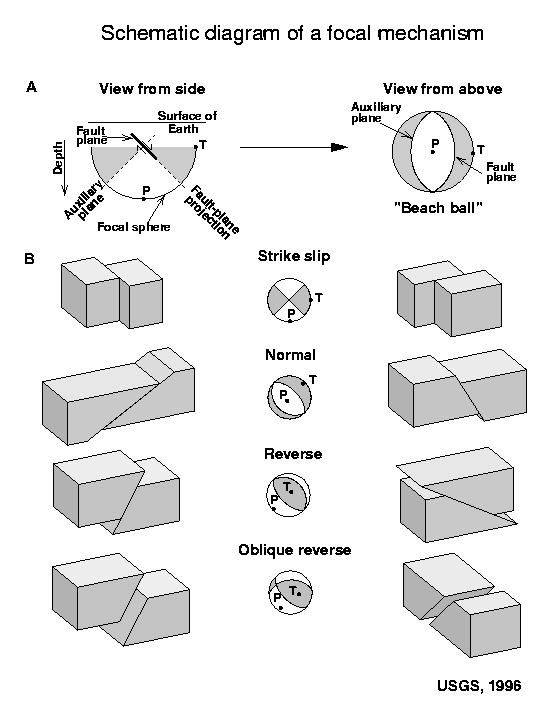
This is the moment tensor from the USGS. What type of earthquake do you think this is? Scroll down for a refresher image to help you.
This map shows the shaking intensity using the Modified Mercalli Intensity Scale.
Compare that above map with this one, for the M 8.2 earthquake.
This is the record on the HSU Department of Geology (thanks to their facebook page) seismometer. The M 8.2 is the big record in the middle and the M 7.6 aftershock is the smaller earthquake on the right. Time goes from left to right.

Here is a plot that shows how the shaking intensity attenuates (goes down, tapers off) with distance. The further from the earthquake epicenter, the less ground shaking.

This is the attenuation distance relation plot for the M 8.2 earthquake (just like the one above for the M 7.6^^^)

These are measurements of the tsunami generated by this aftershock.
This is the USGS PAGER report that is the estimate of loss, for people and their belongings/infrastructure. From the USGS, “PAGER (Prompt Assessment of Global Earthquakes for Response) is an automated system that produces content concerning the impact of significant earthquakes around the world, informing emergency responders, government and aid agencies, and the media of the scope of the potential disaster.” Here is more information about PAGER.

One may compare this loss estimate with the PAGER page from the M 8.2. The M 8.2 had a slightly higher probability for fatality and economic loss. The M8.2 is an ORANGE ALERT and the M 7.6 was a YELLOW ALERT. Both earthquakes, based on seismic data and modeling, have a large region inside the MM VI contour. The M 8.2 has a larger MM VI region, but the aftershock was closer to land.

Here is a primer for the different types of earthquake faults and moment tensor/focal mechanisms: 
Awesome! Can I share this?
please do
Not good