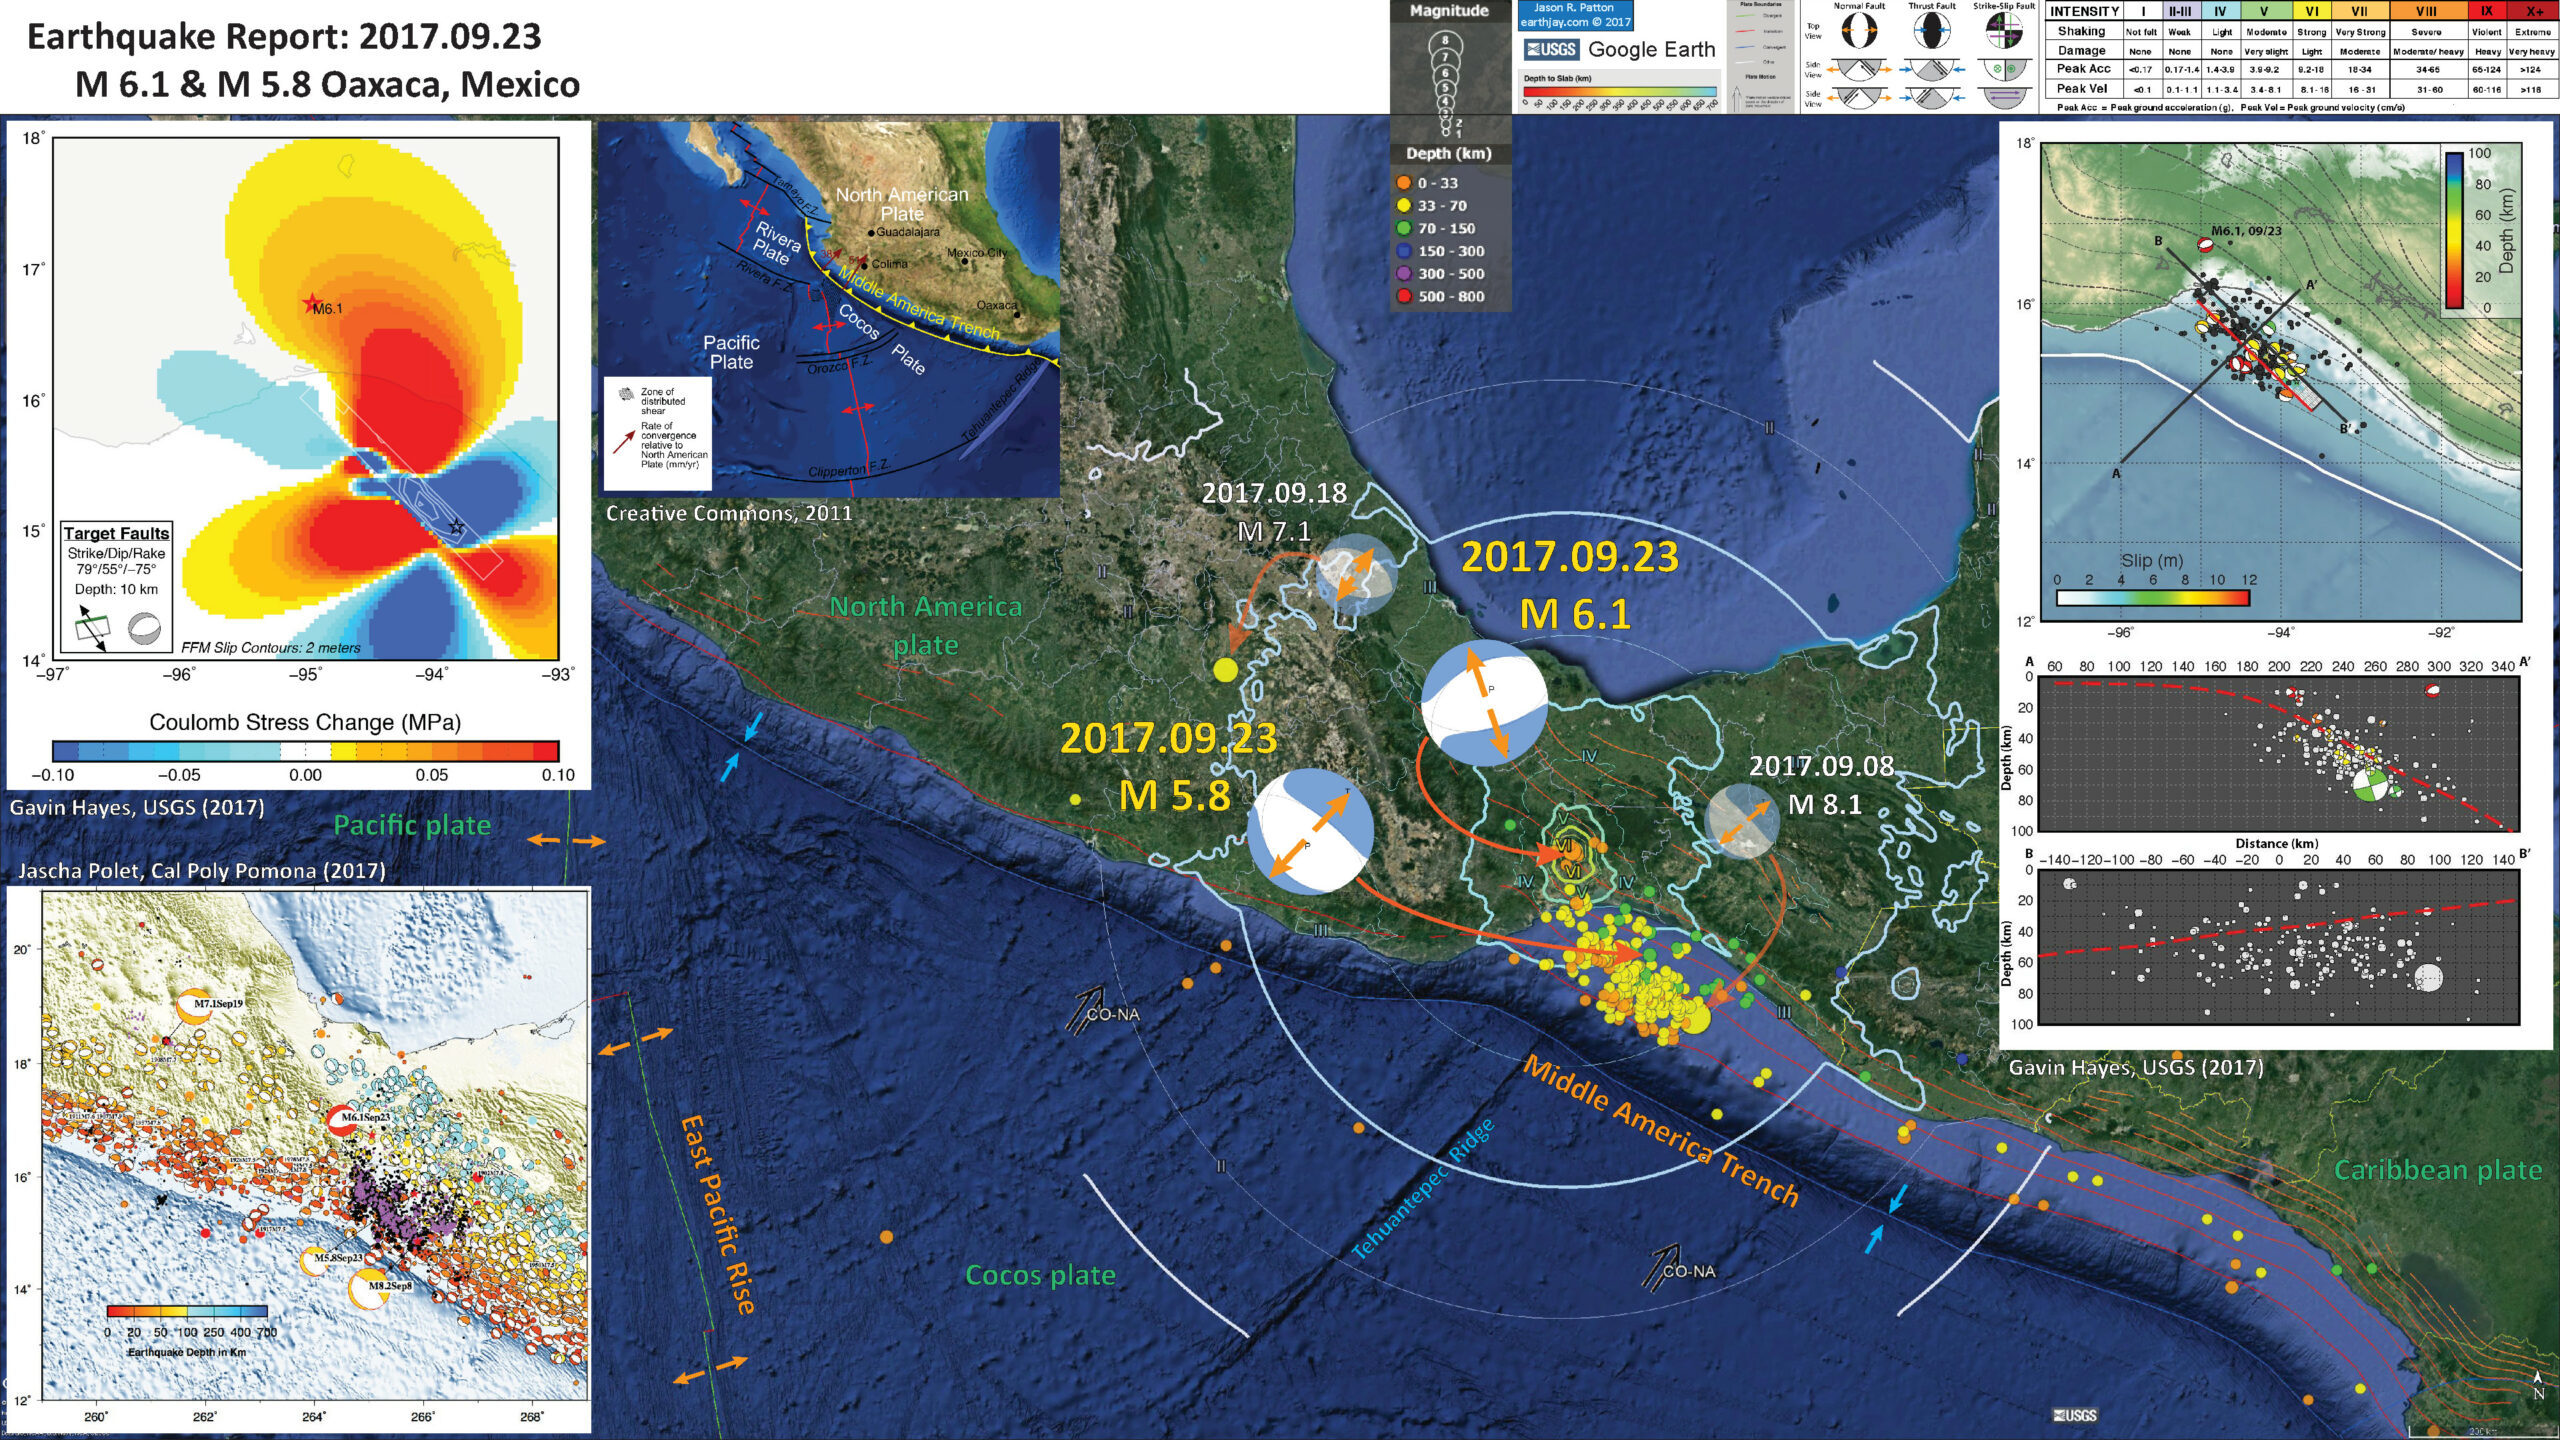
Well, we had a really interesting earthquake today. There was a M 6.1 earthquake in the North America plate (NAP) to the north of the sequence offshore of Chiapas, with the M 8.1 mainshock. Here is the USGS website for the M 6.1 earthquake. There was also an M 5.8 earthquake that was a more typical aftershock (USGS website).
- Here are my reports for this earthquake sequence.
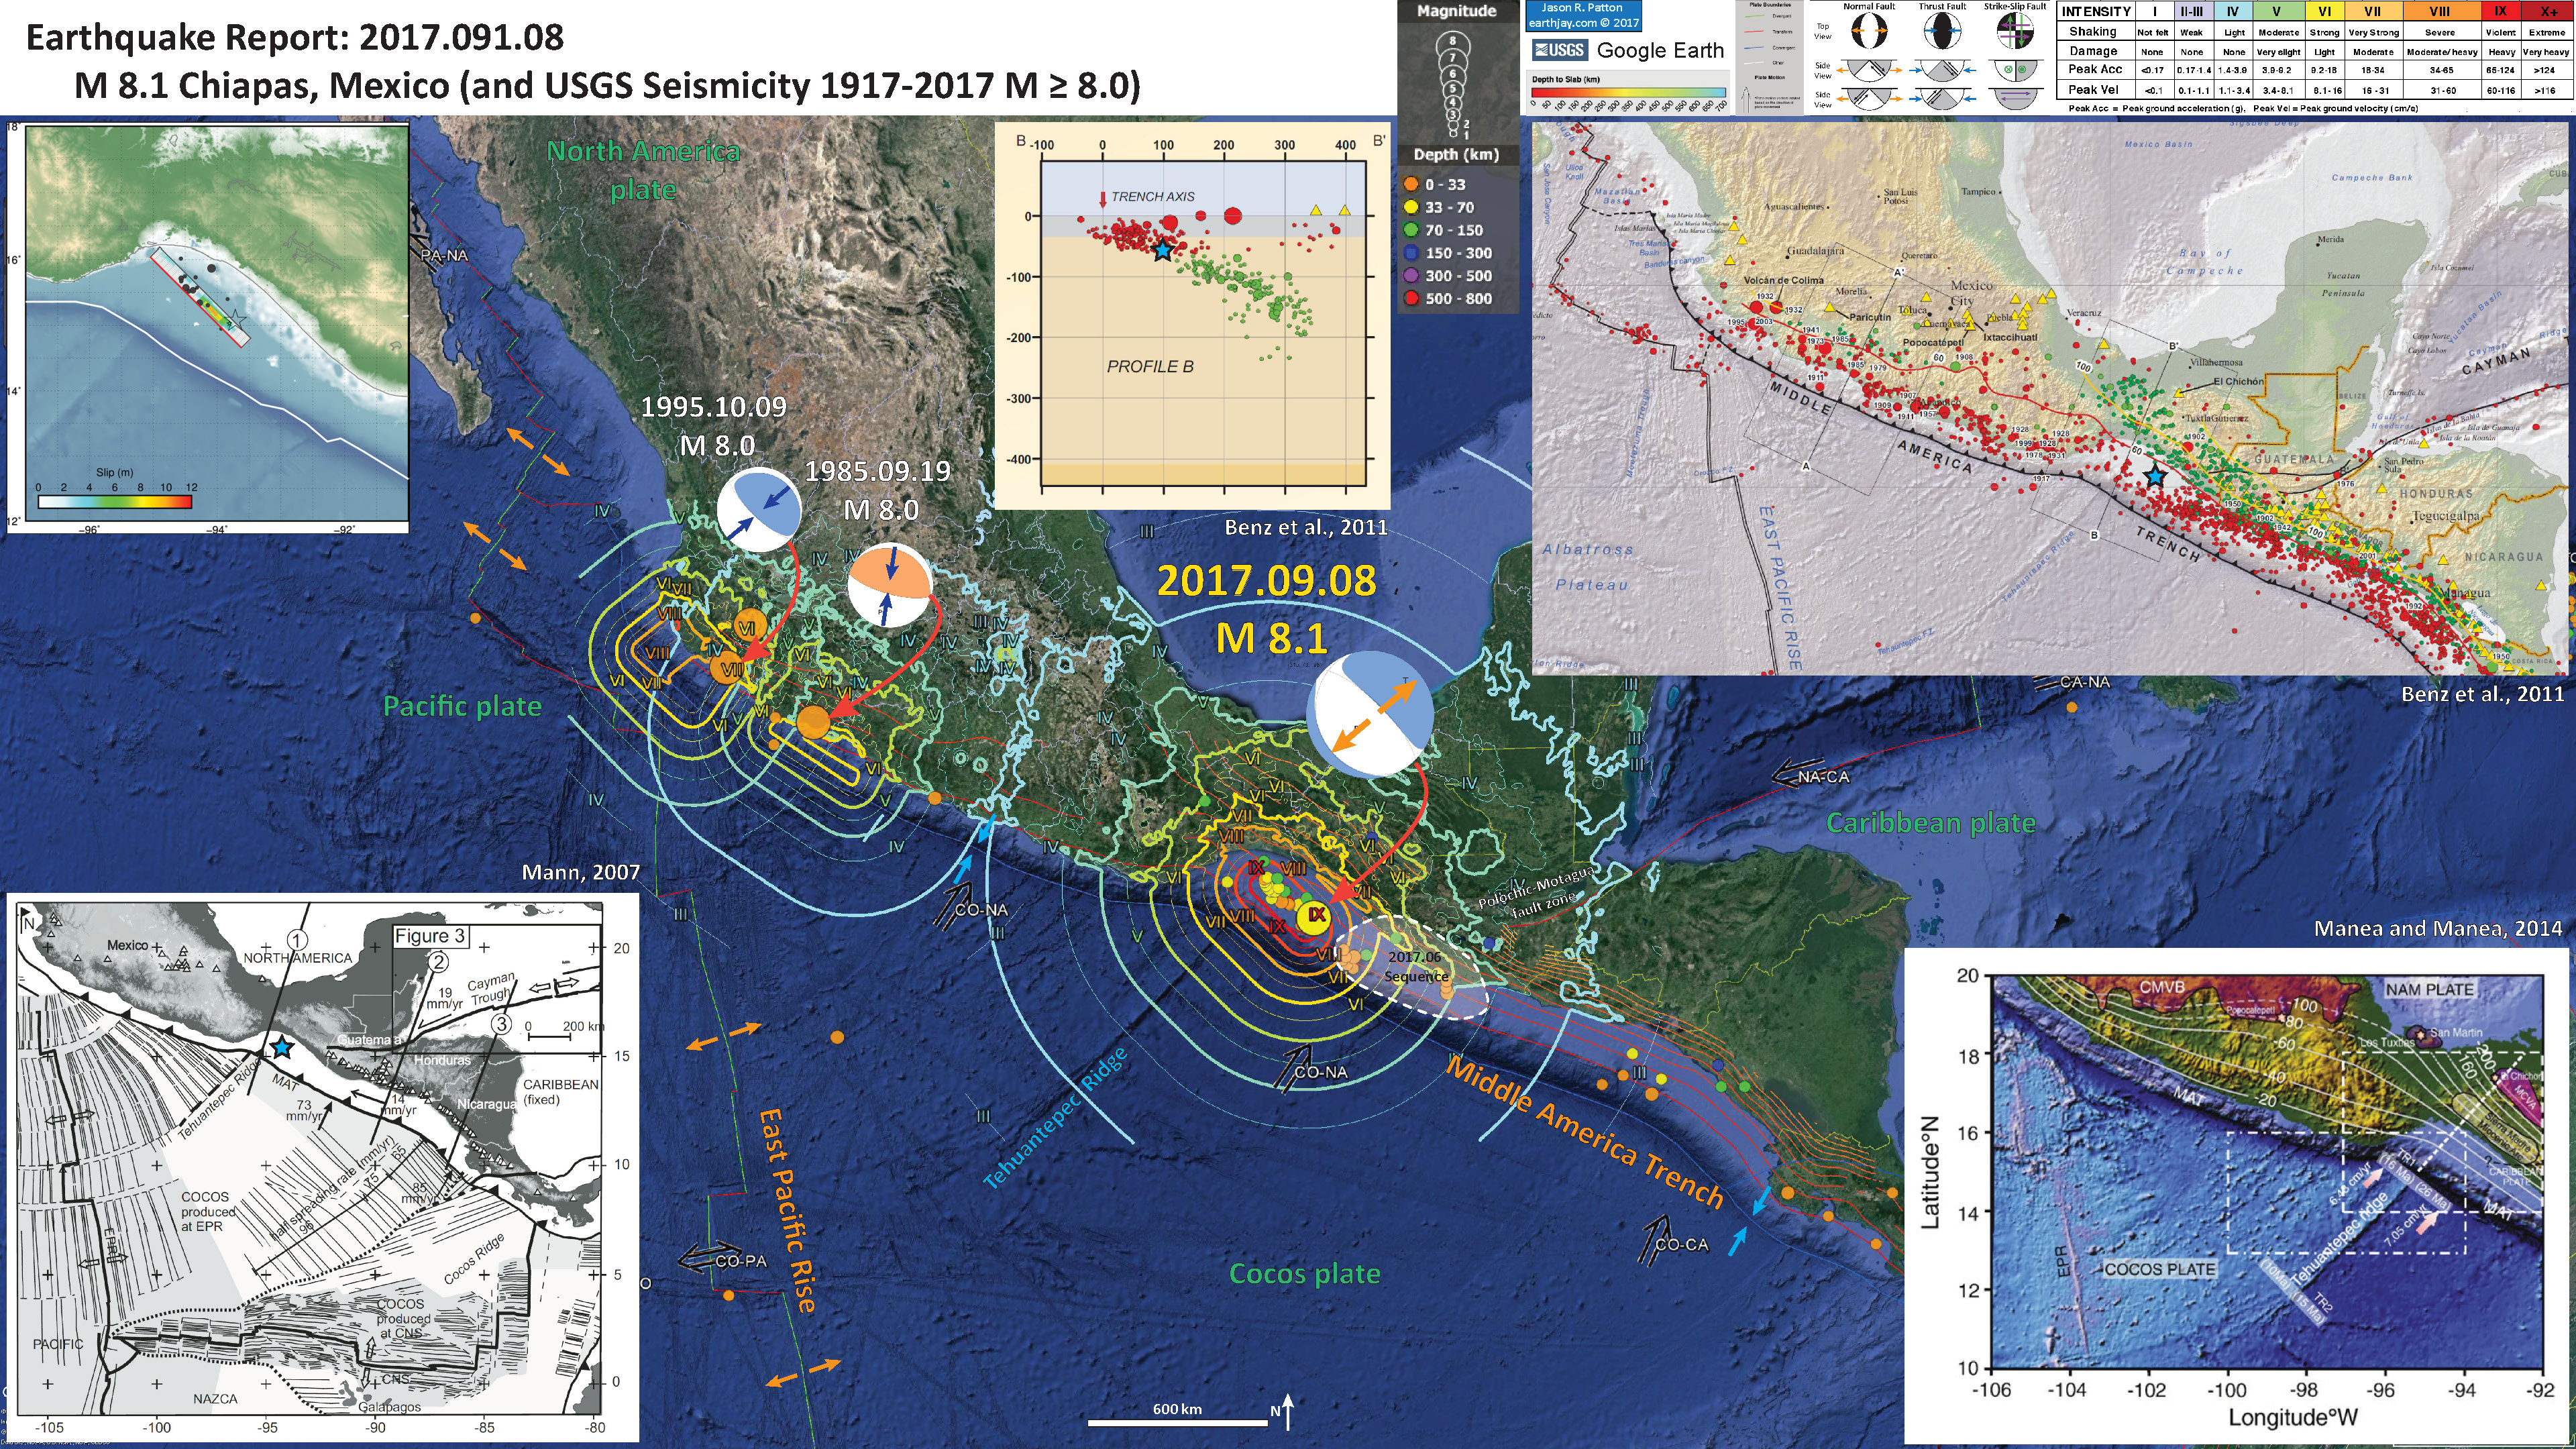
- 2017.09.08 M 8.1 Chiapas, Mexico
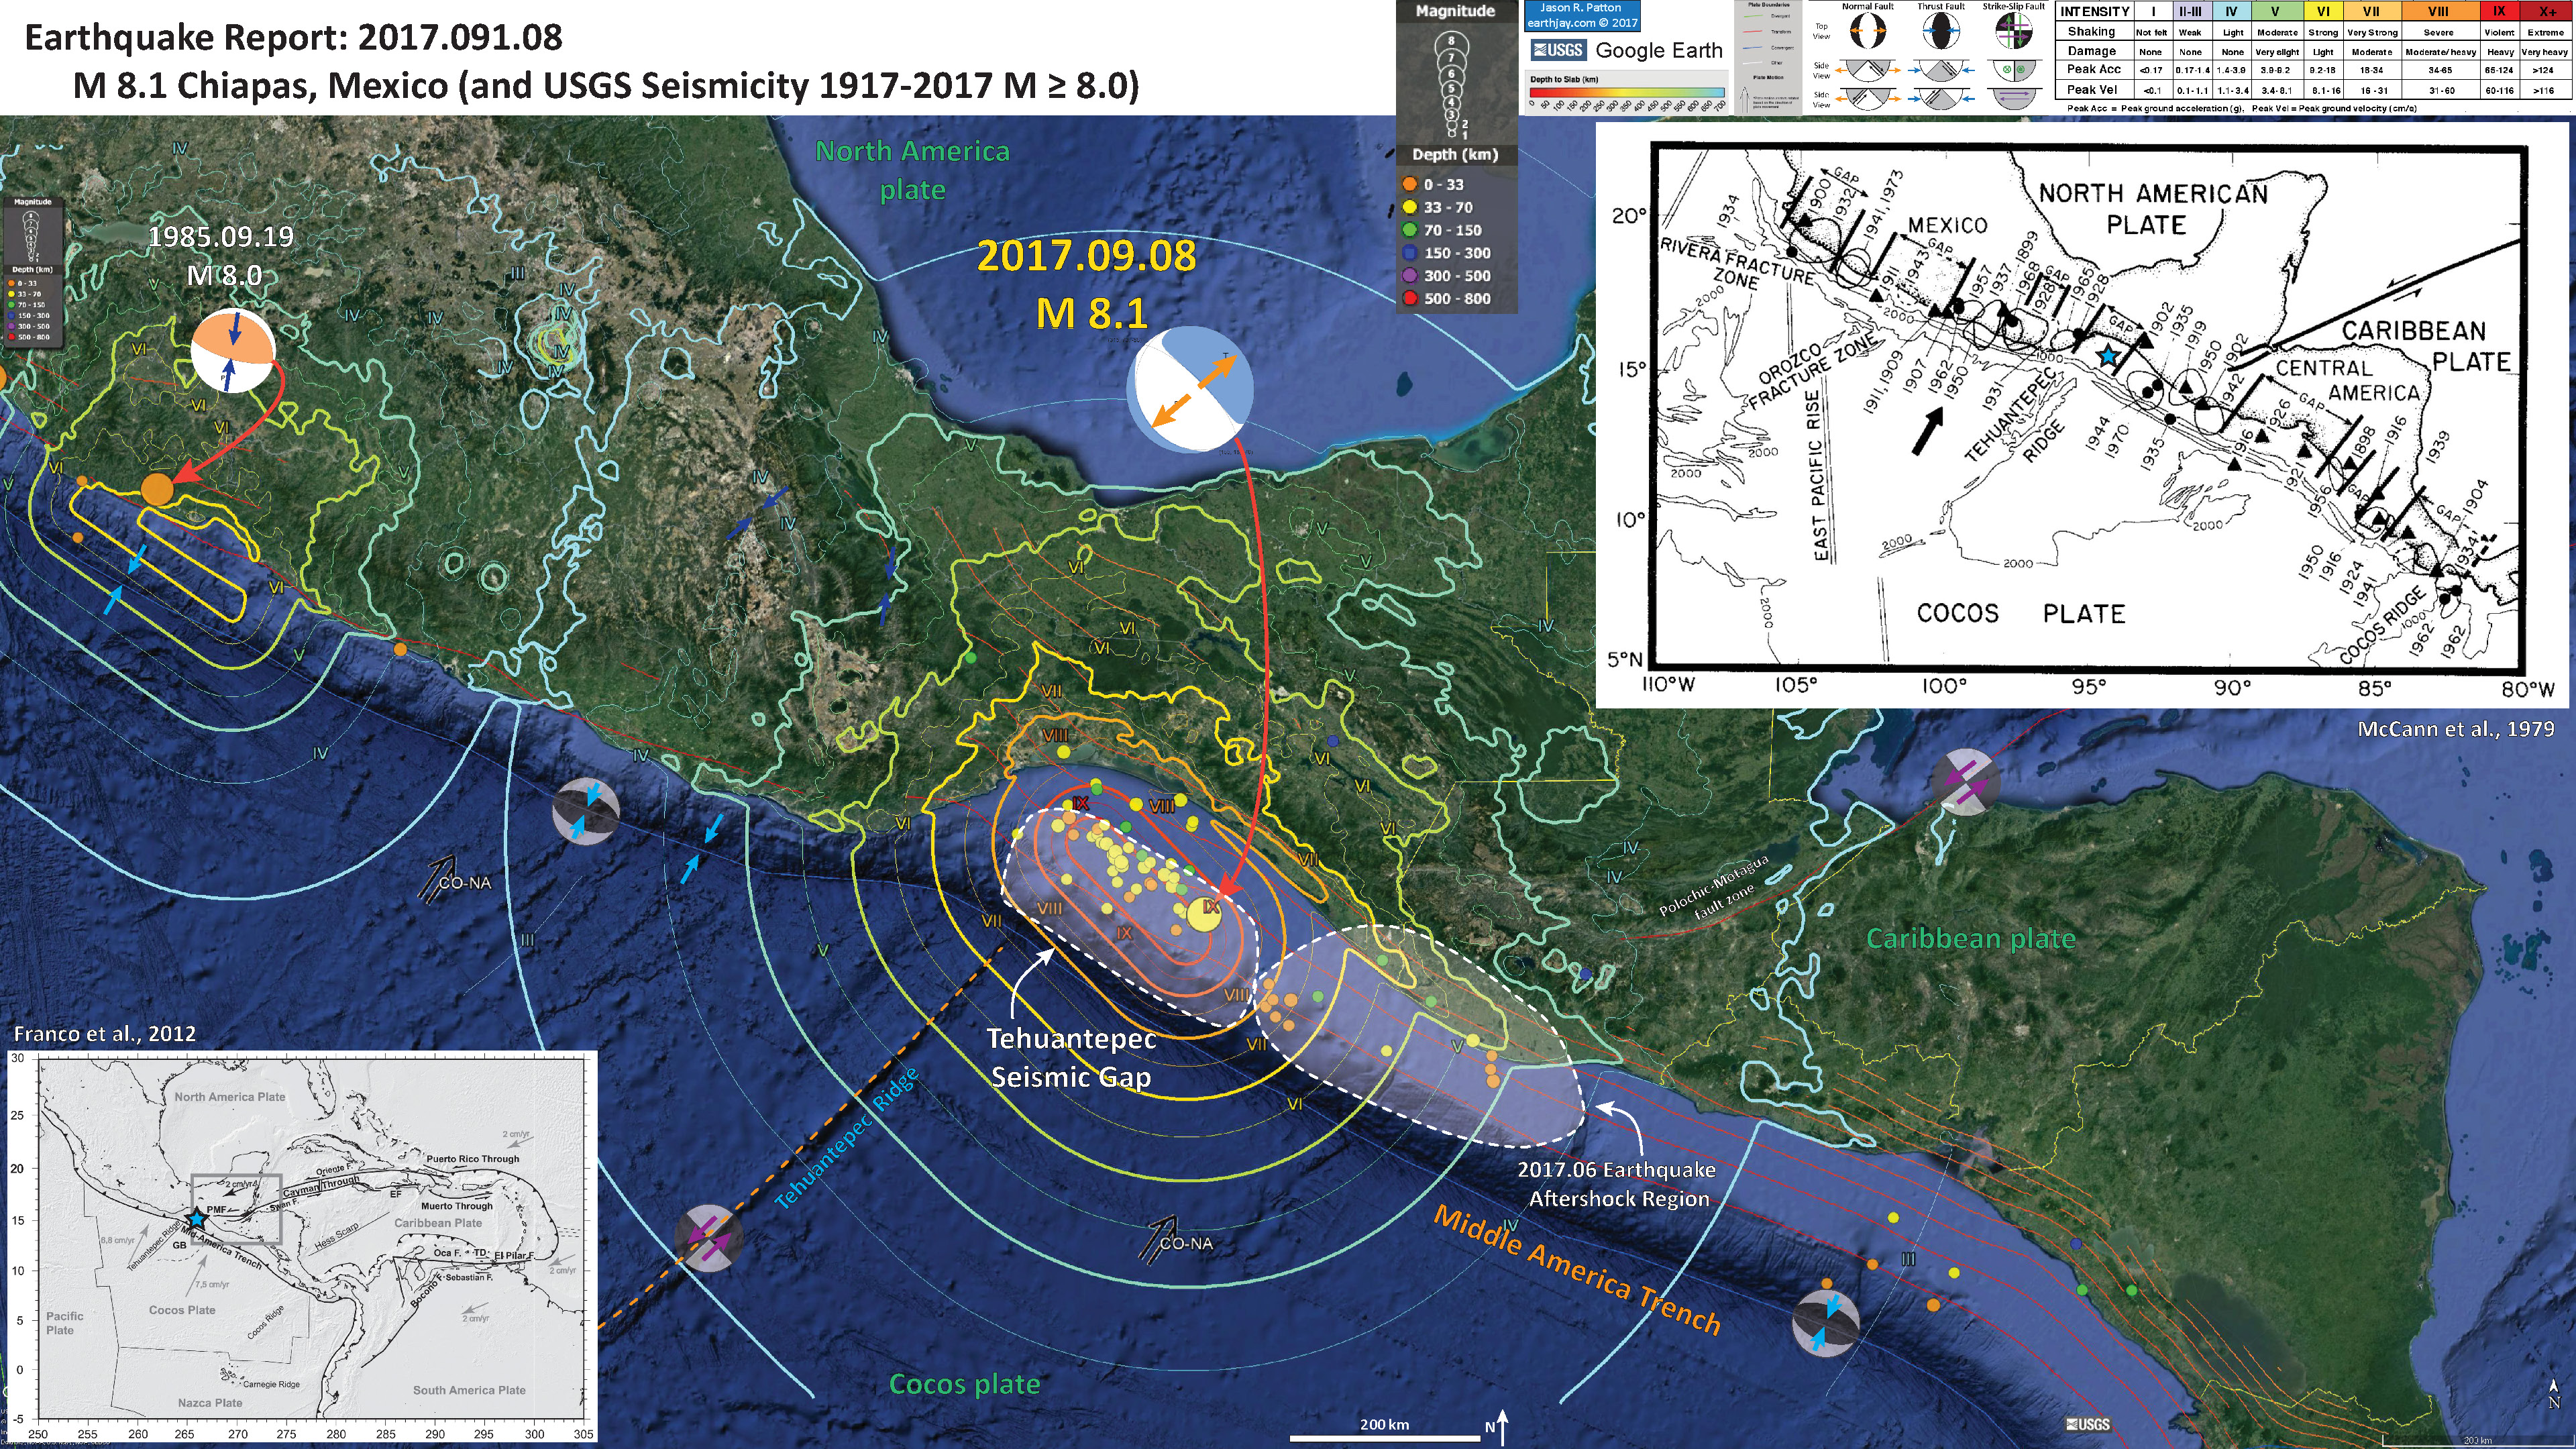
- 2017.09.08 M 8.1 Chiapas, Mexico Update #1
- Here are my reports for the coincidental earthquake in the state of Puebla, Mexico.
- 2017.09.19 M 7.1 Puebla, Mexico
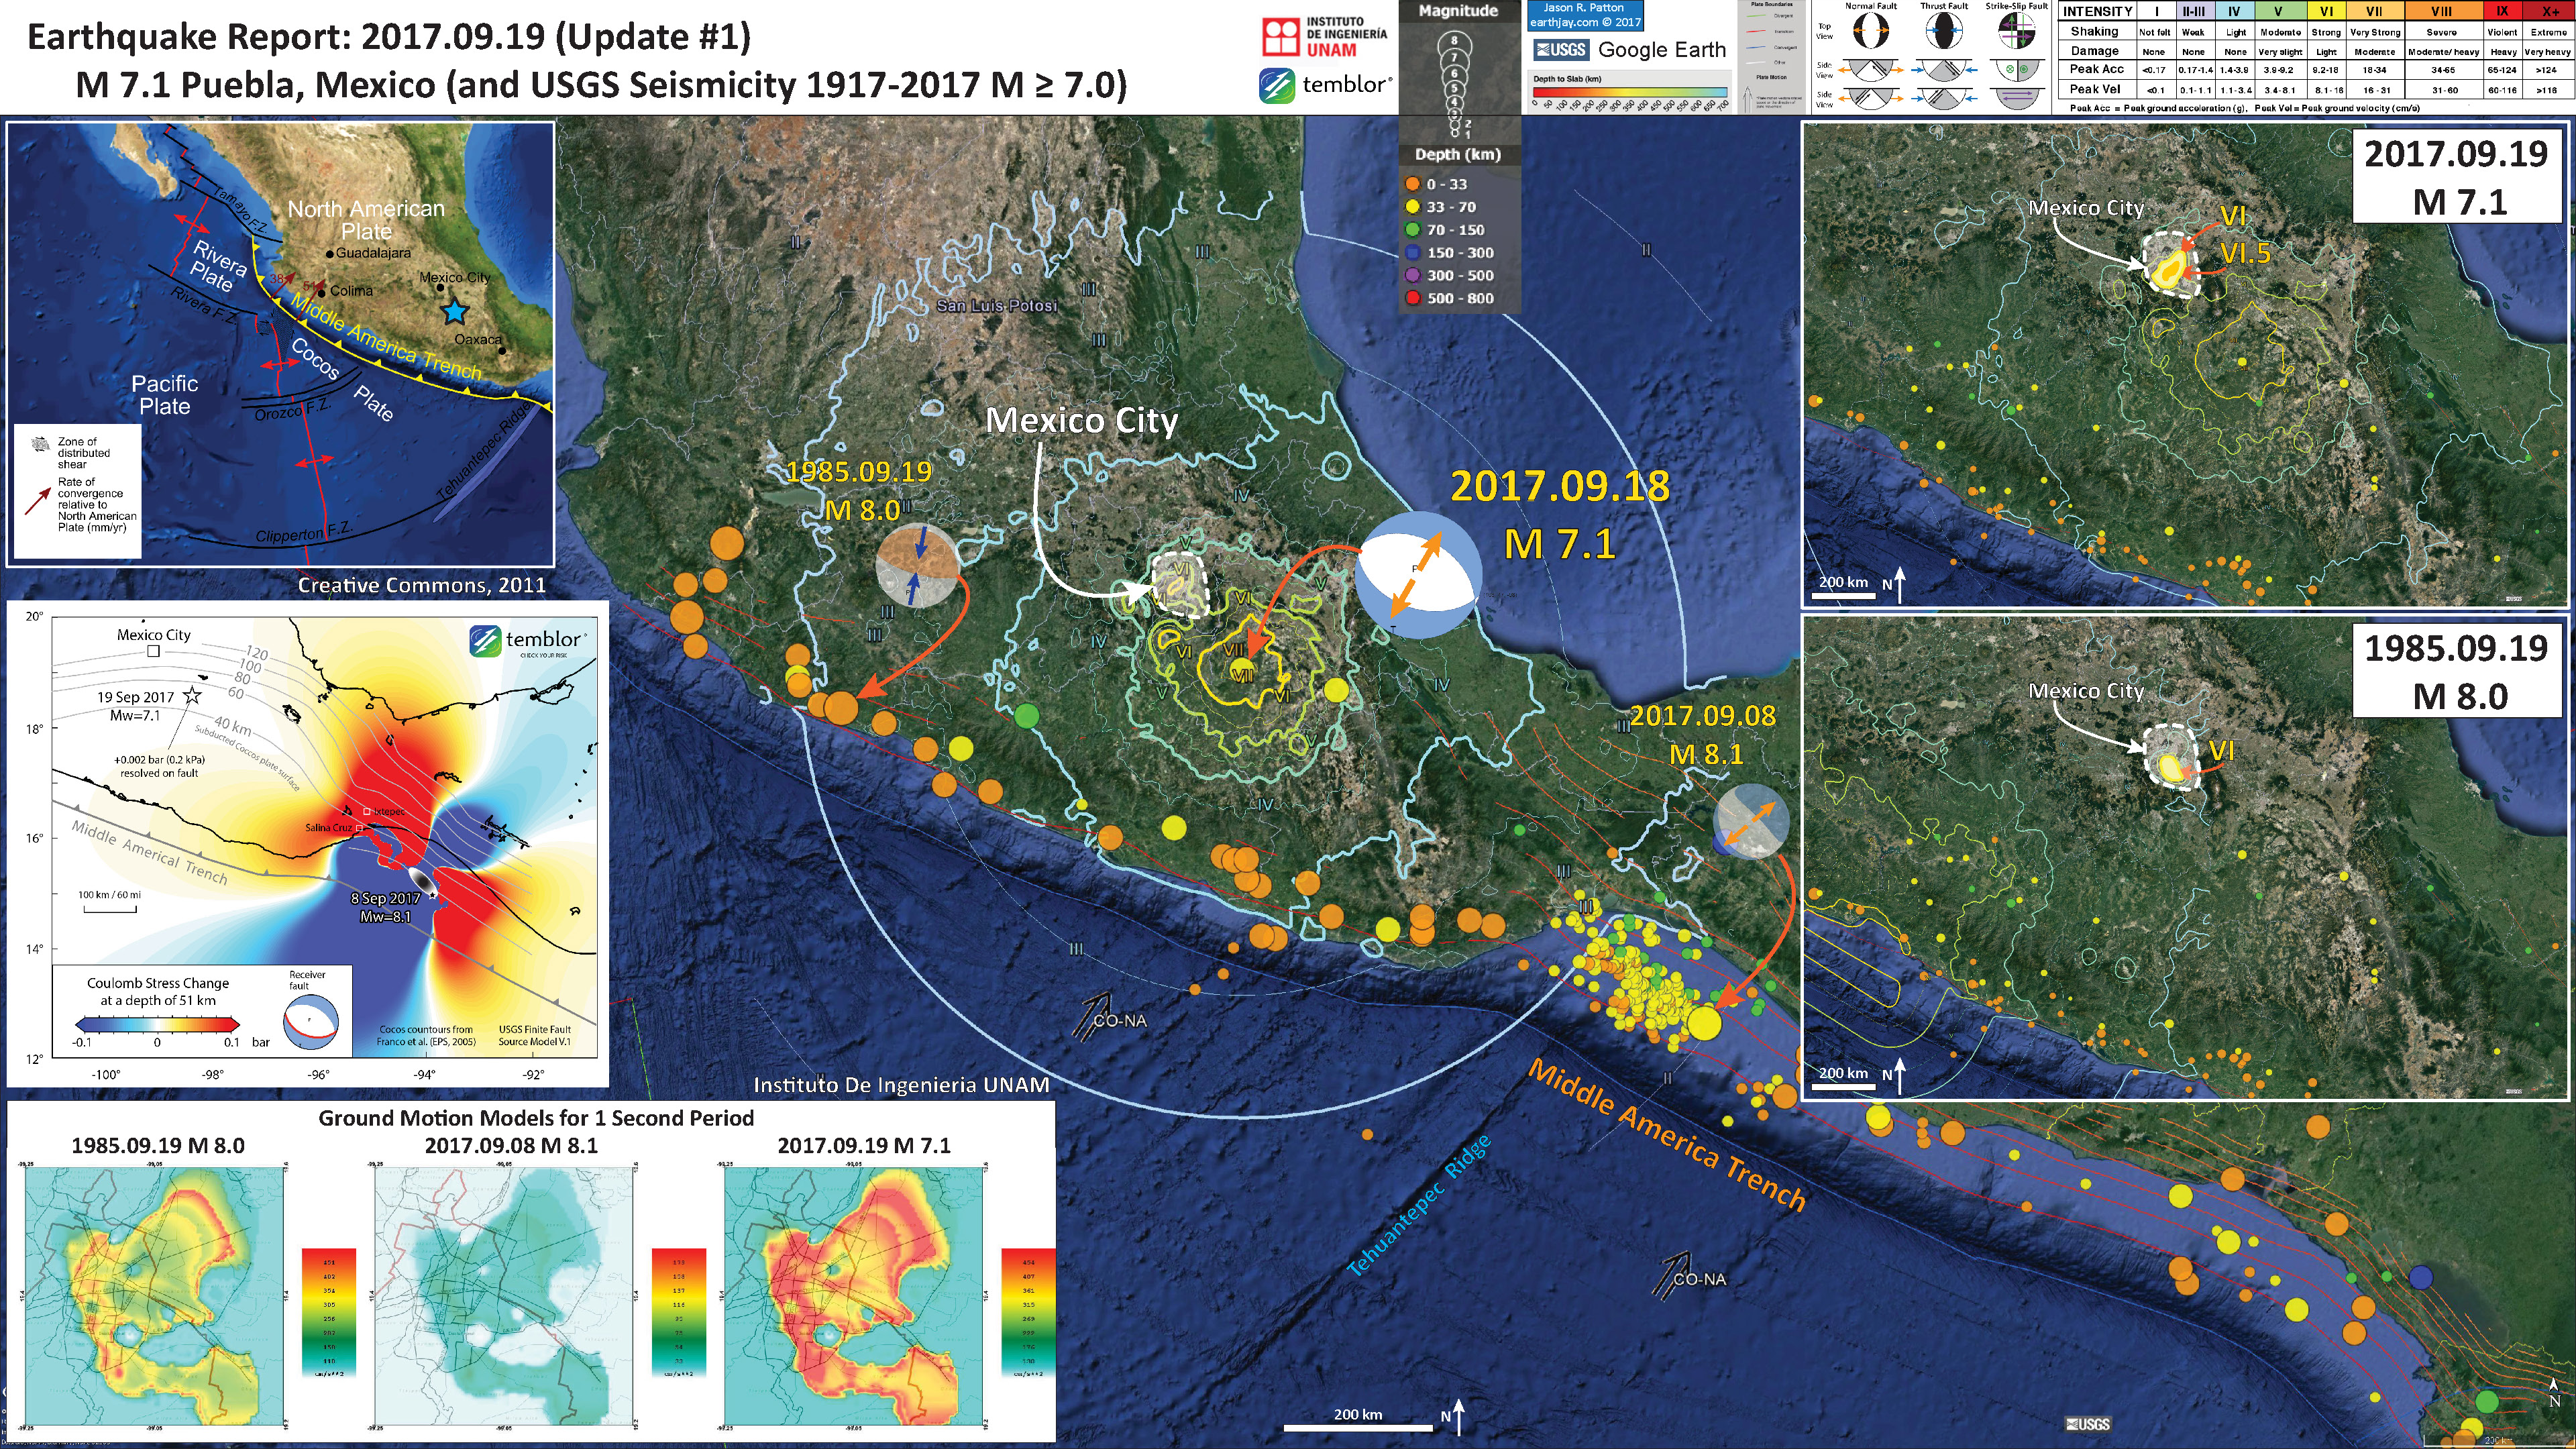
- 2017.09.19 M 7.1 Puebla, Mexico Update #1
Why is this earthquake interesting? It is outside the region of aftershocks from the M 8.1 earthquake and it is in the upper plate (the NAP). This is not altogether groundbreaking (pardon the pun) as there are many examples of earthquakes in one plate triggering earthquakes in other plates. For example, the recent sequence just to the south of the M 8.1 sequence (which may have led partly to the M 8.1 earthquake).
- Here is my reports for those earlier earthquakes offshore of Guatemala.
- 2017.06.22 M 6.8 Guatemala
- 2017.06.14 M 6.9 Guatemala
This earthquake also triggered (sorry for the pun, another one) a debate about the difference between triggered earthquakes and aftershocks. This discussion is largely semantic and does not really matter from a natural hazards perspective. The rocks behave to physics, not how we classify them. So, we don’t need to get caught up in this lexicon (as long as we all have a general understanding of what is happening). In the classic sense, I interpret this M 6.1 (and the few nearby earthquakes) to be triggered, but they are in the region that may have an increased coulomb stress.
Below is my interpretive poster for this earthquake
I plot the seismicity from the past month, with color representing depth and diameter representing magnitude (see legend). I also include USGS epicenters from 1917-2017 for magnitudes M ≥ 8.0. I include fault plane solutions for the 1985 and 1995 earthquakes (along with the MMI contours for those earthquakes, see below for a discussion of MMI contours).
- I placed a moment tensor / focal mechanism legend on the poster. There is more material from the USGS web sites about moment tensors and focal mechanisms (the beach ball symbols). Both moment tensors and focal mechanisms are solutions to seismologic data that reveal two possible interpretations for fault orientation and sense of motion. One must use other information, like the regional tectonics, to interpret which of the two possibilities is more likely.
- I also include the shaking intensity contours on the map. These use the Modified Mercalli Intensity Scale (MMI; see the legend on the map). This is based upon a computer model estimate of ground motions, different from the “Did You Feel It?” estimate of ground motions that is actually based on real observations. The MMI is a qualitative measure of shaking intensity. More on the MMI scale can be found here and here. This is based upon a computer model estimate of ground motions, different from the “Did You Feel It?” estimate of ground motions that is actually based on real observations.
- I include the slab contours plotted (Hayes et al., 2012), which are contours that represent the depth to the subduction zone fault. These are mostly based upon seismicity. The depths of the earthquakes have considerable error and do not all occur along the subduction zone faults, so these slab contours are simply the best estimate for the location of the fault.
- In the left center I include a generalized plate tectonic map from Wikimedia Creative Commons here.
- In the lower left corner I include a map from Dr. Jascha Polet. Dr. Polet plots focal mechanisms for historic earthquakes. Dr. Polet notes the M 8.1, M7.1, M 6.1, and M 5.8 earthquakes too. Purple dots are epicenters after the M 8.1 earthquake and black dots are SSN (the Mexico seismic network data).
- In the upper right corner is a map and cross section from Dr. Gavin Hayes. The upper cross section, oriented perpendicular to the subduction zone fault, shows focal mechanisms. Note how the M 8.1 (large green symbol) is in the downgoing Cocos plate and the M 6,.1 (small red symbol at about 300 km) is in the North America plate.
- In the upper left corner is a figure Dr. Hayes also prepared. This shows the change in static coulomb stress associated with the M 8.1 earthquake. Tremblor prepared this analysis and I presented that in the M 7.1 earthquake report here. Basically, areas of warm color show an increased stress and regions of cool color show a decreased stress. So, areas in warm color are more likely to trigger an earthquake. Though this is a simple run as different faults can respond differently.
I include some inset figures in the poster.
- Here is the update #1 report poster for the M 7.1 Puebla, Mexico earthquake (which shows the coulomb stress modeling from Tremblor).
- Here is Dr. Polet’s tweet of this map.
- AND an updated map and cross section.
Updated seismicity map, with today's two intraplate events: M5.8 within subducting slab, M6.1 at shallower depth within overriding plate pic.twitter.com/90iUgexfdi
— Jascha Polet (@CPPGeophysics) September 23, 2017
Cross-section shows different tectonic environments for recent large quakes (excl. Sep 19): extension within slab versus in overriding plate pic.twitter.com/cZFfYUWLJF
— Jascha Polet (@CPPGeophysics) September 23, 2017
- Here is Dr. Hayes’ tweet of his map and cross section.
M6.1 Mexico EQ this morning an upper plate aftershock of the fairly diverse aftershock sequence to the 09-08 M8.1 EQ. Slab xsecs here. pic.twitter.com/X7kCevaNYd
— Gavin Hayes (@gph_seismo) September 23, 2017
- Here is Dr. Hayes’ tweet of his static coulomb change map.
Stress change at location of M6.1 Mexico EQ this morning as a result of prior 09-08 M8.1 EQ. Stress change on both planes about the same. pic.twitter.com/4GWNURpkex
— Gavin Hayes (@gph_seismo) September 23, 2017
- The discussion about what is a triggered earthquake and what is an aftershock, as I mentioned above, is the topic of discussion between experts in the field. The debate will probably be enduring for a quite a while, especially since classification systems are a social construct and have no real basis in reality (or physics). Classification systems are an excellent example of how science is subjective (science is fundamentally subjective, but that is a longer discussion, read some Karl Popper for more insight). This discussion led me to a web post following the 2011 Christchurch earthquake sequence. Here is a website with one view on this debate, prepared by Dr. Chris Rowan. I present two of their figures below.
- 2017.09.19 M 7.1 Puebla, Mexico
- 2017.09.19 M 7.1 Puebla, Mexico Update #1
- 2017.09.08 M 8.1 Chiapas, Mexico
- 2017.09.08 M 8.1 Chiapas, Mexico Update #1
- 2017.09.23 M 8.1 Chiapas, Mexico Update #2
- 2017.06.22 M 6.8 Guatemala
- 2017.06.14 M 6.9 Guatemala
- 2017.05.12 M 6.2 El Salvador
- 2017.03.29 M 5.7 Gulf of California
- 2016.11.24 M 7.0 El Salvador
- 2016.04.29 M 6.6 East Pacific Rise / MAT
- 2016.01.21 M 6.6 Mexico
- 2015.09.13 M 6.6 Gulf California
- 2015.09.13 M 6.6 Gulf California Update #1
- 2014.10.14 M 7.3 El Salvador
- 2013.10.20 M 6.4 Gulf California
Mexico | Central America
General Overview
Earthquake Reports
References:
- Benz, H.M., Dart, R.L., Villaseñor, Antonio, Hayes, G.P., Tarr, A.C., Furlong, K.P., and Rhea, Susan, 2011 a. Seismicity of the Earth 1900–2010 Mexico and vicinity: U.S. Geological Survey Open-File Report 2010–1083-F, scale 1:8,000,000.
- Benz, H.M., Tarr, A.C., Hayes, G.P., Villaseñor, Antonio, Furlong, K.P., Dart, R.L., and Rhea, Susan, 2011 b. Seismicity of the Earth 1900–2010 Caribbean plate and vicinity: U.S. Geological Survey Open-File Report 2010–1083-A, scale 1:8,000,000.
- Franco, A., C. Lasserre H. Lyon-Caen V. Kostoglodov E. Molina M. Guzman-Speziale D. Monterosso V. Robles C. Figueroa W. Amaya E. Barrier L. Chiquin S. Moran O. Flores J. Romero J. A. Santiago M. Manea V. C. Manea, 2012. Fault kinematics in northern Central America and coupling along the subduction interface of the Cocos Plate, from GPS data in Chiapas (Mexico), Guatemala and El Salvador in Geophysical Journal International., v. 189, no. 3, p. 1223-1236. DOI: https://doi.org/10.1111/j.1365-246X.2012.05390.x
- Franco, S.I., Kostoglodov, V., Larson, K.M., Manea, V.C>, Manea, M., and Santiago, J.A., 2005. Propagation of the 2001–2002 silent earthquake and interplate coupling in the Oaxaca subduction zone, Mexico in Earth Planets Space, v. 57., p. 973-985.
- Garcia-Casco, A., Projenza, J.A., Iturralde-Vinent, M.A., 2011. Subduction Zones of the Caribbean: the sedimentary, magmatic, metamorphic and ore-deposit records UNESCO/iugs igcp Project 546 Subduction Zones of the Caribbean in Geologica Acta, v. 9, no., 3-4, p. 217-224
- Hayes, G. P., D. J. Wald, and R. L. Johnson, 2012. Slab1.0: A three-dimensional model of global subduction zone geometries, J. Geophys. Res., 117, B01302, doi:10.1029/2011JB008524.
- Lay et al., 2011. Outer trench-slope faulting and the 2011 Mw 9.0 off the Pacific coast of Tohoku Earthquake in Earth Planets Space, v. 63, p. 713-718.
- Manea, M., and Manea, V.C., 2014. On the origin of El Chichón volcano and subduction of Tehuantepec Ridge: A geodynamical perspective in JGVR, v. 175, p. 459-471.
- Mann, P., 2007, Overview of the tectonic history of northern Central America, in Mann, P., ed., Geologic and tectonic development of the Caribbean plate boundary in northern Central America: Geological Society of America Special Paper 428, p. 1–19, doi: 10.1130/2007.2428(01). For
- McCann, W.R., Nishenko S.P., Sykes, L.R., and Krause, J., 1979. Seismic Gaps and Plate Tectonics” Seismic Potential for Major Boundaries in Pageoph, v. 117
- Symithe, S., E. Calais, J. B. de Chabalier, R. Robertson, and M. Higgins, 2015. Current block motions and strain accumulation on active faults in the Caribbean in J. Geophys. Res. Solid Earth, v. 120, p. 3748–3774, doi:10.1002/2014JB011779.


