People have been busy documenting the damage from the M 6.4 earthquake in Taiwan. Here is my initial Earthquake Report for this earthquake.
-
Here are a couple news sources on the damage. There appears to be a few large buildings that have collapsed, but this damage is localized.
- 2016.02.06 BBC
- 2016.02.06 Channel News Asia
-
Here are other blogs on this subject:
- Temblor
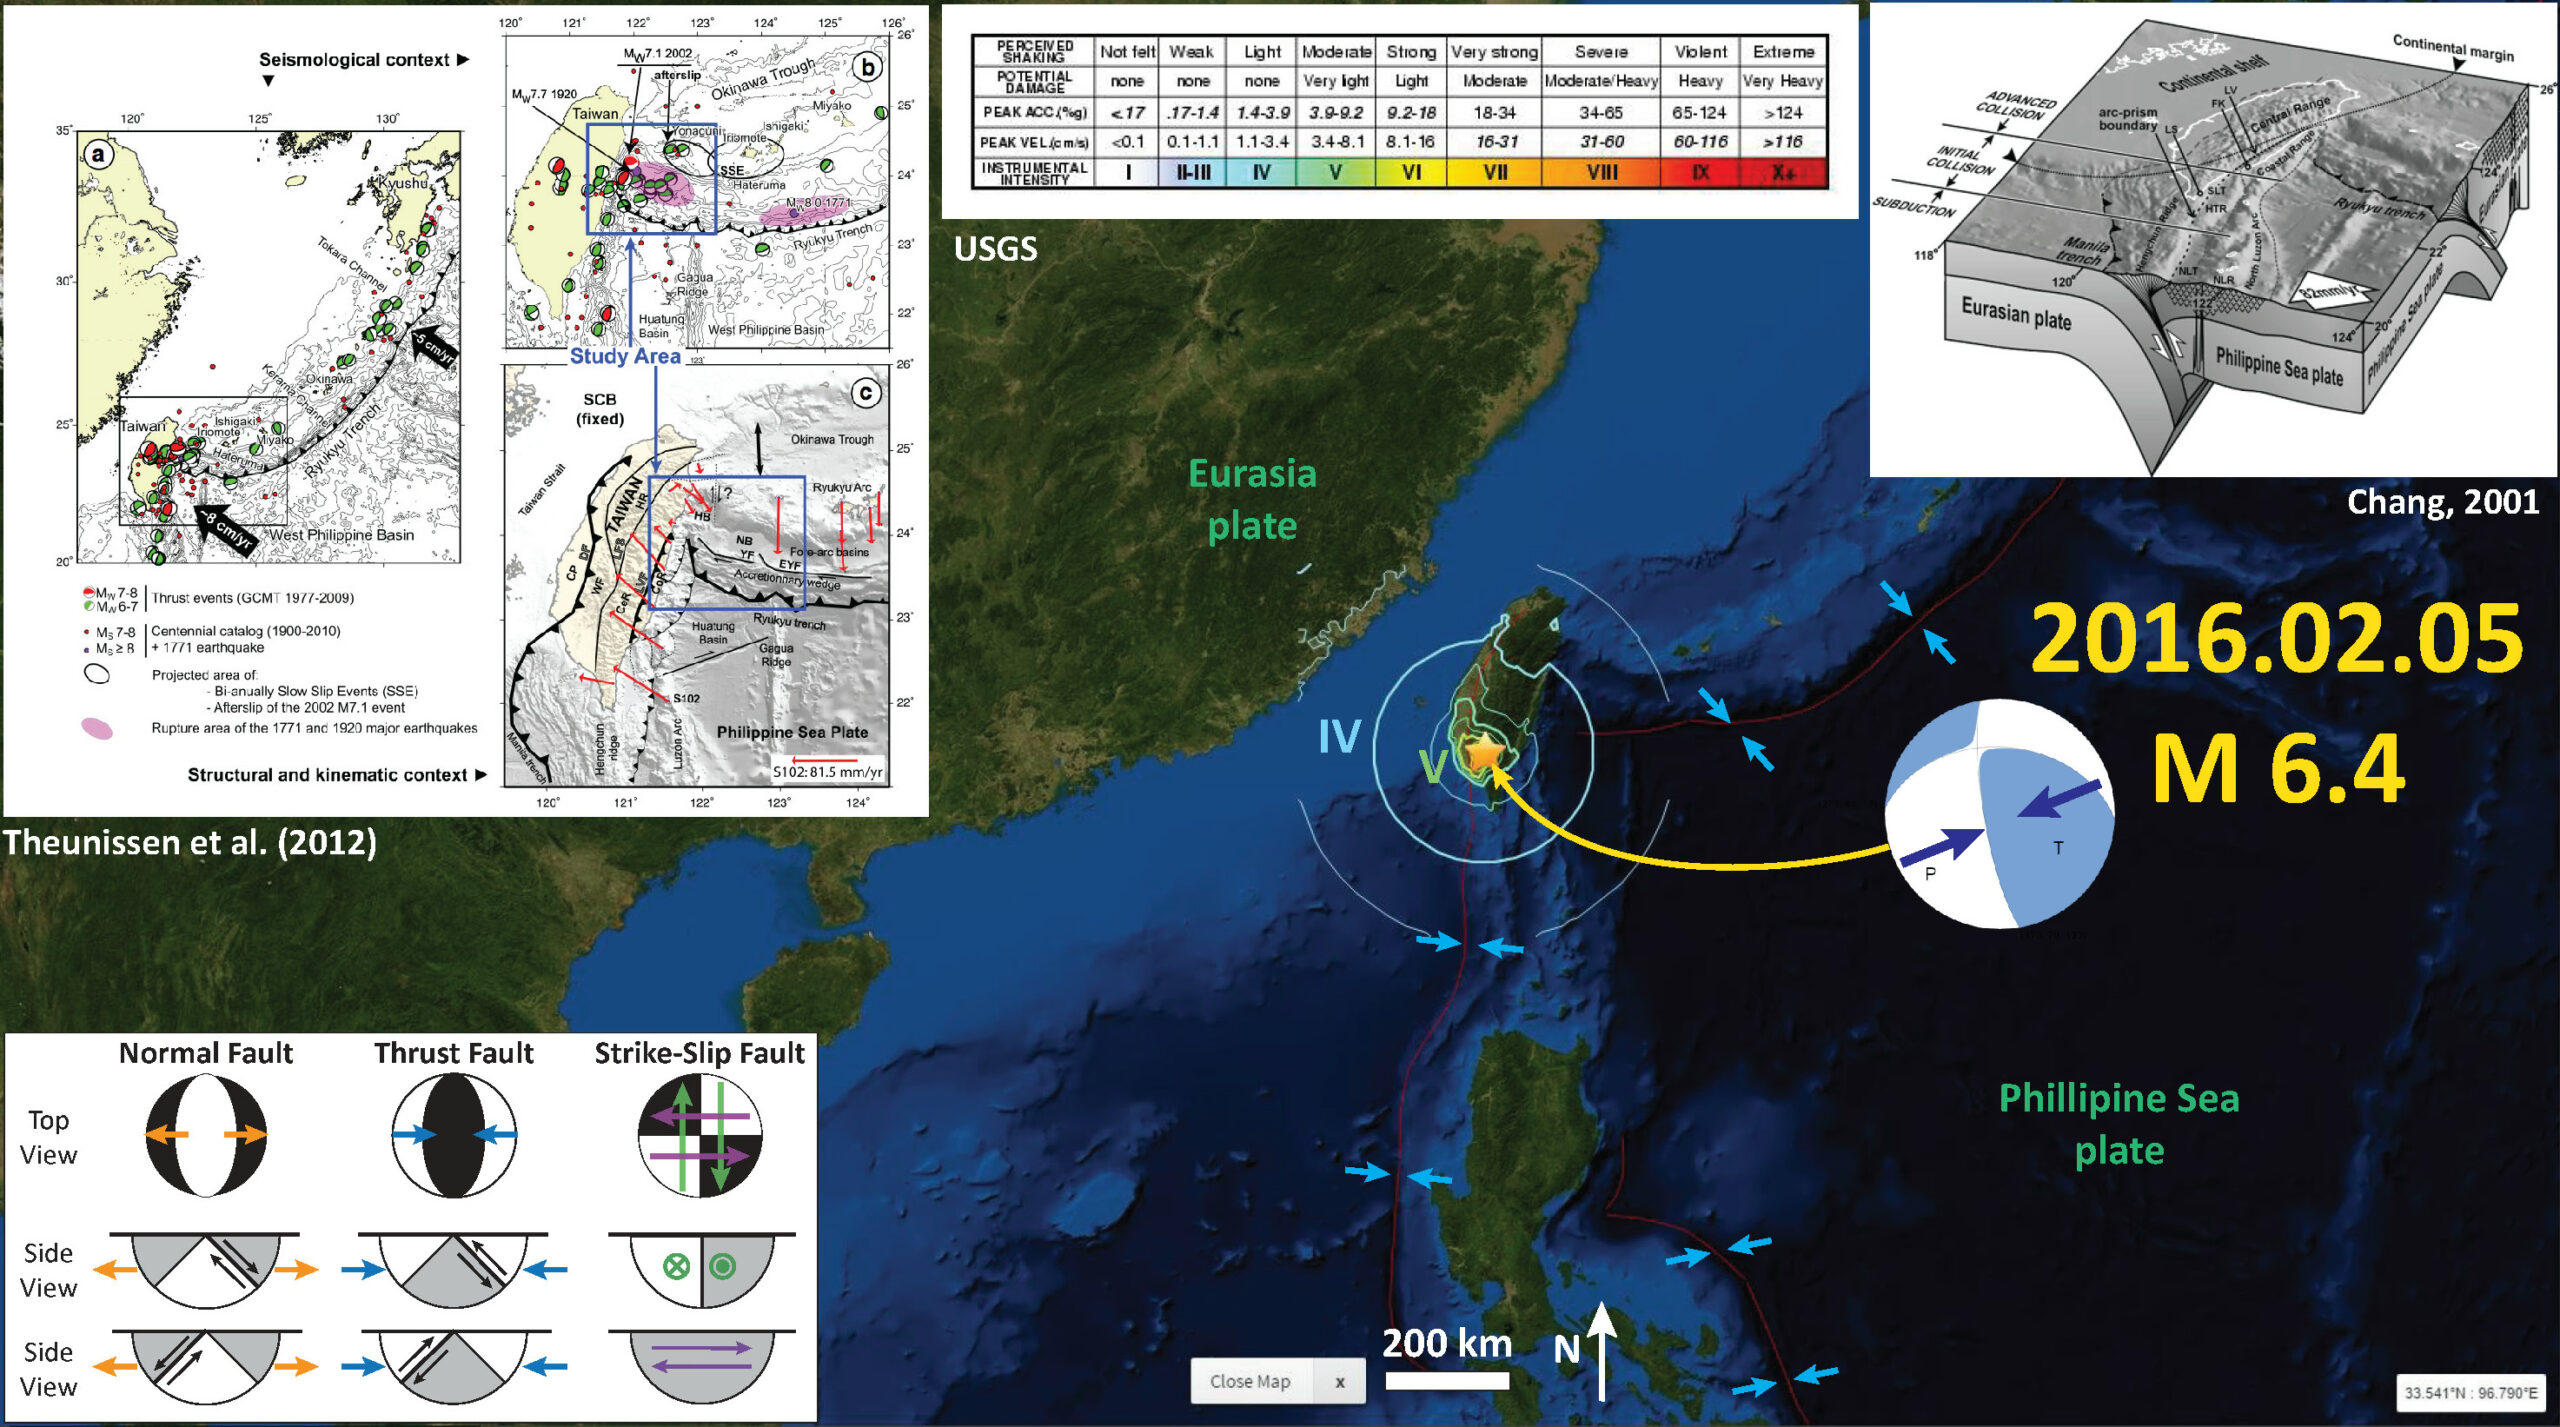
Here is the interpretive map that I put together for my initial Earthquake Report.
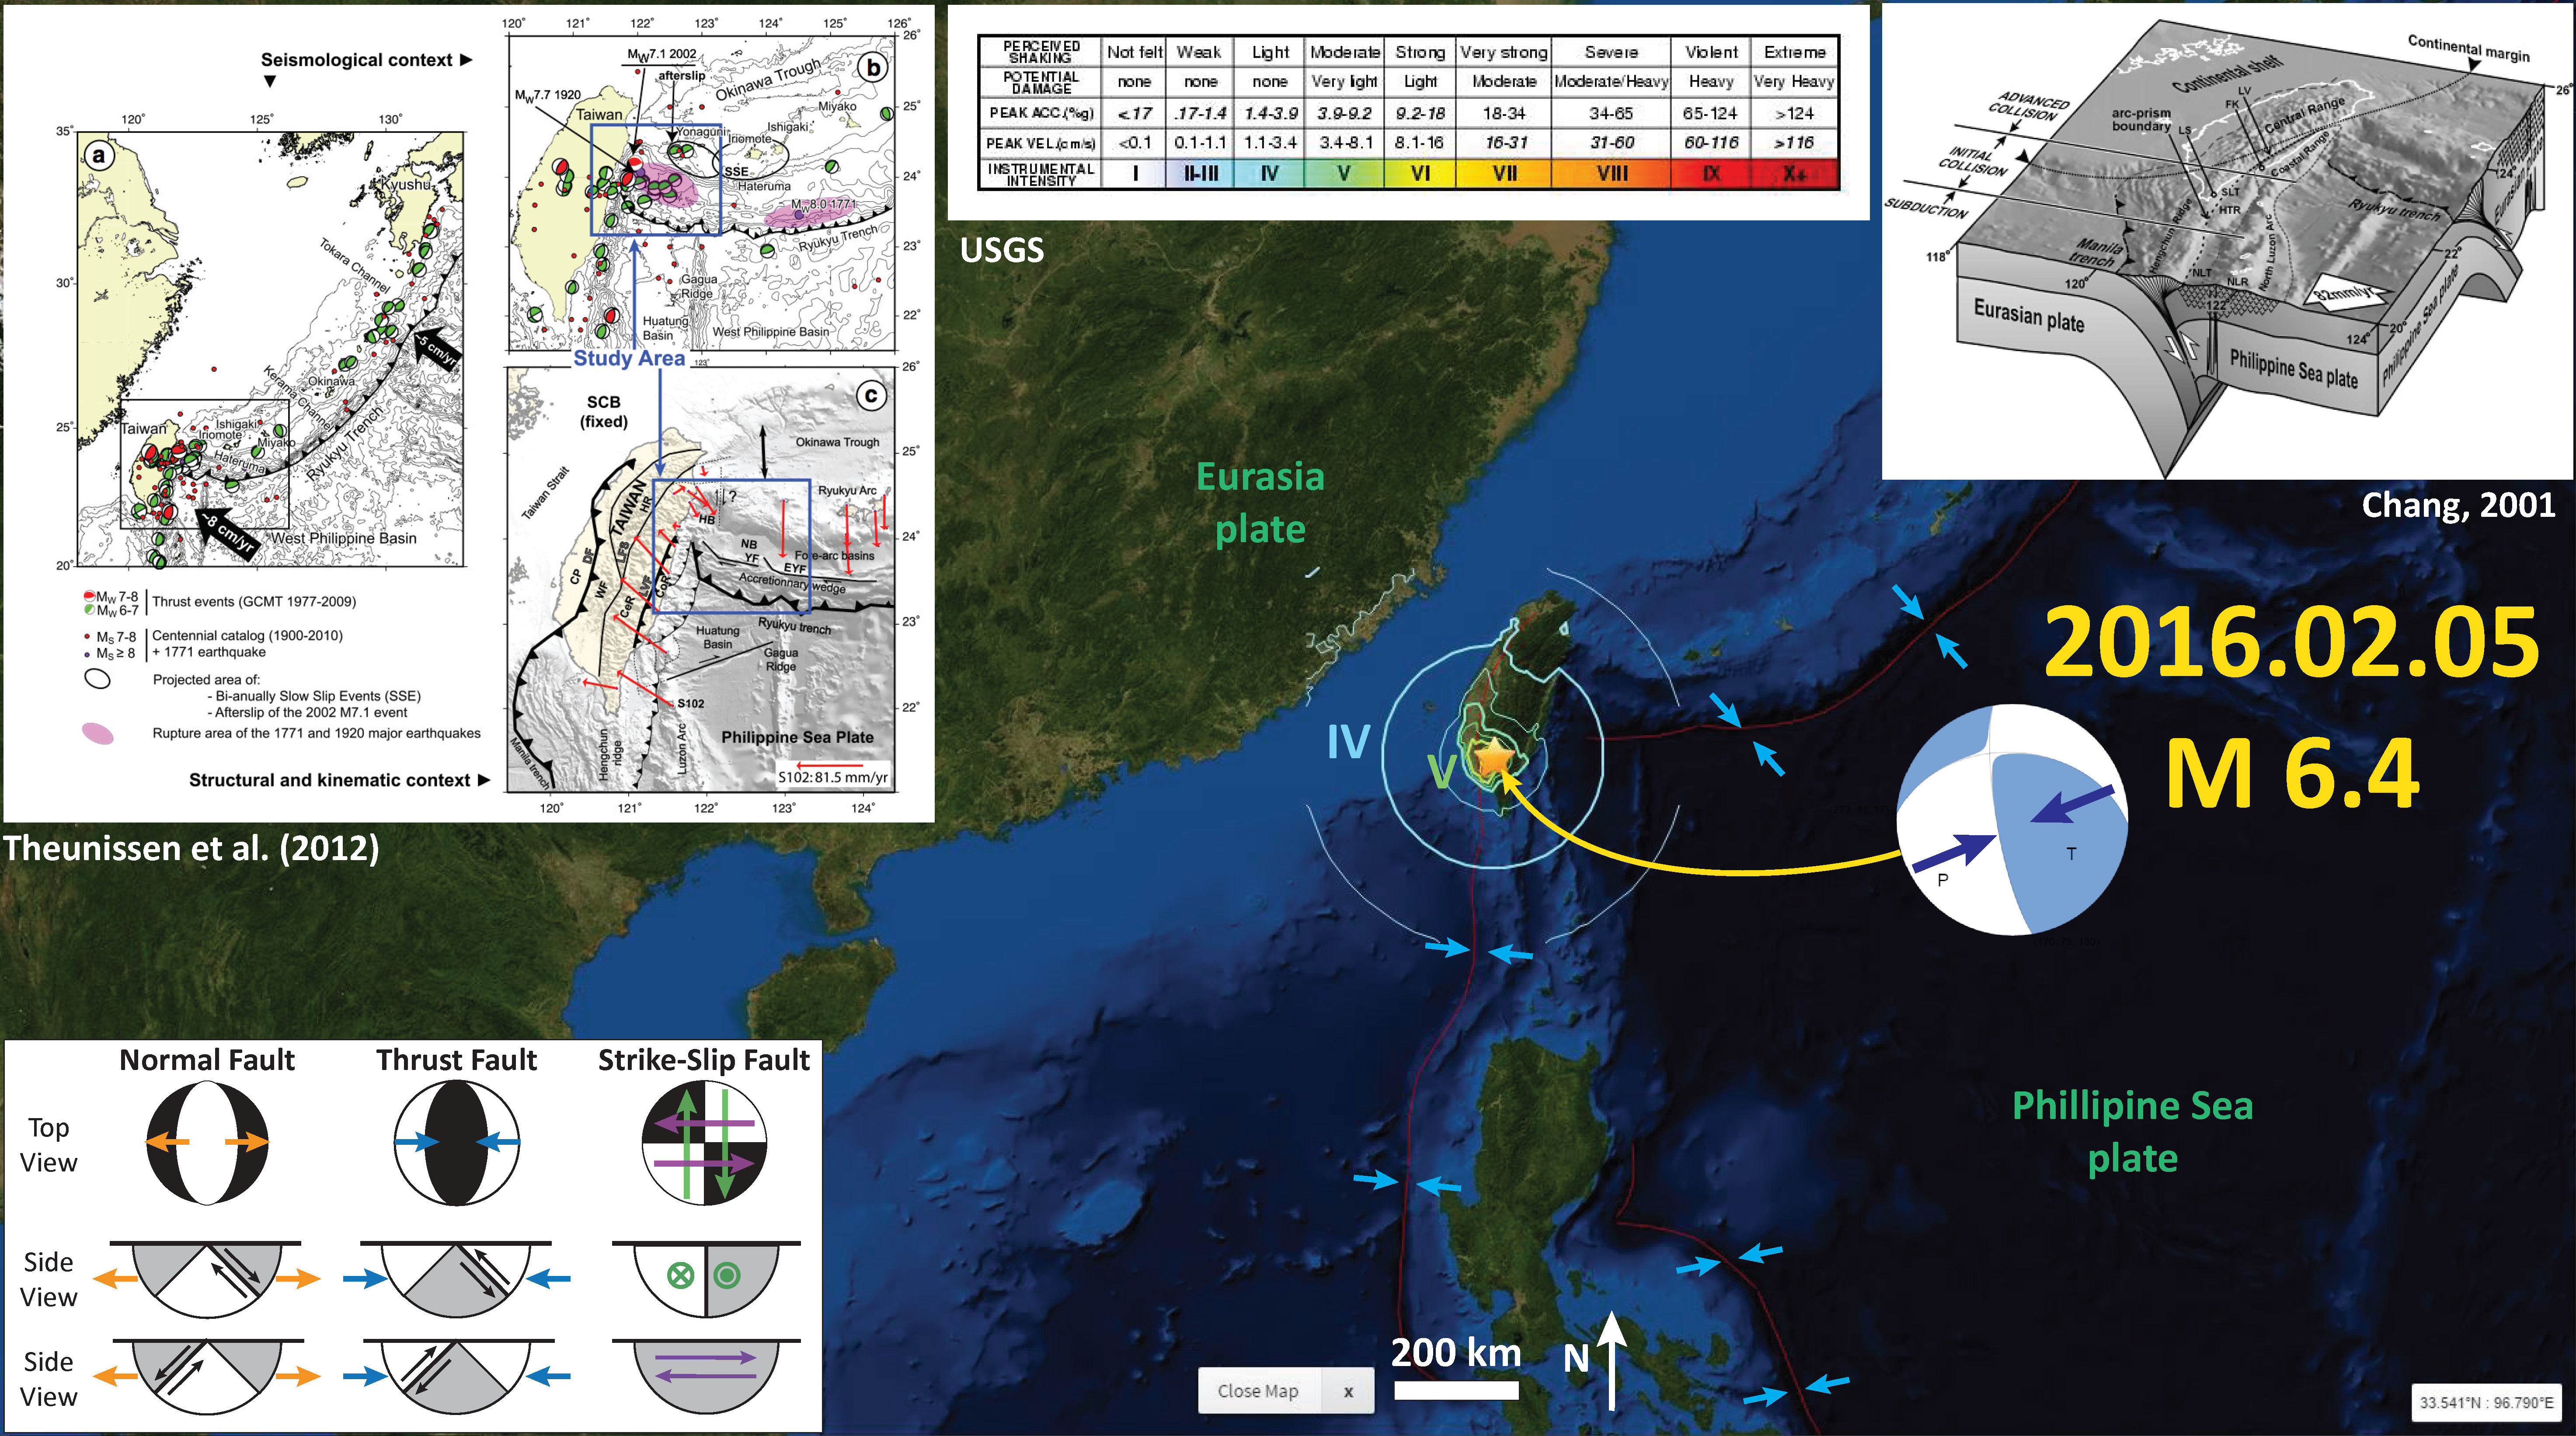
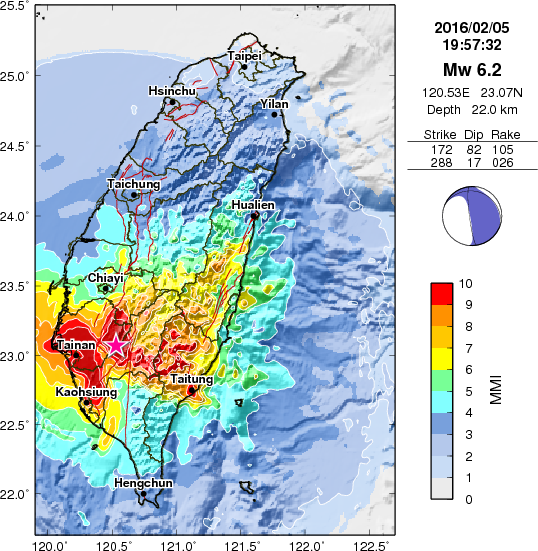
Here is a large scale (zoomed in) view of the region with the Modified Mercali Intensity (MMI) contours plotted. Find out more about the MMI scale here and here.
Here is a great general overview of the tectonics of the region from Shyu et al. (2005). I include their figure caption below the image as a blockquote.
A neotectonic snapshot of Taiwan and adjacent regions. (a) Taiwan is currently experiencing a double suturing. In the south the Luzon volcanic arc is colliding with the Hengchun forearc ridge, which is, in turn, colliding with the Eurasian continental margin. In the north both sutures are unstitching. Their disengagement is forming both the Okinawa Trough and the forearc basins of the Ryukyu arc. Thus, in the course of passing through the island, the roles of the volcanic arc and forearc ridge flip along with the flipping of the polarity of subduction. The three gray strips represent the three lithospheric pieces of Taiwan’s tandem suturing and disarticulation: the Eurasian continental margin, the continental sliver, and the Luzon arc. Black arrows indicate the suturing and disarticulation. This concept is discussed in detail by Shyu et al. [2005]. Current velocity vector of the Philippine Sea plate relative to the Eurasian plate is adapted from Yu et al. [1997, 1999]. Current velocity vector of the Ryukyu arc is adapted from Lallemand and Liu [1998]. Black dashed lines are the northern and western limits of the Wadati-Benioff zone of the two subducting systems, taken from the seismicity database of the Central Weather Bureau, Taiwan. DF, deformation front; LCS, Lishan-Chaochou suture; LVS, Longitudinal Valley suture; WF, Western Foothills; CeR, Central Range; CoR, Coastal Range; HP, Hengchun Peninsula. (b) Major tectonic elements around Taiwan. Active structures identified in this study are shown in red. Major inactive faults that form the boundaries of tectonic elements are shown in black: 1, Chiuchih fault; 2, Lishan fault; 3, Laonung fault; 4, Chukou fault. Selected GPS vectors relative to the stable Eurasian continental shelf are adapted from Yu et al. [1997]. A,Western Foothills; B, Hsueshan Range; C, Central Range and Hengchun Peninsula; D, Coastal Range; E, westernmost Ryukyu arc; F, Yaeyama forearc ridge; G, northernmost Luzon arc; H, western Taiwan coastal plains; I, Lanyang Plain; J, Pingtung Plain; K, Longitudinal Valley; L, submarine Hengchun Ridge; M, Ryukyu forearc basins.
This figure from Shyu et al. (2005) shows their interpretation of the different tectonic domains in Taiwan. This is a complicated region that includes collision zones in different orientations as the Okinawa Trough, Ryukyu Trench, and Manila Trench (all subduction zones) each intersect beneath and adjacent to Taiwan. I include their figure caption below the image as a blockquote.
Map of major active faults and folds of Taiwan (in red) showing that the two sutures are producing separate western and eastern neotectonic belts. Each collision belt matures and then decays progressively from south to north. This occurs in discrete steps, manifested as seven distinct neotectonic domains along the western belt and four along the eastern. A distinctive assemblage of active structures defines each domain. For example, two principal structures dominate the Taichung Domain. Rupture in 1999 of one of these, the Chelungpu fault, caused the disastrous Chi-Chi earthquake. The Lishan fault (dashed black line) is the suture between forearc ridge and continental margin. Thick light green and pink lines are boundaries of domains.
This map from Shyu et al. (2005) shows the earthquake slip regions for proposed earthquake scenarios. I include their figure caption below the image as a blockquote.
Proposed major sources for future large earthquakes in and around Taiwan. Thick red lines are proposed future ruptures, and the white patches are rupture planes projected to the surface. Here we have selected only a few representative scenarios from Table 1. Earthquake magnitude of each scenario is predicted value from our calculation.
Here is Table 1 from Shyu et al. (2005).
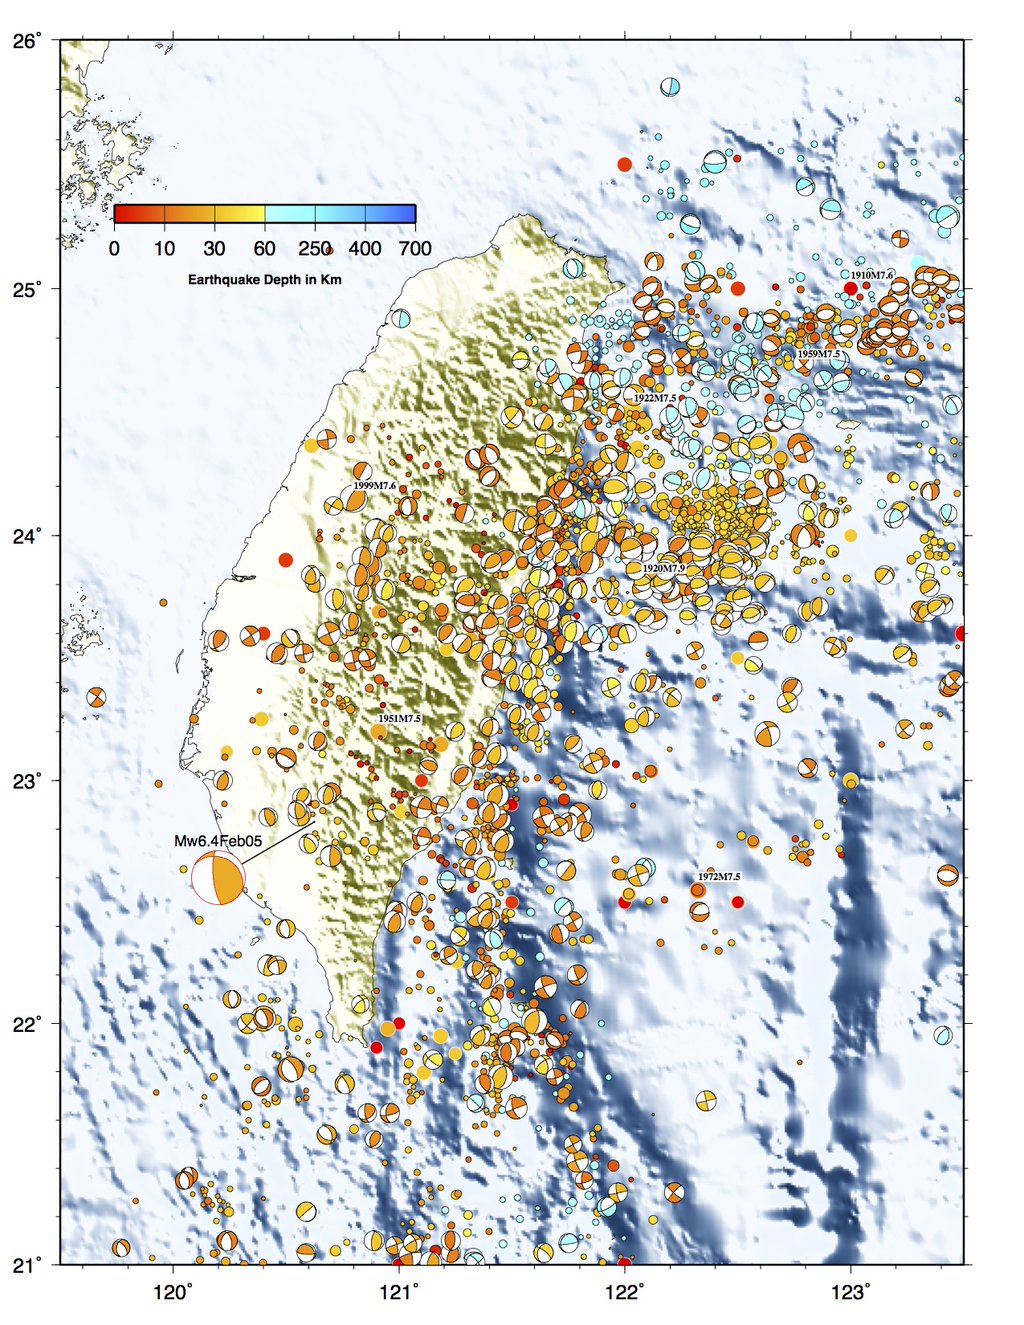
Here is a map from Jascha Polet, Seismologist at Cal Poly Pomona. Dr. Polet plotted focal mechanism from historic earthquakes from this region, with the M 6.4 earthquake enlarged. These focal mechanisms are colored for depth. More on focal mechanisms is presented on my initial Earthquake Report here.
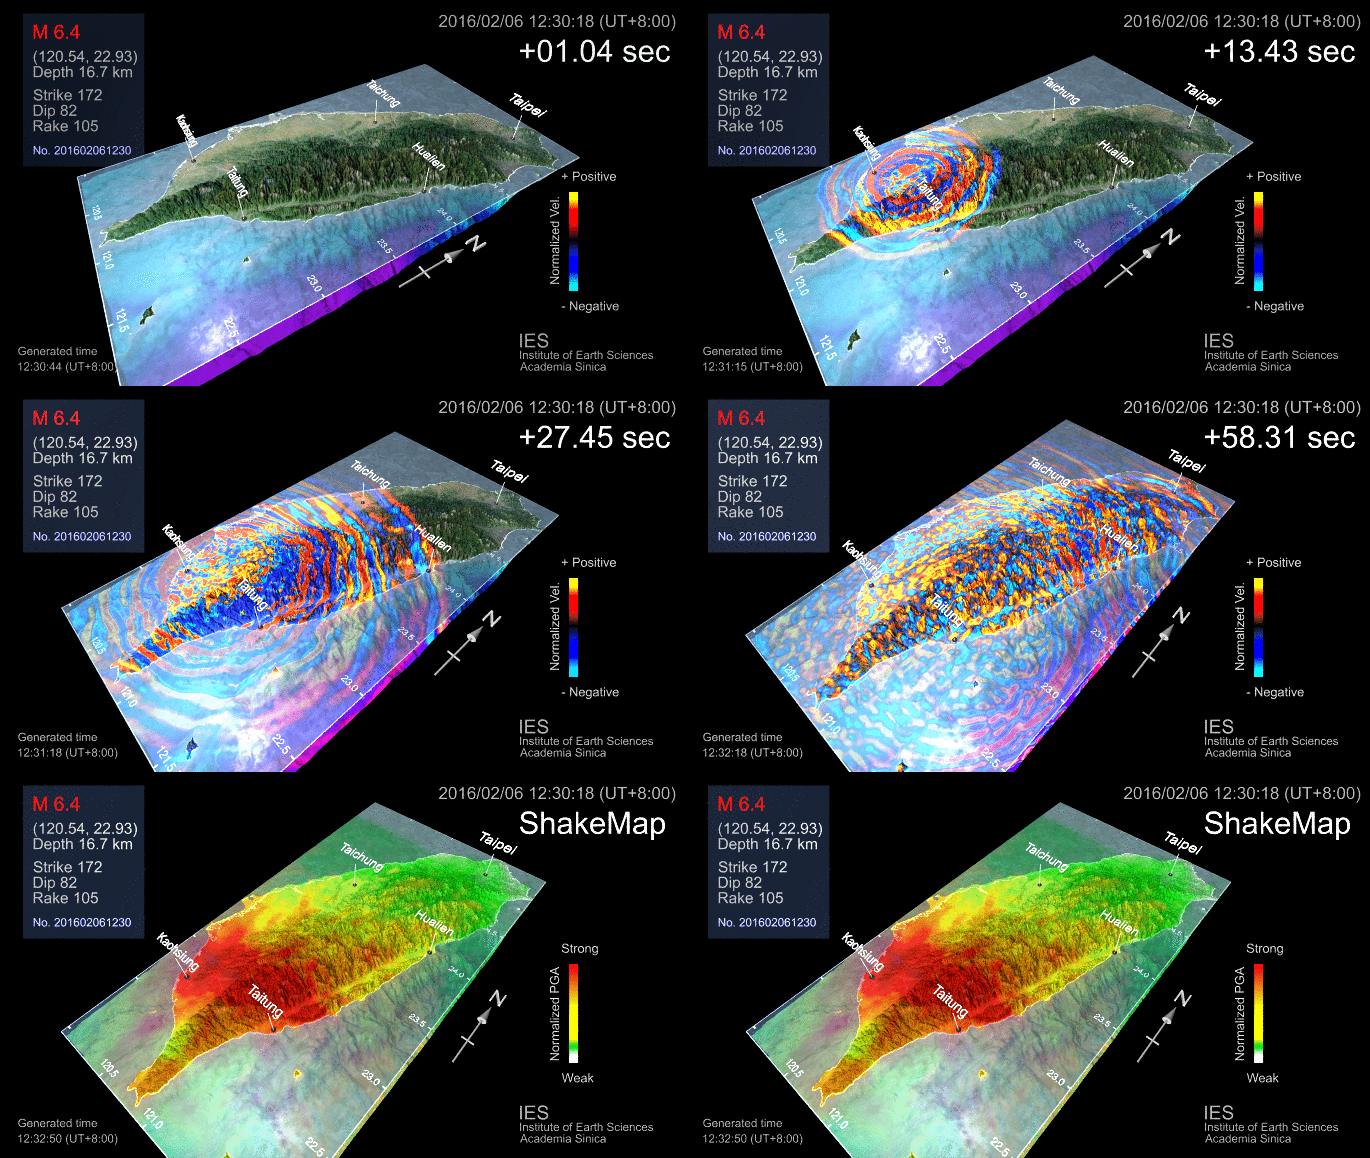
The Institute of Earth Sciences, Academia Sinica, has produced some excellent visualizations from this devastating earthquake. Below are a series of their visualizations.
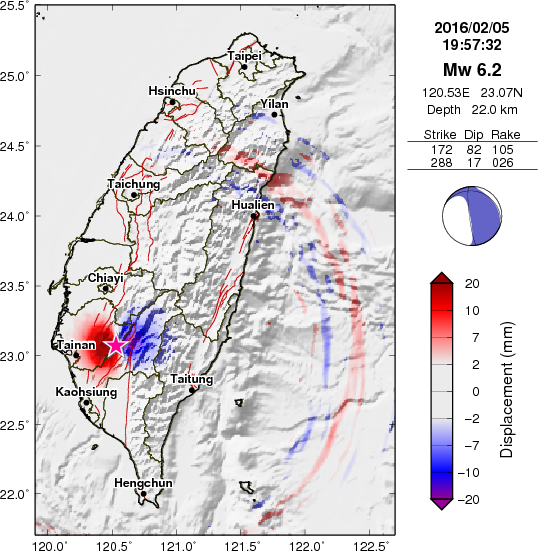
This map shows their estimate of deformation due to displacement on the fault that ruptured during this earthquake. This is not a measurement of vertical deformation, but a numerical model.
This map shows their modeled estimates for ground shaking using the Modified Mercalli Intensity Scale. More on the MMI can be found here.
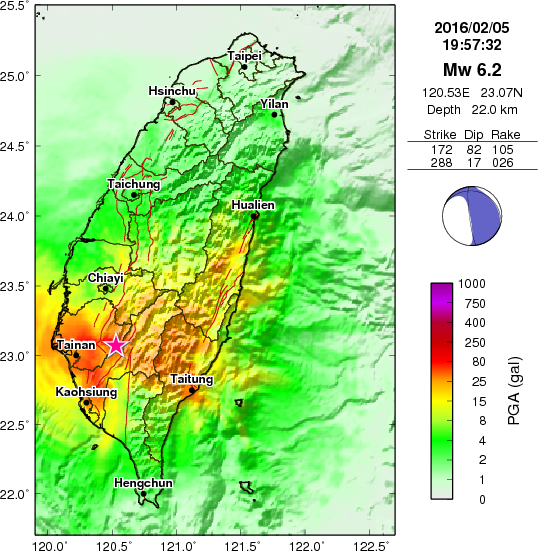
Another measure of the effects from an earthquake is a quantification of Peak Ground Acceleration (PGA). This refers to the maximum accelerations possibly felt at the ground surface due to shaking from the earthquake. PGA is measured in units of gravity (g) where 1 g (gal) = acceleration of gravity at sea level. While gravity varies spatially, so is generally not this value at sea level, is defined to be 9.8 m/sec^2. In the figure below, 1000 = 1 g.
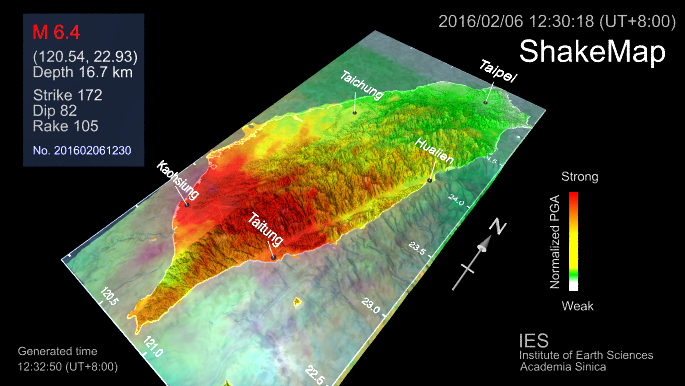
Here is a cool low angle oblique version of the MMI shake map.
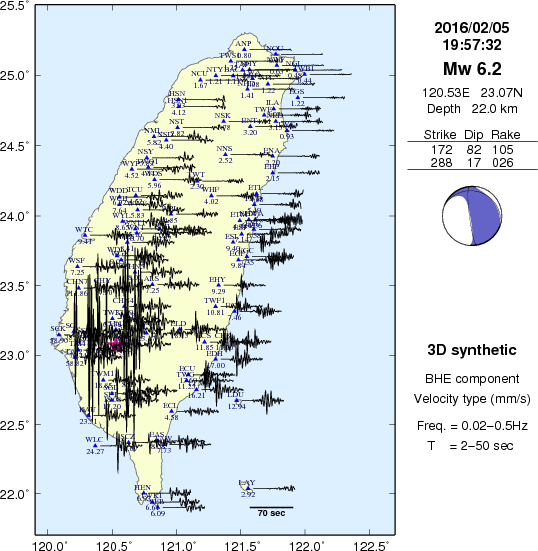
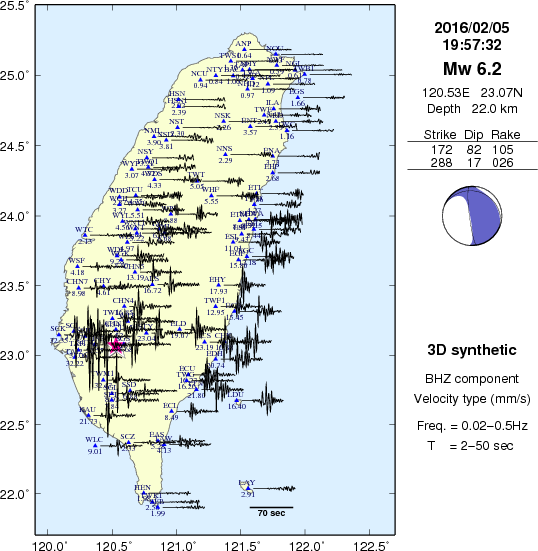
The following three images show the east, north, and vertical components of motion measured on seismopraphs in Taiwan.
And, my favorite, shows the seismic waves propagating across the landscape.
-
Here is a video showing observations of the ground shaking, posted to yt here.
- Here is a link to the mp4 file embedded below (6.5 MB mp4)
-
Here are two videos from drone footage of the large building collapse. These were captured from news feeds on twitter. [source]
- Here is a link to the mp4 file embedded below (0.3 MB mp4)
- Here is a link to the mp4 file embedded below (0.3 MB mp4)
-
Finally, here is some drone footage of a lateral spread (a type of landslide) triggered by the earthquake (rather, the ground shaking from the earthquake). [source]
- Here is a link to the mp4 file embedded below (0.3 MB mp4)
-
Here is a visualization of the seismic waves propagating through USArray seismometers in the USA. [source] Above is a screenshot:
- Here is a link to the mp4 file embedded below (66 MB mp4)
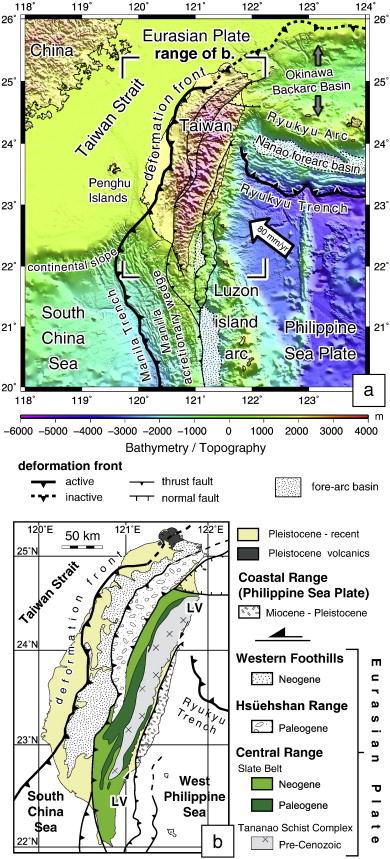
This map from here shows the basement geology of Taiwan. Note the accretionary belts, including the forearc basin. This is a compilation from Teng et al. (2001) and Hsiao et al. (1998) as presented in Ustaszewski et al. (2012).
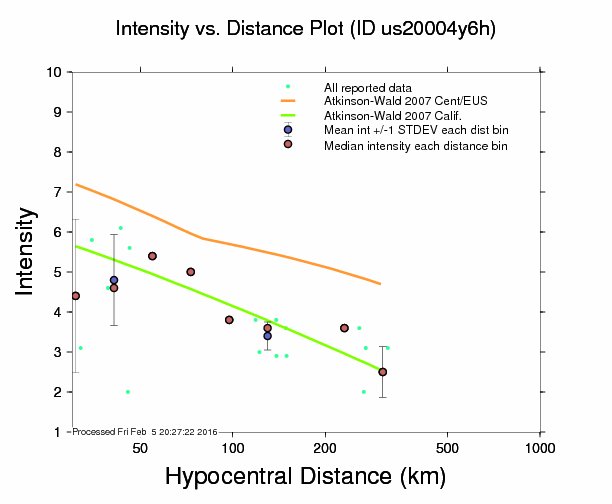
This shows how as additional DYFI reports were submitted, there were more reports from further distances. The upper image was acquired yesterday morning (Pacific Time) and the lower image was acquired last night (Pacific Time).
- Shyu, J. B. H., K. Sieh, Y.-G. Chen, and C.-S. Liu, 2005. Neotectonic architecture of Taiwan and its implications for future large earthquakes in J. Geophys. Res., 110, B08402, doi:10.1029/2004JB003251.
- Ustaszewski, K., Wu, Y-M., Suppe, J., Huang, H-H., Chang, C-H., and Carena, S., 2012. Crust–mantle boundaries in the Taiwan–Luzon arc-continent collision system determined from local earthquake tomography and 1D models: Implications for the mode of subduction polarity reversal in Tectonophysics, v. 578, p. 31-49.
References:

.jpg)