There have been several data updates following the earthquake yesterday. I presented my first summary about this M = 7.5 earthquake here. There are a number of sources of information regarding the casualties from this devastating earthquake posted on this Earthquake Engineering Research Institute page..
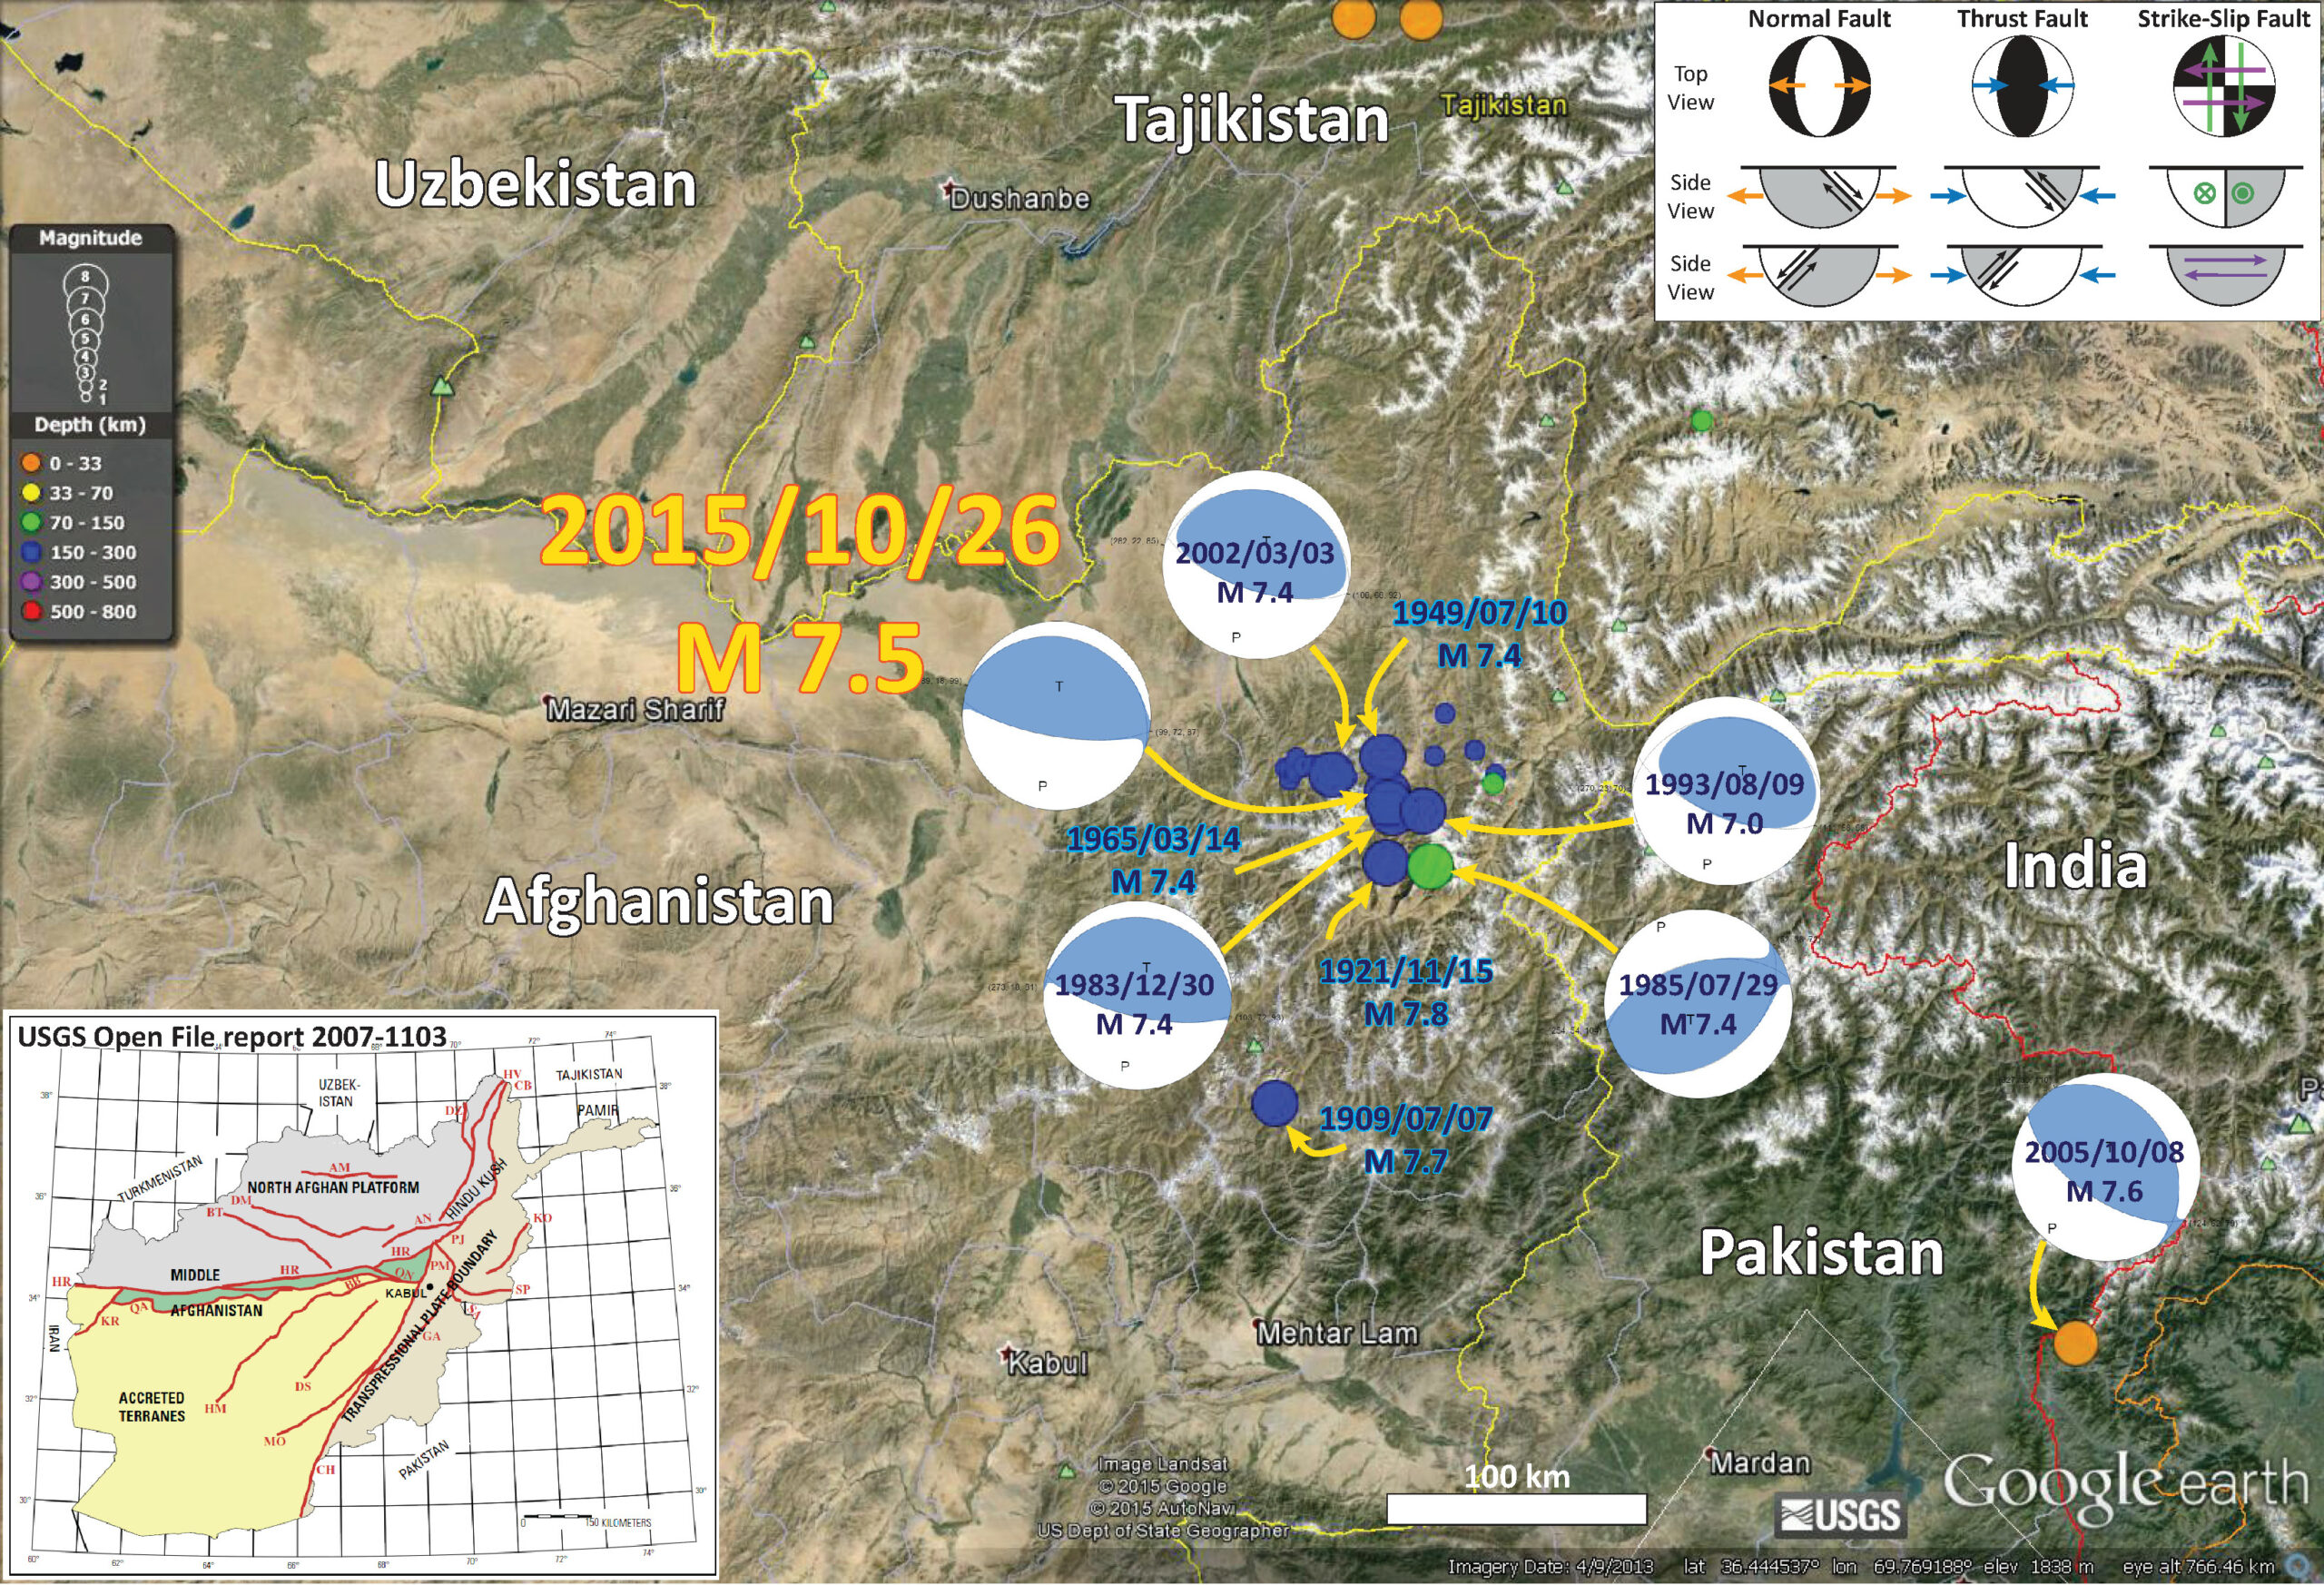
Here is a map that shows the earthquakes with magnitudes greater than or equal to M = 7.0. I plotted the USGS moment tensors for earthquakes that have them. I include a USGS Open File Report 1103 map of the tectonic domains of Afghanistan. Note that there have been 8 earthquakes in this magnitude range in the past ~20 years, so these happen about every 12 years or so.
-
Here are links to the USGS web pages for each of the earthquakes labeled in the below map:
- 1909/07/07 M 7.7
- 1921/11/15 M 7.8
- 1949/07/10 M 7.5
- 1965/03/14 M 7.4
- 1983/12/30 M 7.4
- 1985/07/29 M 7.4
- 1993/08/09 M 7.0
- 2002/03/03 M 7.4
- 2005/10/08 M 7.6
- 2015/10/26 M 7.5

IRIS has put together a teachable moment here. In addition, there are a number of visualizations and sources of data on their “spud” page here. I embed some of the videos below.
These first two animations show how seismic waves propagate through the USArray, a network of seismometers. The first animation shows the vertical motion in color (red = up & blue = down) and the horizontal motion as a vector. Above each animation is a screenshot.

Here is a link to the embedded video below.

Here is a link to the embedded video below.
Here is a visualization of the sesimic waves propagating from the source area. This animation comes from Princeton. Above the animation is a screenshot.

Here is a link to the embedded video below.
This animation shows the epicenters for various earthquakes related to this M 7.5 earthquake.
This animation shows the slip along the fault through time.
IRIS also has an earthquake browser. Here is a map for this region from that browser. Check out the browser here.

Pavlis and Das (2000) proposed an hypothsis to explain the pattern if intermediate-depth earthquakes in the Pamir-Hindu-Kush region. They suggest that there is a slab of oceanic crust that has separated from the downgoing India plate. This slab is neutrally bouyant and “hangs out” in the mantle. They suggest this slab is acting as a strain marker. I provide a link to their paper below.
Here is their figure showing the slab at different time intervals. I include their figure caption as a blockquote.

Tectonic models that have been proposed for the Pamir-Hindu Kush region. (a) A cartoon of the double-facing subduction zone. (b) The comparable diagram showing the geometry of a bent, overturned slab. Figure la and lb illustrate this three-dimensional geometry using a map view projection that can be thought of as being sliced off at two depths:( 1) the shaded region marks a slice at the approximate depth of the top of the mantle earthquake zone around 70 km depth, and (2) the mixed solid and dashed lines (showing hidden surfaces) illustrate the piercing points of a slab at the approximate base of the activity around 200 km in depth. The double-facing model in Figure la implies downdip motion as illustrated by the arrows. In our model the slab has relatively small vertical motion emphasized by the lack of arrows in Figure lb. Patterned zone in Figure la illustrates the major shear zone required in this model within which we estimate high shear strain rates of the order of 10^-13 s^-1.
Sippl et al. (2013) have worked out some hypotheses about the tectonics of the region to explain the intermediate to deep seismicity. They used a two year period when they deployed seismometers in the region. They recorded and located 9,532 earthquakes. They found that seismicity forms an upper and a lower domain. The upper domain includes earthquakes that plot along a plane that dips sub-vertically. The lower domain is more complex, with several sub-parallel planes.
-
They propose two models
- Two-Sided subduction of Eurasian and Indian continental lithosphere
- A purely Eurasian source of lithosphere
Here is a map with seismicity plotted in plan view, in E-W cross sectional view, and in N-S cross sectional view. I include their figure caption below in a blockquote.

Overall distribution of seismicity in the study area from August 2008 to June 2010 in map view (plotted onto a topographic map) and as projection of all events onto a longitudinal and latitudinal plane. Dot sizes denote different earthquake magnitudes, and colors denote different depth levels (in the map view plot) and distance from the projection plane, respectively, as indicated in the color legends. Deeper events were plotted on top of shallower ones in the map view subplot, nearer events on top of farther ones in the projections. Boxes indicate the location and extent of the profiles shown in Figure 7; colors reflect a subdivision in western Hindu Kush (red), eastern Hindu Kush (blue), and Pamir (black), which is reflected in the colors in Figure 7. Lower right sub-figure shows the distribution of local magnitudes in our data set. A total of 9105 of the total number of 9532 earthquakes are shown here; the missing events are located north of the region shown in this plot.
Here are cross-sectional plots of sesimicity for the different swaths shown in the above map. I include their figure caption below in a blockquote.

Series of profile projections perpendicular to the strike of the structure outlined by intermediate-depth earthquakes in Pamir and Hindu Kush. Locations of the profiles are indicated in Figure 5. Average topography across the swath widths is shown on top of the profiles. Circles denote earthquakes relocated with the double-difference method; crosses are events where this relocation was not performed. Colors of earthquake markers refer to different structural units (red: western Hindu Kush, blue: eastern Hindu Kush, and black: Pamir) and are likewise indicated in Figure 5 [the above map].
Here is a conceptual model showing the Sippl et al. (2013) interpretation of plate configuration in this region. I include their figure caption below in a blockquote.

Schematic representation of the geometry outlined by the earthquake locations presented in this study. The Pamir seismic zone defines an arc which incrementally changes its dip direction from southward to eastward and its strike direction from east-west to north-south from east to west. Dashed line corresponds to the upper limit of intermediate-depth seismicity along strike. The Pamir’s dip angle stays constant along strike at depths shallower than 150 km. Southwest of the Pamir arc, clearly separated from it in terms of dip direction, is the Hindu Kush seismic zone, which strikes roughly east-west and generally dips nearly vertically northwards. A tendency toward a strike alignment with the western Pamir is discernible in its eastern part. Although significantly smaller in width, the Hindu Kush exhibits considerably more structural complexity than the Pamir, shown by its fragmentation in several (curvi)planar fragments.
Here is a video that shows the shaking and some damage…
Here are some additional visualizations of the seismic waves propagating through the USARRAY.
-
As above, there is a figure showing the preview above each embedded video. These are products of IRIS.
- This is the mp4 link to the embedded video below (8 MB mp4). This video shows the 3-dimensional visualization. The vector direction and length shows the magnitude and direction in the horizontal dimension. The color represents the magnitude and direction in the vertical dimension.
- This is the mp4 link to the embedded video below (8 MB mp4). This video shows the Z-dimensional visualization (vertical). The color represents the magnitude and direction in the vertical dimension.
- Pavis, G.L. and Das, S., 2000. The Pamir-Hindu Kush seismic zone as a strain marker for flow in the upper mantle in Tectonics, v. 19, no. 1, p. 103-115
- Ruleman, C.A., et al., 2007. Map and Database of Probably and Possible Quaternary Faults in Afghanistan, USGS Open File Report 2007-1103, 45 pp.
- Sippl, C., et al., 2013. Geometry of the Pamir-Hindu Kush intermediate-depth earthquake zone from local seismic data in J. Geophys. Res. Solid Earth, 118, 1438–1457, doi:10.1002/jgrb.50128.


-
References:
Nice post!