The aftershocks continue to light up the earthquake fault that is participating in the part of the three pronged swarm in this region, I mentioned earlier. Two deep swarm regions of compressional earthquakes in the north, with this strike slip swarm in the south. The earthquake magnitudes for the northernmost swarm peak out around M 5.0 and are pretty deep at ~95 km!
This map shows all three swarms with shaking intensity contours for the two mainshocks (M 7.1 thrust and M 7.6 strike slip).
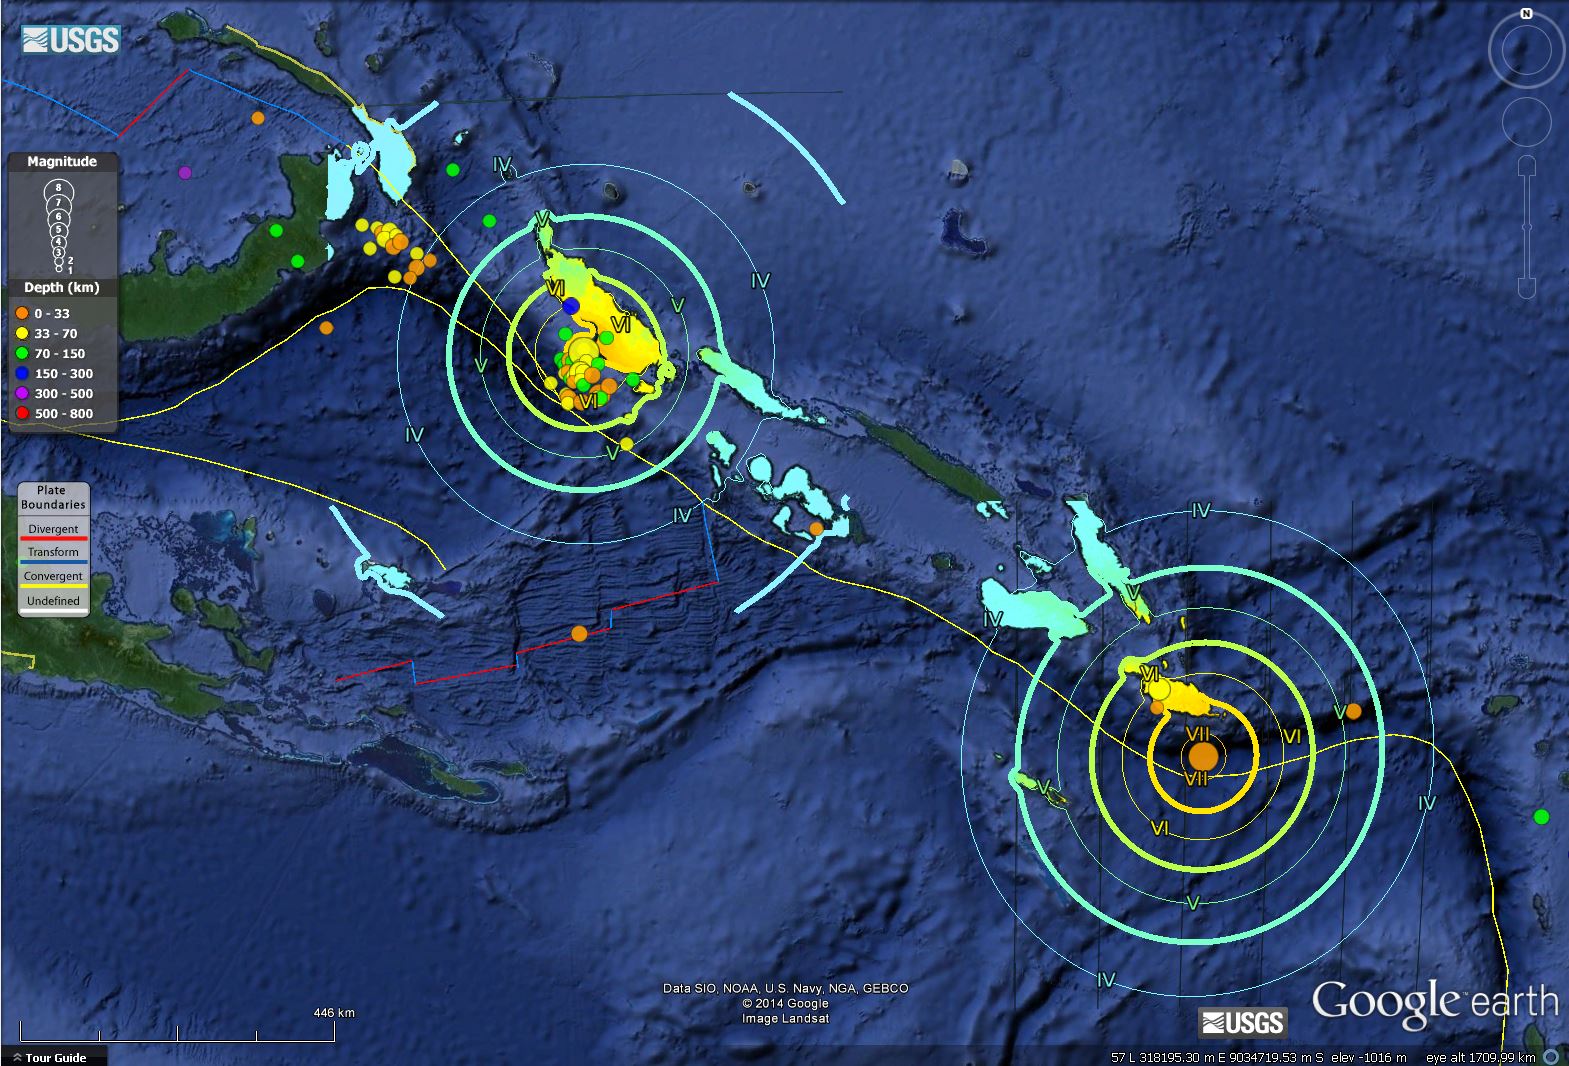
Here is an updated aftershock map.

This map shows where we might place the fault if it is oriented like the moment tensor is oriented.

Here is a little speculation… There are a few aftershocks that appear to align with the conjugate shear orientation (the second possible fault plane solution permitted with the moment tensor). Randomness is an equally valid interpretation for the spatial pattern of these aftershocks that may align with a possible fault conjugate to the mainshock fault. If these aftershocks are actually on a conjugate fault, then they would not be aftershocks, but triggered earthquakes.

Here is a map that shows the age of the oceanic crust in this region. The age contours (black lines) show the relative orientation of the spreading ridges from where the crust originated. I use a kmz file from here.

This is a larger scaled map that reveals hoe complicated the structure of the crust is in this region.

Here is a great gravity anomaly map for this region. Gravity lows are in blue and gravity highs are in red. Here is some background on this gravity anomaly map from UCSD.
SATELLITE DERIVED GRAVITY – Colors and 20 mGal contours on this overlay represent variations in the pull of gravity associated with variations in mass inside the earth or beneath the ocean. Normal gravity is 9.82 m/s**2. These variations mapped into color have a range that is 10,000 times smaller. Over the ocean the variations in gravity are measured by a radar altimeter in orbit. The radar measures variations in the height of the ocean surface relative to an ideal ellipsoidal shape. The similarity between the ocean anomalies and the Google Earth seafloor base layer is not an accident. In areas where no depth soundings are available, the seafloor depth is a scaled version of the gravity anomaly with a scale factor that varies with a number of parameters including sediment thickness and mean ocean depth. An overview of gravity and topography can be found at:
http://topex.ucsd.edu/sandwell/publications/119.pdf
A more detailed description of the gravity model can be found at:
http://topex.ucsd.edu/sandwell/publications/122_JGR_gravity.pdf

DATA SOURCES – source of ocean data:
http://topex.ucsd.edu/WWW_html/mar_grav.html
source of land data:
http://earth-info.nga.mil/GandG/wgs84/gravitymod/egm2008/anomalies_dov.html .
GRAPHICS – Generic Mapping Tools (GMT) was used to generate the colored contour maps for direct input into Google Earth
http://gmt.soest.hawaii.edu/
COMMENTS – David T. Sandwell, dsandwell@ucsd.edu.
2 thoughts on “Solomon M 7.6 aftershocks”