Interesting little swarm here, on the coast of northwestern Vancouver Island. The convergence of these plates results in the Cascadia subduction zone (CSZ), that extends from Cape Mendocino in the South to at least Haida Gwaii in the North (there was a small subduction zone earthquake swarm there in 2013).
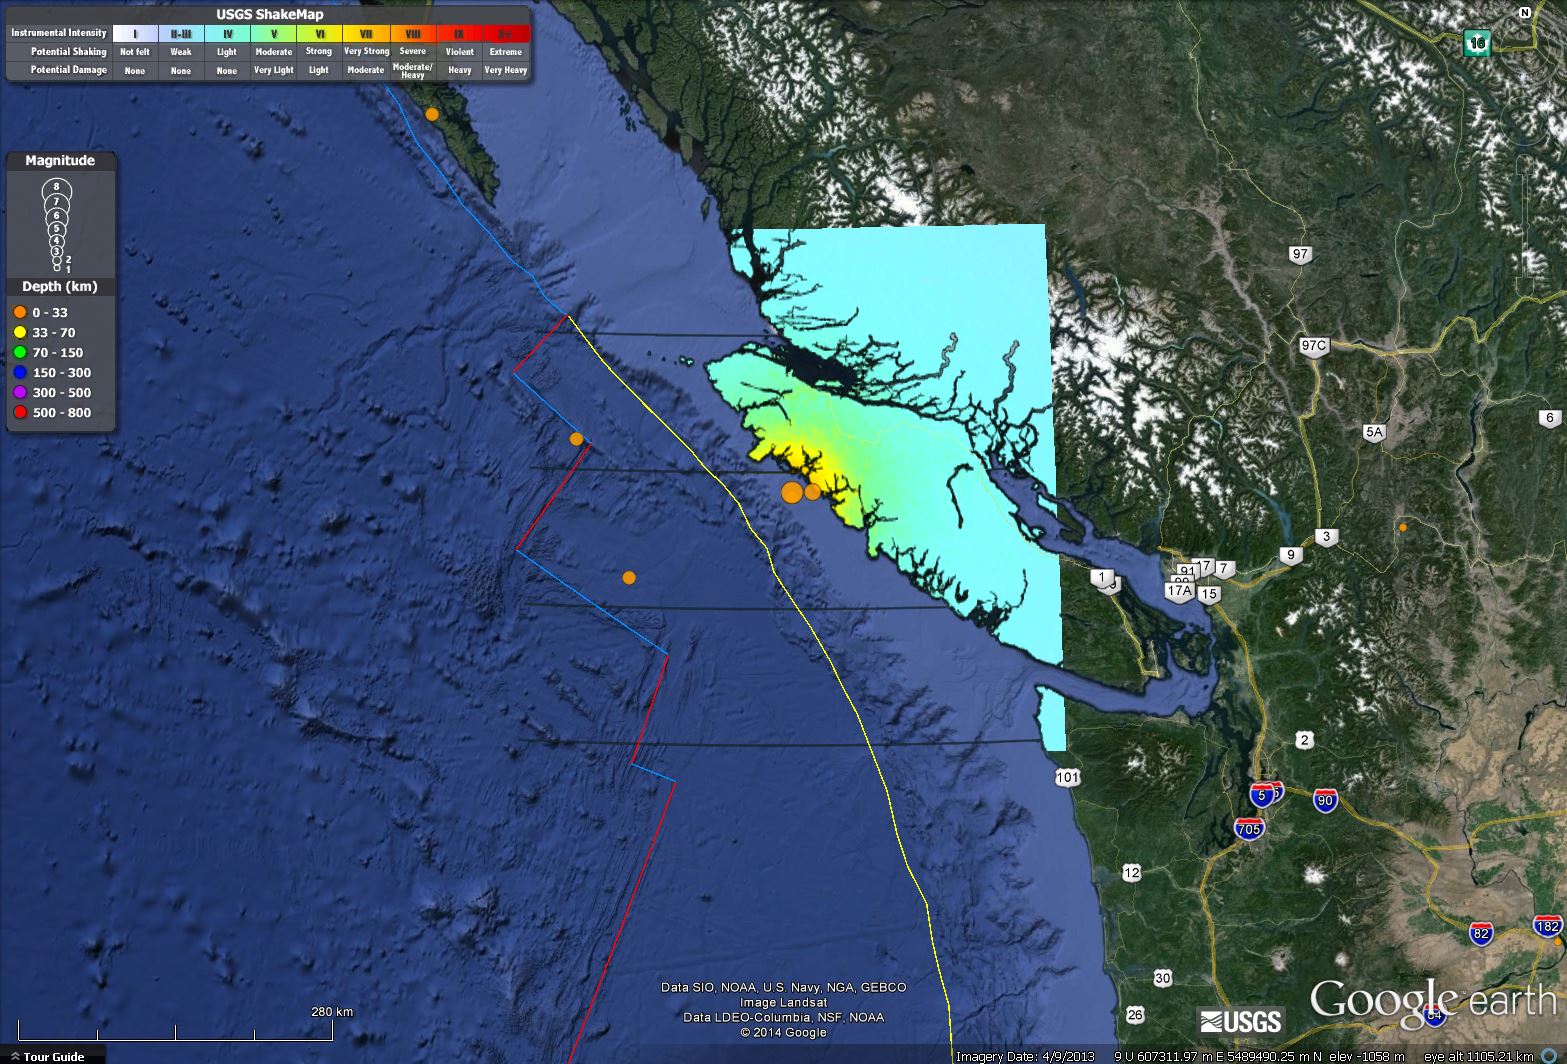
Here is a map that shows the CSZ (plotted as yellow), along with the MMI USGS ShakeMap for the M 6.6 earthquake.

This map shows some historic earthquake epicenters. Note how they align with some plate boundaries (e.g. the Blanco fracture zone, the transform plate boundary plotted as a west-northwest oriented blue line) and in some deformation zones (e.g. the Mendocino deformation zone that extends into the Gorda plate in the south).

The depth of the magnitude M 6.6 earthquake seems to align roughly with where we would expect the subduction zone fault. Today’s magnitude M 6.6 earthquake has a strike slip moment tensor.

Here is a regional view of the shaking intensity from the M 6.6 earthquake.
This map shows the results of the USGS Did You Feel It Program (that was initiated because of the work of Bob McPherson and Lori Dengler).

This shows the attenuation of shaking intensity with distance from the earthquake. Ground Motion Prediction Equations (attenuation relations) have been developed using thousands of ground motion measurements from earthquakes. As time passes, we get more earthquakes and we get more records. With the larger sized databases, the relations between shaking intensity and distance can be perfected for different fault settings, different site settings, and different earthquake magnitudes. Each of these factors can contribute to how the shaking from any given earthquakes is felt.

The estimated losses for this M 6.6 Vancouver Island earthquake are fairly low. Note the Green Designation.

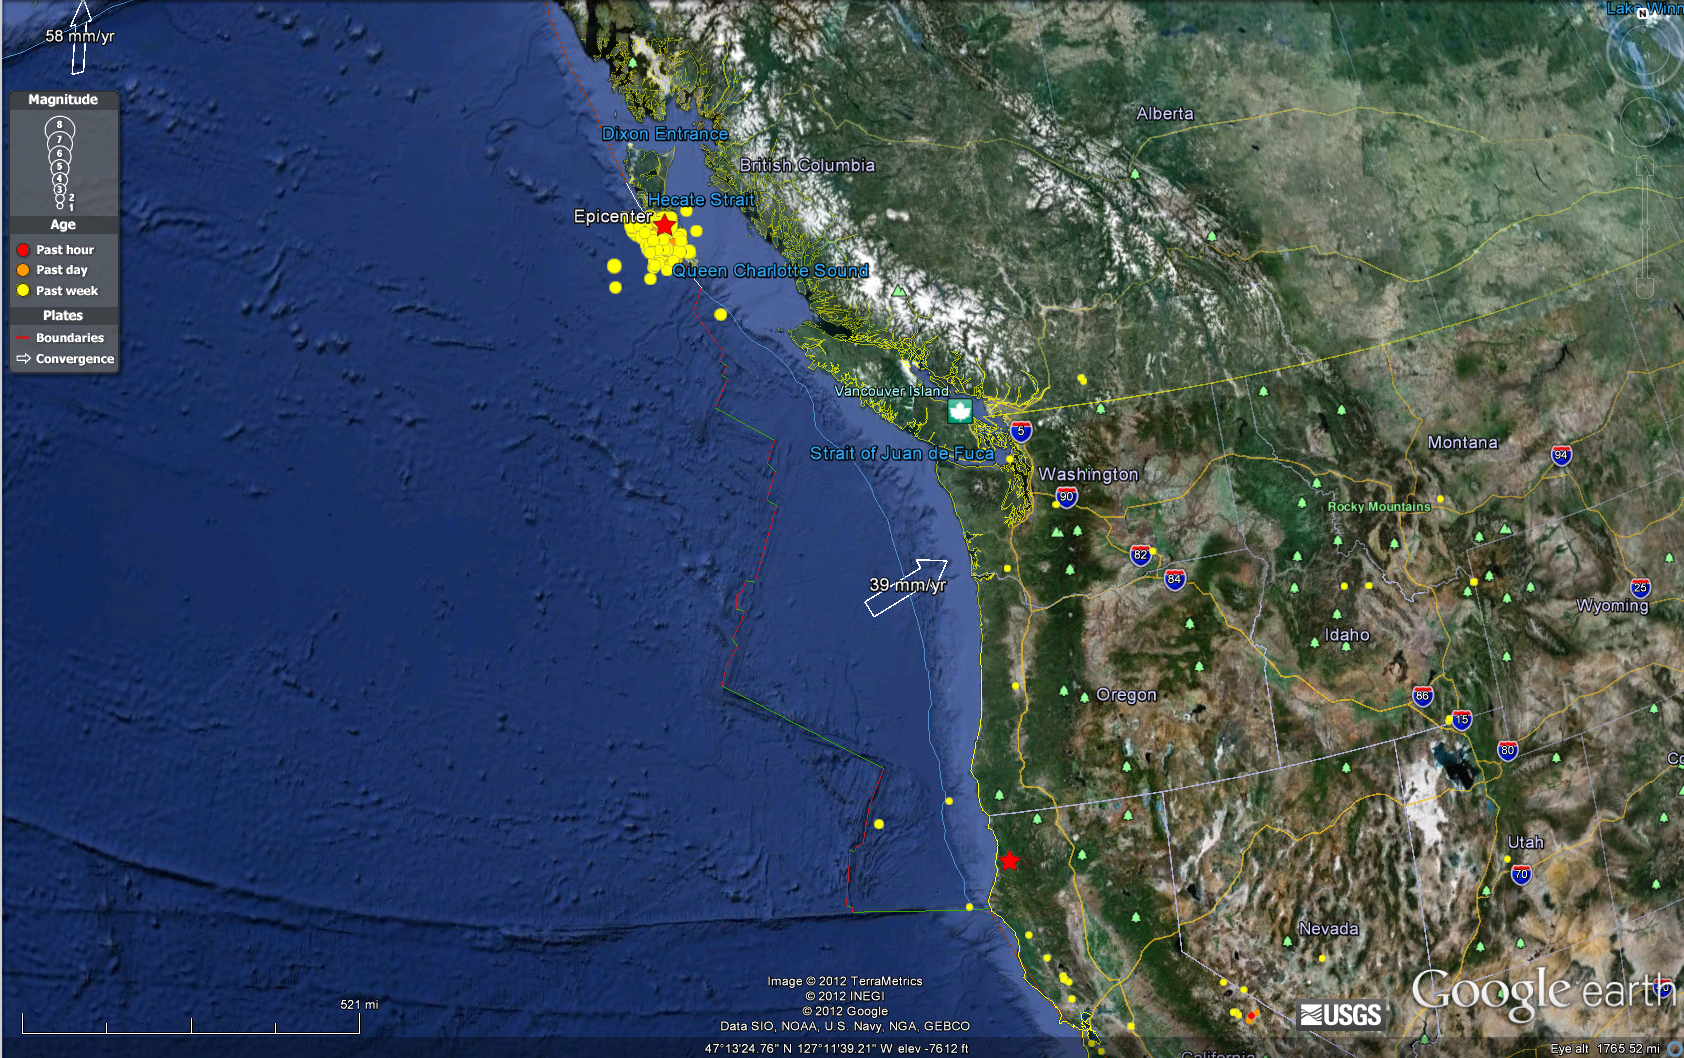
This regional map shows today’s M 6.6 swarm as it relates to the Haida Gwaii earthquake along the Queen Charlotte plate boundary system to the northwest of Vancouver Island.

Here is the moment tensor from the M 7.7 subduction zone earthquake in Haida Gwaii on 10/28/2012

Here is a map that shows the M 7.7 earthquake swarm using a global scale.
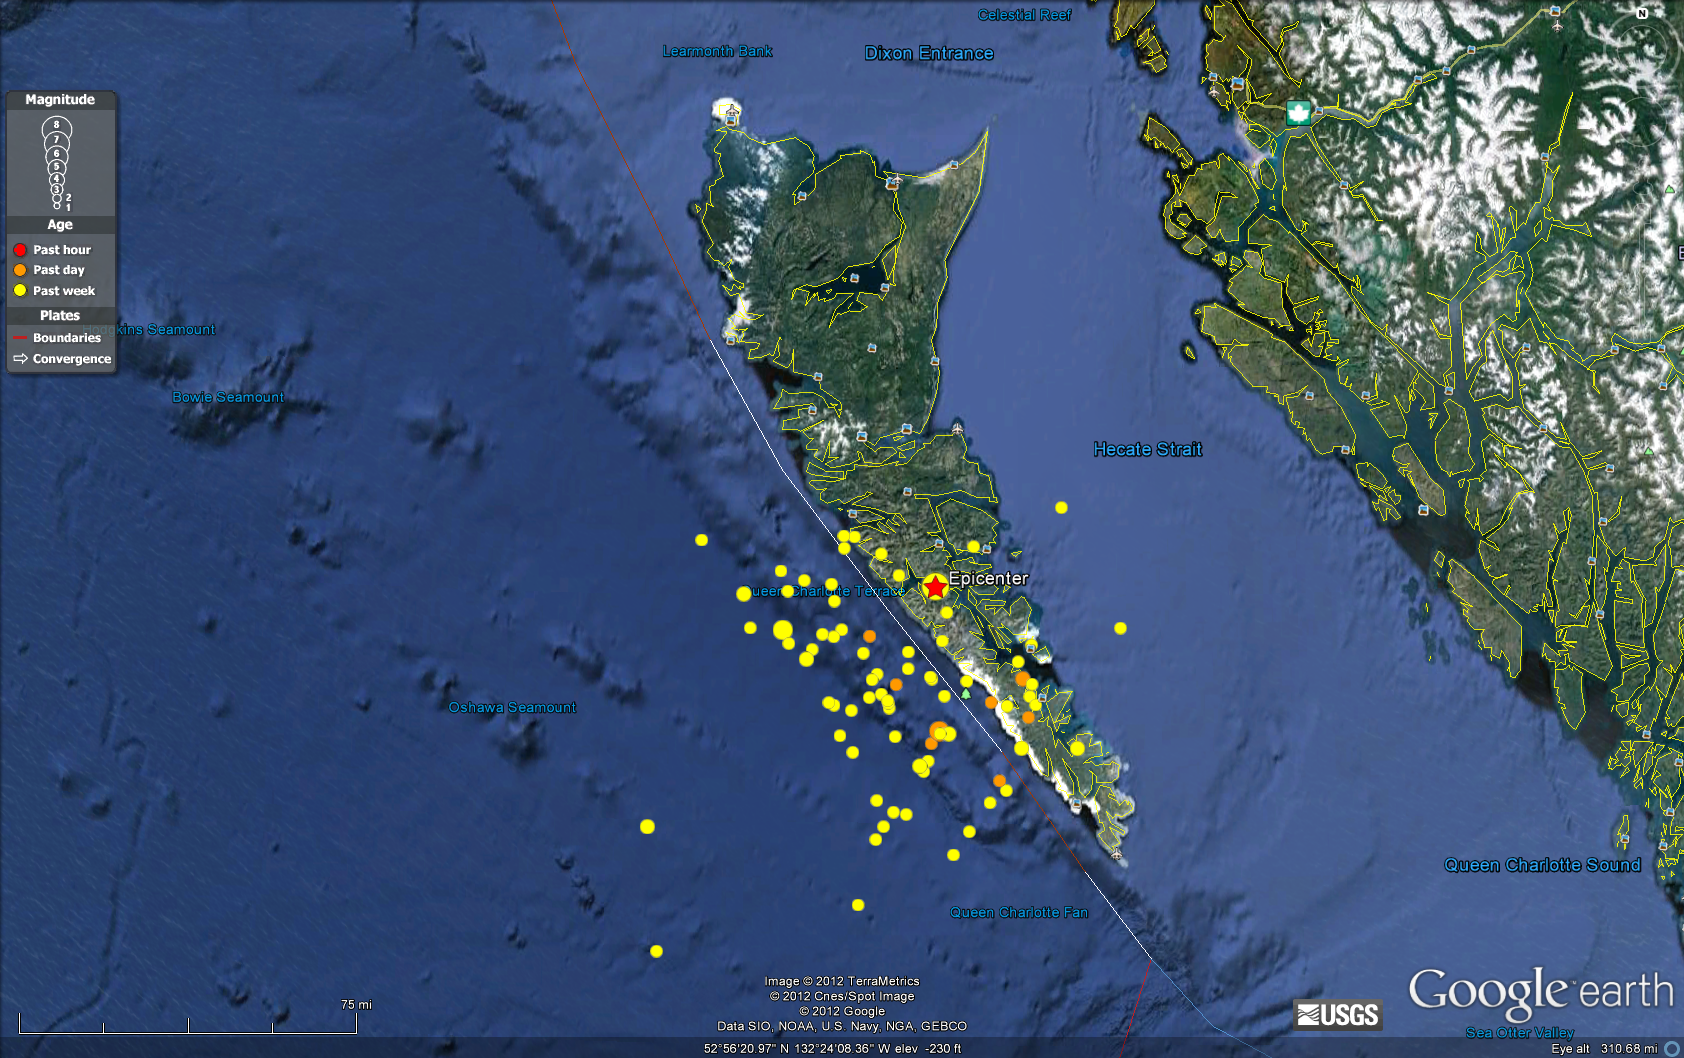
This is a map of the Haida Gwaii swarm. Note how the main shock is plotted east of the mapped fault. One may also observe an accretionary prism that is probably related to subduction along this plate boundary. The fault line should really be mapped to the west of where it is drawn here. This fault system has alternately been interpreted as a strike-slip (or transform) plate boundary. If we consider the obliquity of subduction, the strike-slip faulting (aka Queen Charlotte – Fairweather fault system) is possibly a sliver fault (like the Sumatra fault). Also, note that some of the smaller aftershocks appear to align on north-northeast oriented patterns. Perhaps these are northeast striking strike slip faults (or normal faults formed at the spreading ridge, reactivated with strike slip motion) triggered by the subduction zone earthquake.
- The M 7.7 earthquake generated a tsunami. Here is a map showing some model estimates of trans Pacific tsunami heights.
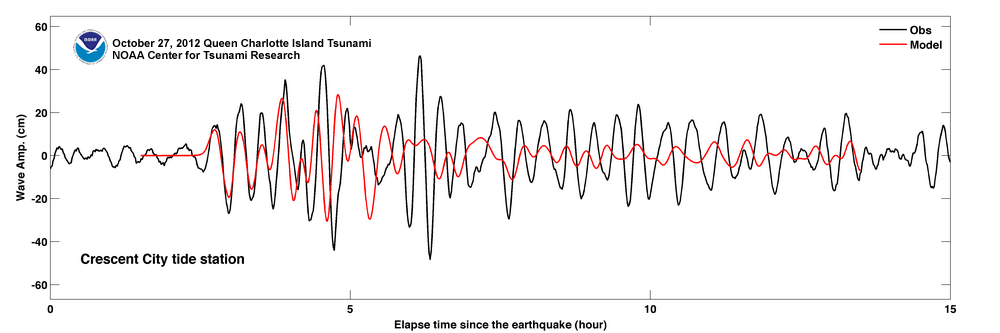
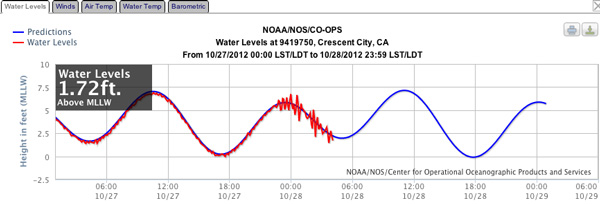
- Here are two plots of the tsunami record as measured in Crescent City.
- This first plot shows the modeled wave height compared to the measured wave height.
- This plot shows the measurement of the tsunami plotted on top of the tidal water surface elevation.

The USGS put together this poster to help explain their interpretations of the M 7.7 Haida Gwaii earthquake swarm.

1 thought on “Vancouver Isle M 6.6 Earthquake”