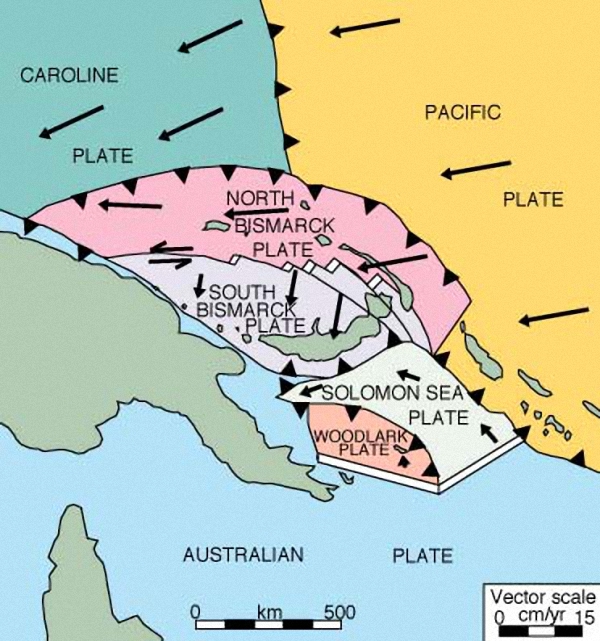
This looks to have shaken people up, just by looking at the intensity map below. These are generated automatically and take some assumptions that simplify the results (so the real shaking is probably not what the shake map intensity maps show). In this region of the Solomon Sea, there is a subduction zone fault that dives to the north beneath Bouganville Island, forming the New Britain trench. The Solomon or Woodlark sub plate is subducting to the north, beneath the Bismark sub-plate, as shown in a map from Greg Corbett.
There probably was a local tsunami, but the magnitude and location are too distant to pose a tsunami hazard in northern California (especially with the configuration of the islands in this region). In 1998, ~1,500 km to the west, there was a landslide triggered by an earthquake that generated a large tsunami.
Here is the USGS website for this earthquake.
This is an early moment tensor, which shows a pure compressional mechanism.
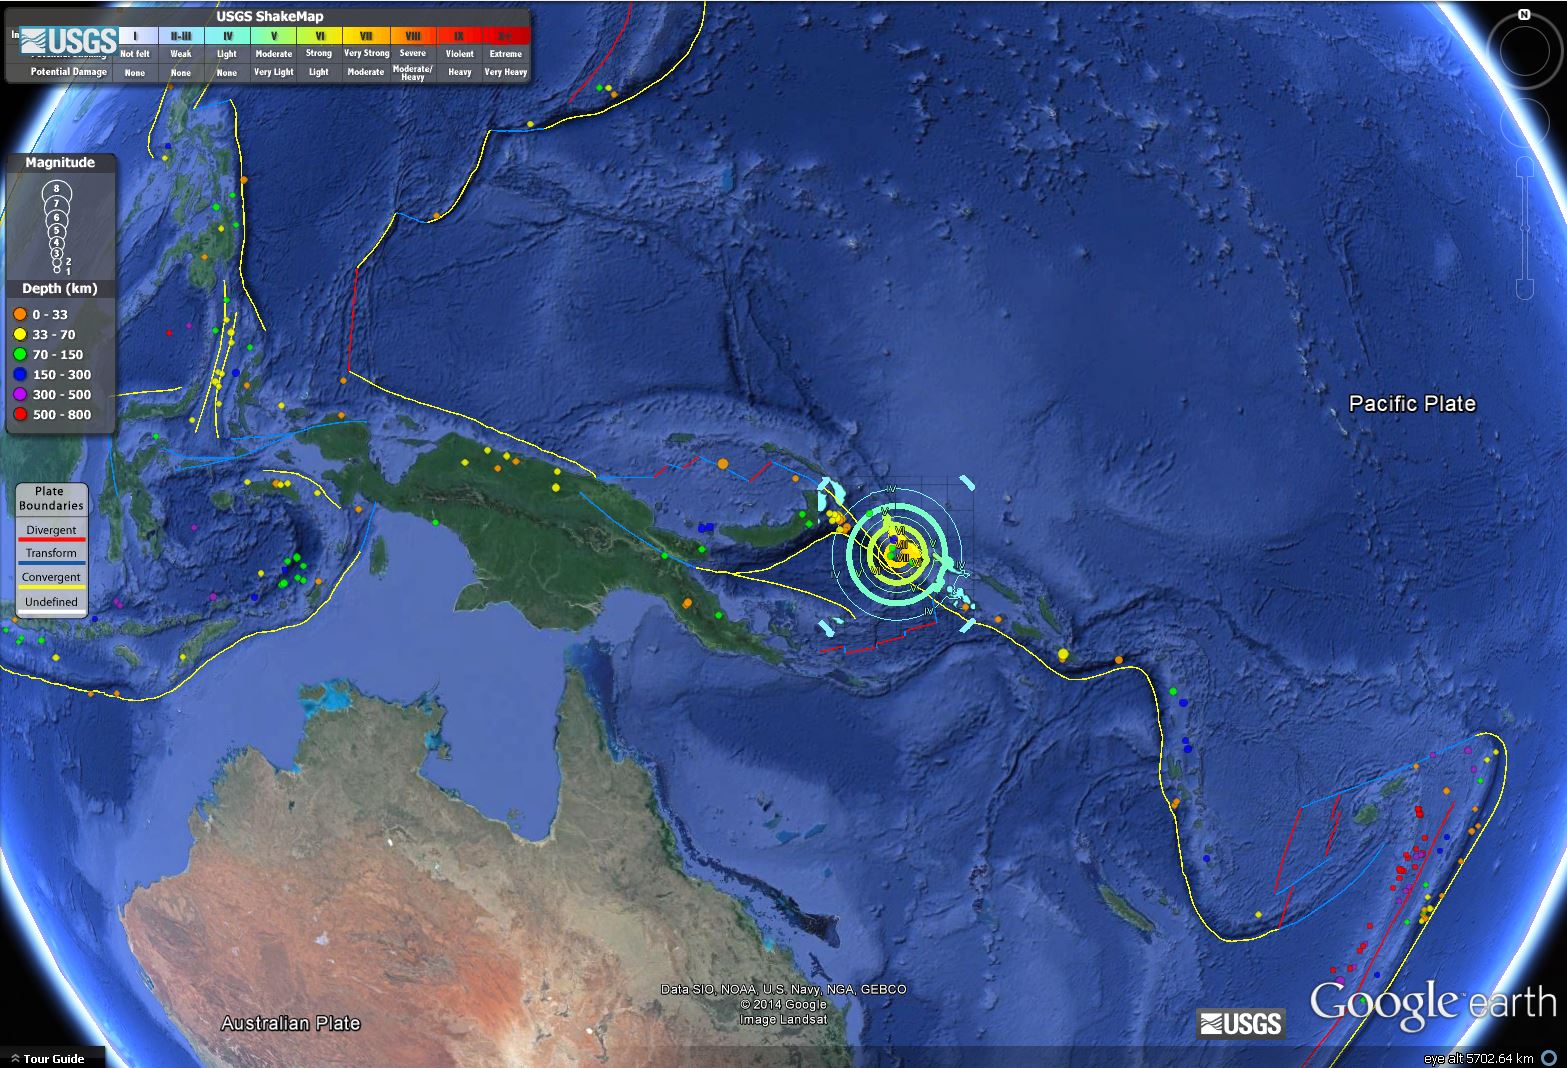
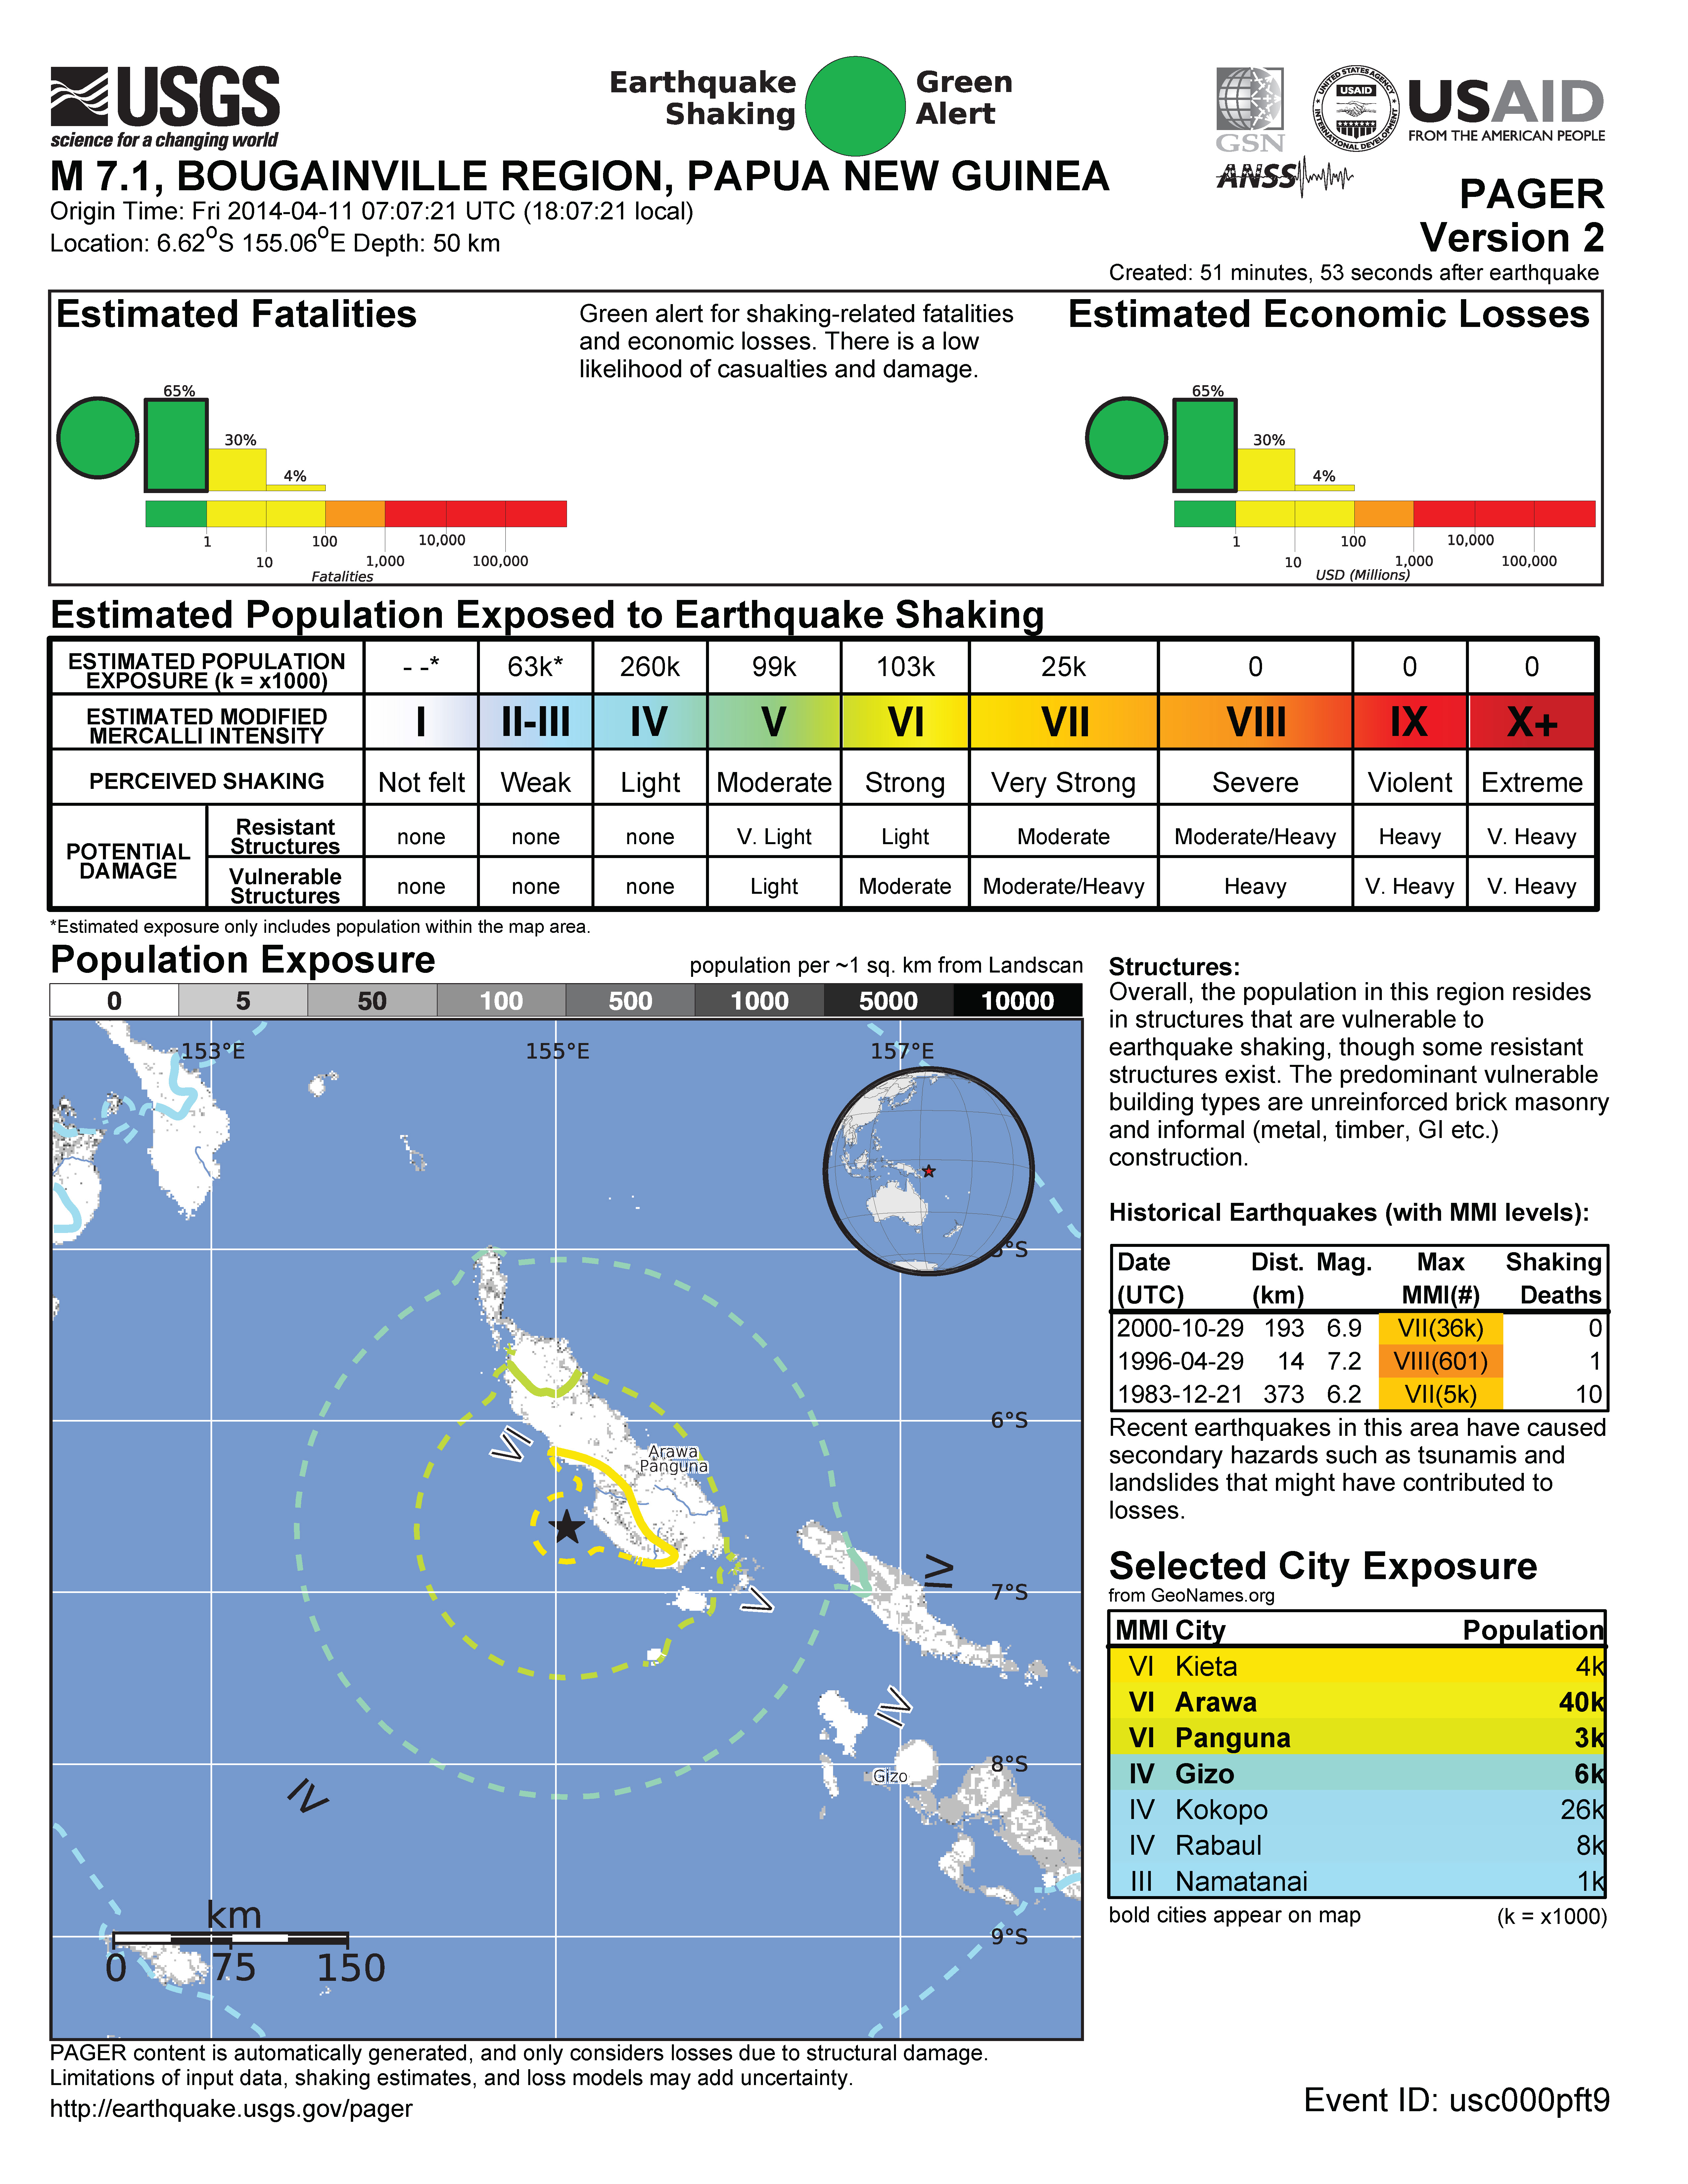
This shows the earthquake as it relates to the regional plate boundaries, islands, and Australia. Shaking intensity uses the Modified Mercalli Intensity (MMI) scale.
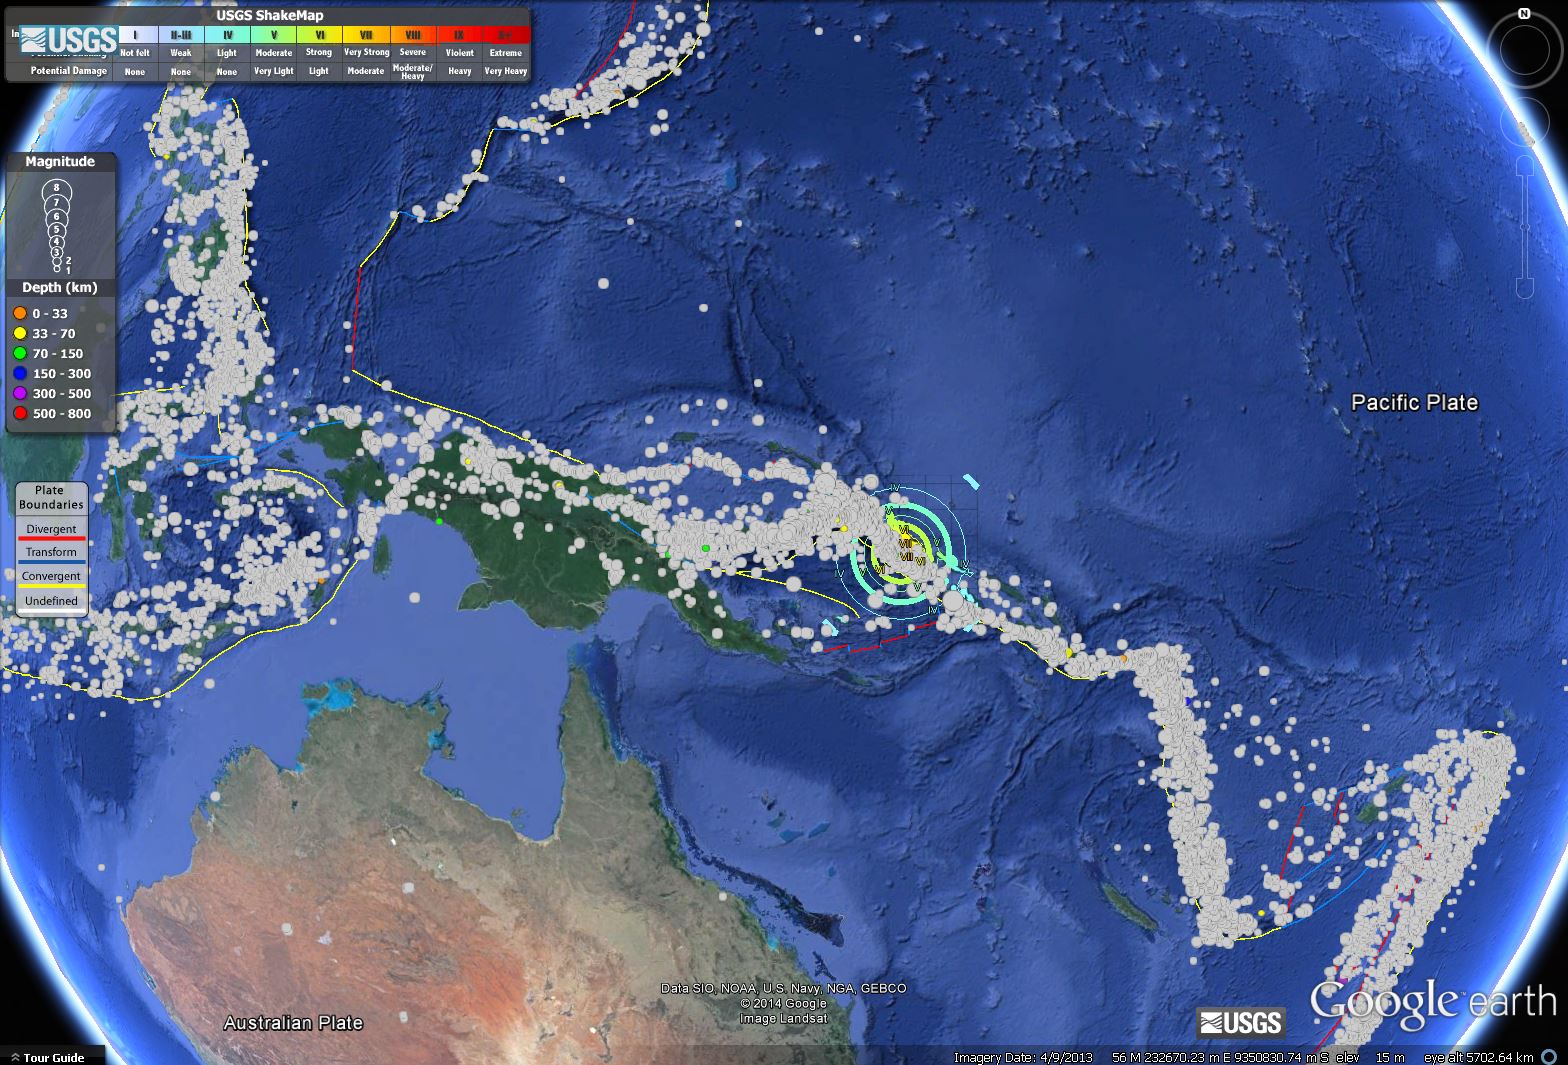
This shows some historic earthquakes as grey circles. Note how they align with the plate boundaries.
Here is a regional view of the islands, the epicenter, and the shaking intensity:
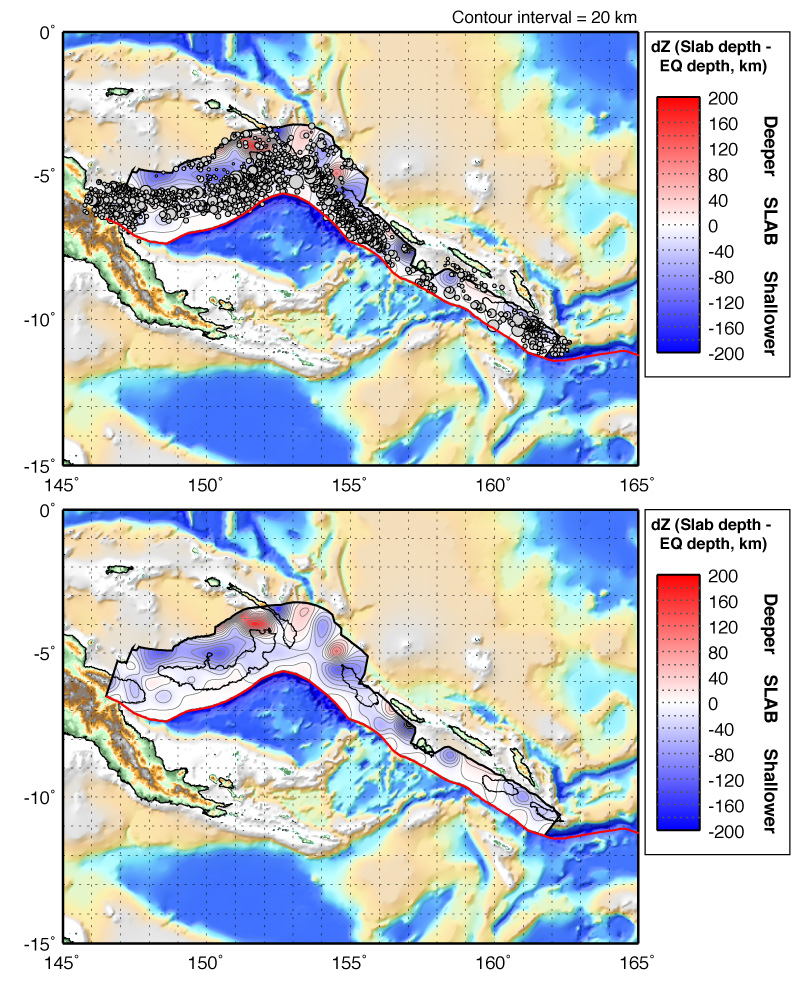
This regional scale map shows the subduction zone fault depth contours as modeled by Dr. Gavin Hayes, from the USGS. Hayes and his colleagues used earthquake hypocentral depths to constrain the position of the subduction zone fault. The hypocenter is listed at 50 km deep, which places it well beneath the known location for the main subduction zone fault here, but there may be some complications with the plate boundaries here. The megathrust is only ~30 km in this epicentral location.

This is the Hayes map for this region.
Here is a great map that was posted to a blog. The blogger did not give credit to the person who made the map, but i found it used in this presentation prepared by IRIS (they gave proper credit).
This is the PAGER earthquake shaking and loss estimate page for this earthquake. This earthquake gets a “green” alert. The estimated fatalities and economic losses are low, but not zero. Here is a web page with some information about how these estimates are made.
This is a map from Australian National University showing GPS rates in the region, along with the major plate boundaries.
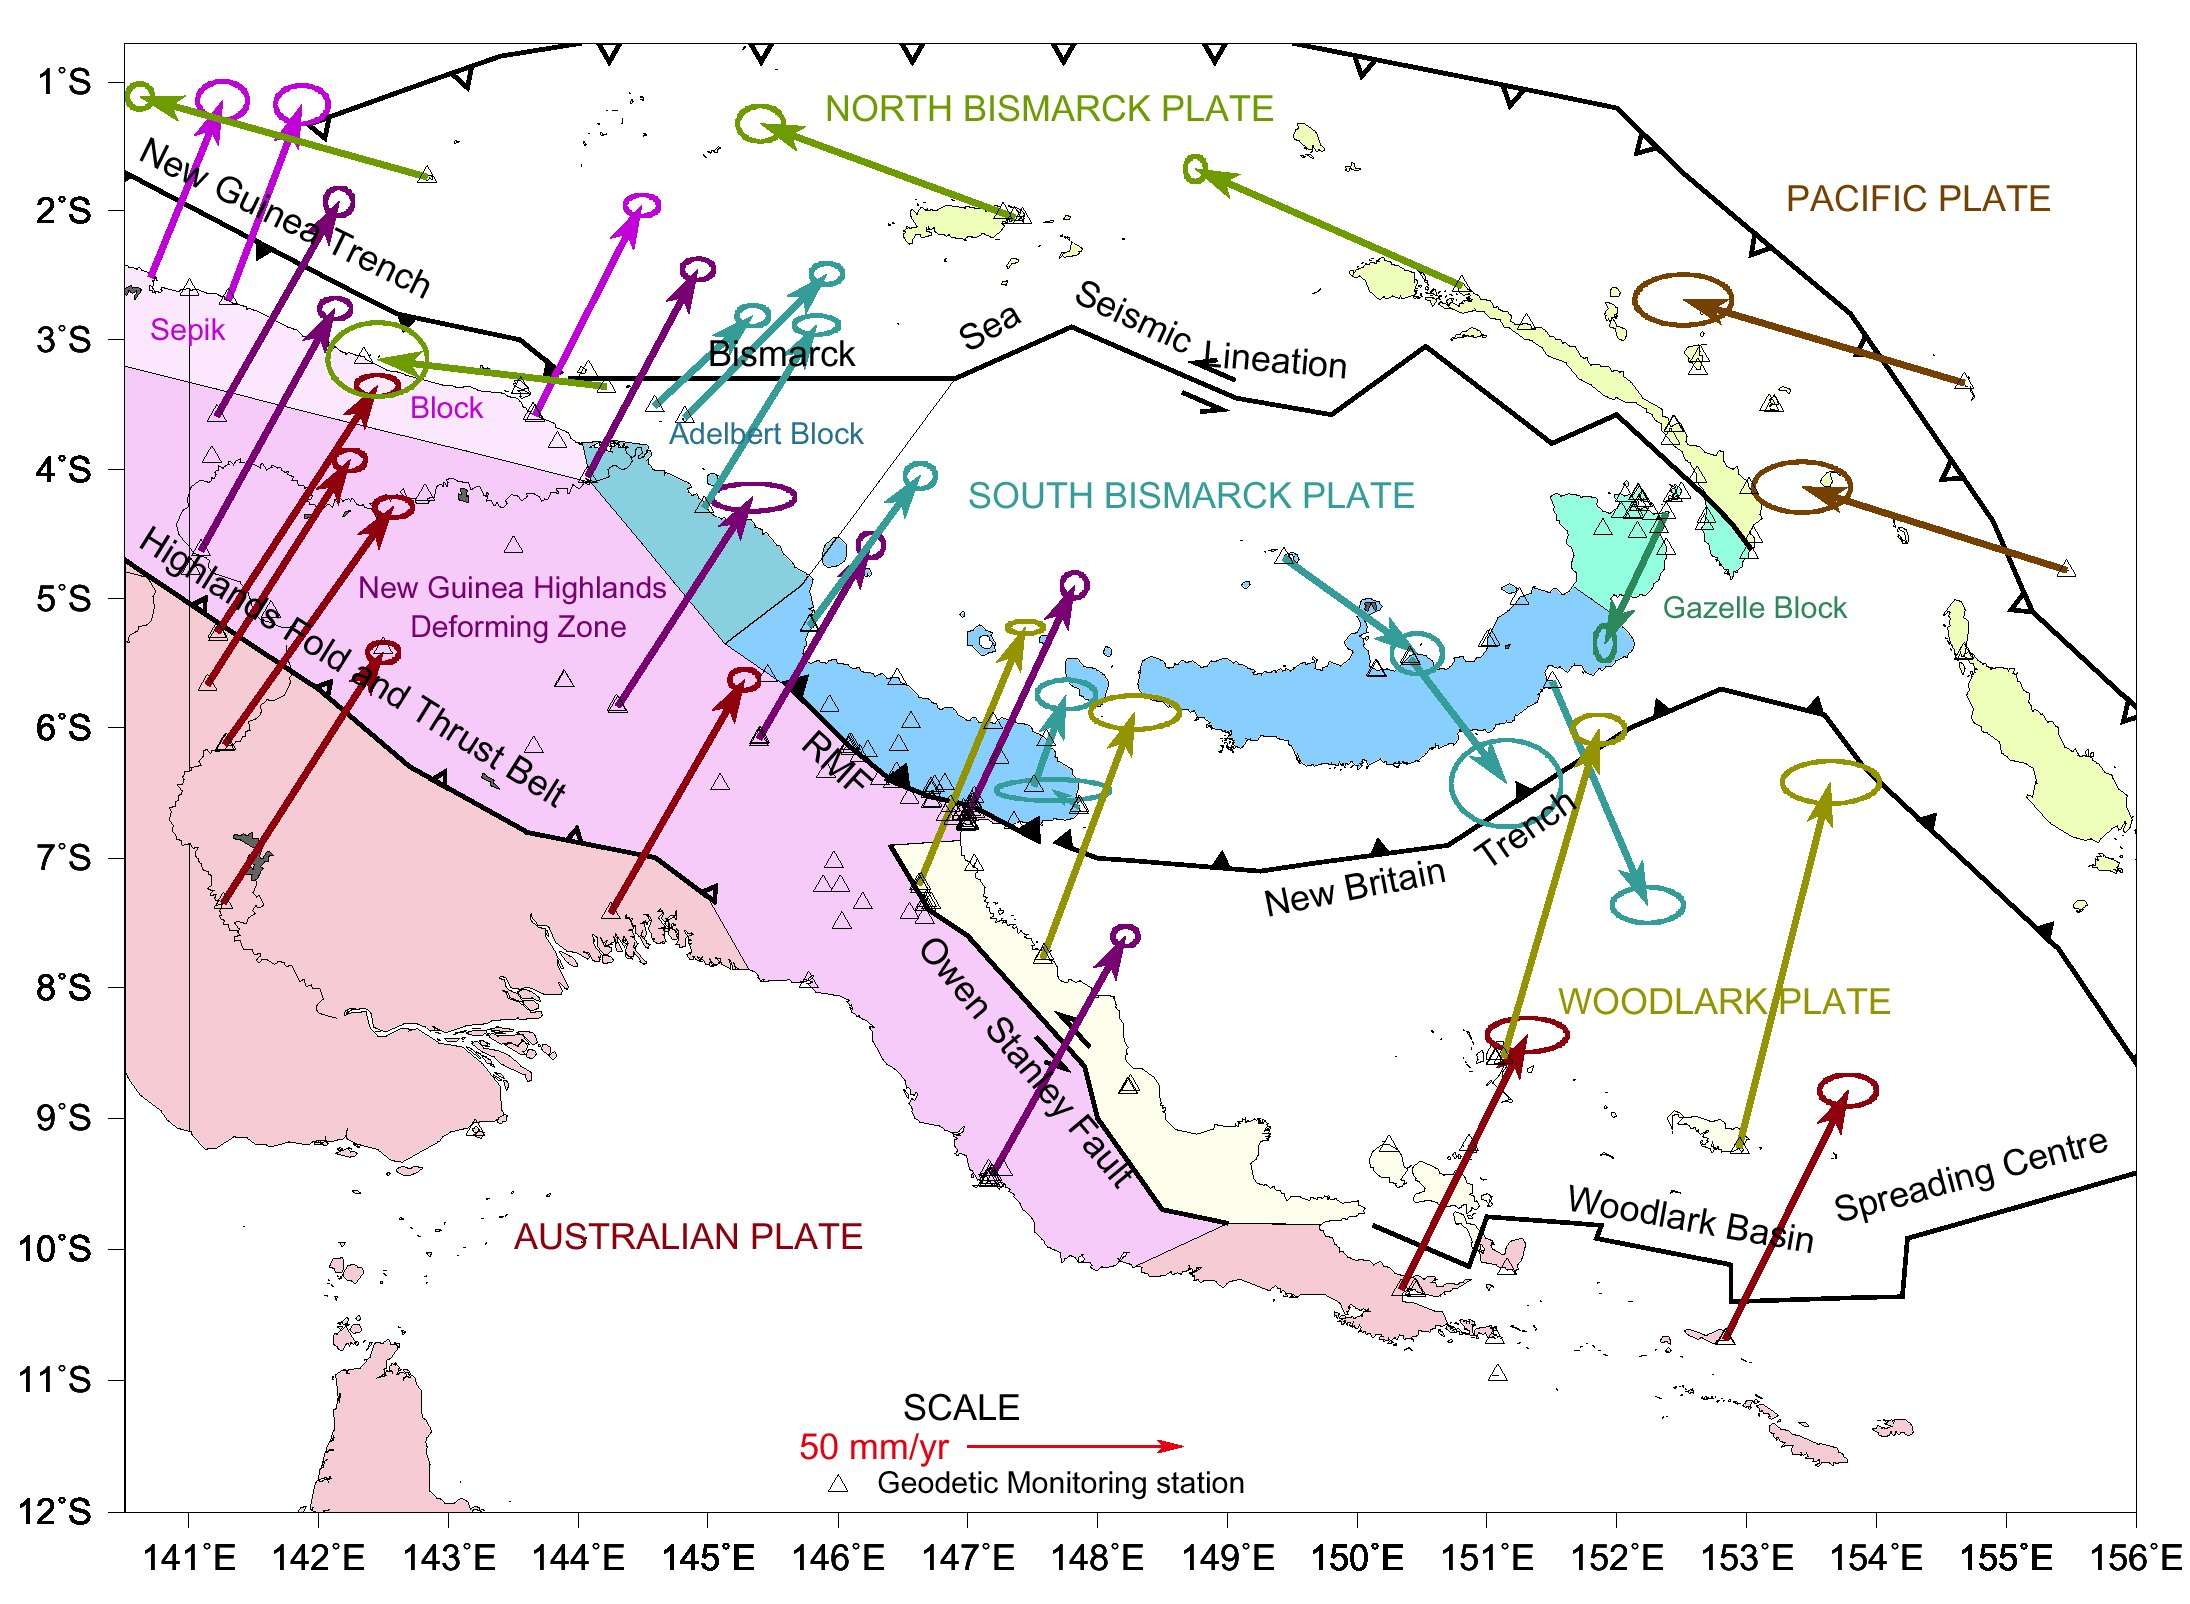
This map shows the regional tectonic setting in more detail.
This map shows how McCue modeled seismic hazard for this region in 1999. Click on the map for a pdf of his paper.
This map has some of the islands and water bodies labeled.
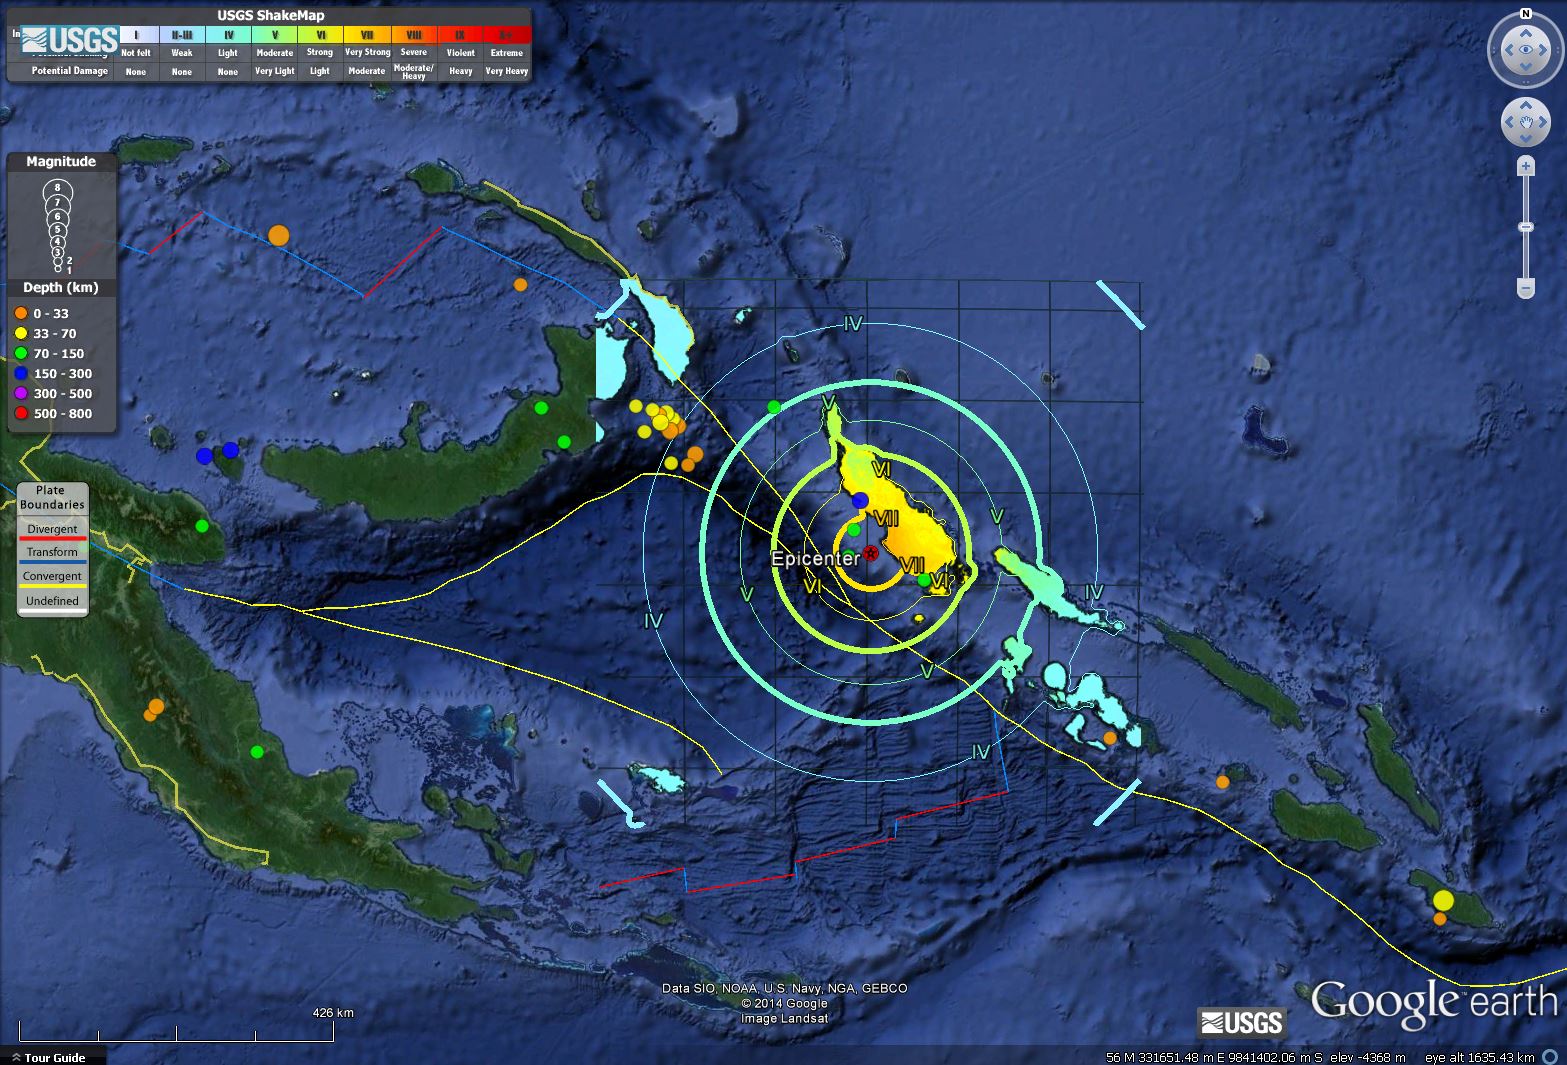
This map shows the mainshock as a large orange circle and the first major aftershock as a red circle. Here is the USGS page for the M 6.7 aftershock. There was a swarm of earthquakes to the northwest of today’s earthquake and they also have deep hypocenters, deeper than we would expect given the fault geometry modeled by Hayes at the USGS.
Here is the moment tensor from Potsdam GEOFON Extended Virtual Network :
GFZ Event gfz2014hbgl
14/04/11 07:07:23.79
Solomon Islands
Epicenter: -6.61 155.02
MW 7.1
GFZ MOMENT TENSOR SOLUTION
Depth 60 No. of sta: 50
Moment Tensor; Scale 10**19 Nm
Mrr= 4.58 Mtt=-2.65
Mpp=-1.92 Mrt= 0.95
Mrp=-0.89 Mtp= 2.47
Principal axes:
T Val= 4.75 Plg=82 Azm= 46
N 0.21 1 311
P -4.96 8 221
Best Double Couple:Mo=4.9*10**19
NP1:Strike=131 Dip=53 Slip= 91
NP2: 310 37 89
———–
—————–
———————–
##############———–
–#################———-
—###################——-
—-####################——-
——########## #######——-
——########## T ########——
——-######### #########—–
——–#####################—-
———-###################—-
———–#################—
————################-
—————############–
—————–########
———————–
—————–
———–
1 thought on “Panguna, Papua New Guinea: subduction zone earthquake”