This is the first of several posts about a complex earthquake series that happened along the northern end of the South Island in New Zealand. I was at sea on the R/V Tangaroa collecting piston cores offshore along the Hikurangi subduction zone this month. While I was at sea, there was a large earthquake, probably along one of the upper plate faults in this region. I present a simple interpretive poster below and will follow up with several more posts as I find more time between my other responsibilities (I have been gone at sea for two weeks, so I have lots of catch up work to do). This earthquake series is in a complicated part of the Earth where a subduction plate boundary turns into a transform plate boundary. There was a tsunami warning for the nearby coasts, but not for a global tsunami.
Geonet is a website in New Zealand that is a collaboration between the Earthquake Commission and GNS Science. Here is the website at Geonet where one can find the most up to date observations and interpretations about this M 7.8 Kaikoura Earthquake series.
- Below is a map that I prepared that shows the earthquakes (magnitude M ≥ 2.5) for the month of November as green circles (diameter represents earthquake magnitude). I also plot earthquakes with magnitudes M ≥ 5.5 from the period of 1950-2016. These are from the USGS NEIC, so the regional network run in New Zealand may have a larger number of earthquakes. I present two maps, one with a 250 m resolution bathymetric grid as a base and one with a Google Earth satellite based map as a base. This is not an official GNS nor NIWZ figure, but they were major supporters of the TAN163 cruise that I participated on, so we can attribute the core data to these organizations.
- I placed the moment tensors for the larger earthquakes during this time period since the M 7.8 earthquake. The main earthquake is a compressional earthquake, probably on an upper plate fault. The M 7.8 earthquake triggered slip on other thrusts and some strike-slip faults in the region. Surface deformation measured using Interferometric Synthetic Aperture Radar (INSAR) is localized, supporting the upper plate rupture interpretation. Slip on the thrust during the 7.8 is estimated to be about 10 meters, which is also the maximum slip on some of the strike-slip fault systems. There have been some excellent photographs of the fault rupture (I will include these in a later post). Most of the large earthquakes are strike-slip, but there are some connecting faults that show thrust mechanisms. I also show the regions of different faults that have been observed to have surface ruptures.
- After the earthquake, we changed our plans to conduct some post-earthquake response analyses. We collected additional cores to search for sedimentary evidence of the M 7.8 earthquake. We also collected sub-bottom profile and bathymetric data to search for seafloor exposed fault rupture. The cores we collected for our general study are shown as red cross-dots. The cores we collected as the earthquake are plotted as yellow cross-dots.
- I also include the shaking intensity contours on the map. These use the Modified Mercalli Intensity Scale (MMI; see the legend on the map). This is based upon a computer model estimate of ground motions, different from the “Did You Feel It?” estimate of ground motions that is actually based on real observations. The MMI is a qualitative measure of shaking intensity. More on the MMI scale can be found here and here. This is based upon a computer model estimate of ground motions, different from the “Did You Feel It?” estimate of ground motions that is actually based on real observations.
- I placed a moment tensor / focal mechanism legend on the poster. There is more material from the USGS web sites about moment tensors and focal mechanisms (the beach ball symbols). Both moment tensors and focal mechanisms are solutions to seismologic data that reveal two possible interpretations for fault orientation and sense of motion. One must use other information, like the regional tectonics, to interpret which of the two possibilities is more likely.
- In the upper right corner is a map from NIWA (Phil Barnes). This map shows some of the major faults in this region. I placed the observed fault offsets on this map as orange lines. This map is on the NIWA website, but I will find the Barnes publication this came from and post that in a follow up web page.
- In the lower right corner is a map from Geological and Nuclear Sciences (GNS) in Māori: Te Pū Ao. This map shows the regional faults and where there have been observations of surface rupture. The coseismic (during the earthquake) Global Positioning System (GPS) observations. Earthquakes are also plotted.
- To the left of that is a figure from the Geospatial Information Authority of Japan (GSI). This is a summary figure showing modeled uplift as compared to InSAR analysis results. Note how localized the deformation is. I will present and discuss the analyses that went into this figure in a follow-up report.
- To the left of that is a generalized tectonic map of the region.
Inset Figures
I include some inset figures. Here is some information about them. Below I include the original figures with the figure captions as blockquotes.

-
Here are the USGS websites for the large earthquakes plotted in the map above.
- 20161113 M 7.8 11:02 USGS
- 20161113 M 6.5 11:32 USGS
- 20161113 M 6.1 11:52 USGS
- 20161113 M 6.2 13:31 USGS
- 20161113 M 5.7 19:28 USGS
- 20161114 M 6.5 00:34 USGS
- 20161114 M 5.4 01:30 USGS
- 20161114 M 5.8 06:47 USGS
- 20161115 M 5.4 01:34 USGS
- 20161115 M 5.4 06:30 USGS
- 20161118 M 5.1 14:22 USGS
- 20161122 M 5.9 00:19 USGS
- 20161122 M 5.3 00:19 USGS
- 20161122 M 5.0 19:38 USGS
- Here is an image of the seismograph as recorded by the Humboldt State University, Department of Geology, Baby Benioff seismometer. Here is a high resolution version as scanned by Dr. Stephen Tilinghast. (108 MB)
- Here is a fantastic visualization of the ground motions, as recorded by USGS seismometers, from the seismic waves as they propage through the earth as a result of the main earthquake. Here is a link to the mp4 video embedded below (8 MB mp4).
- Here is the USGS Seismicity of the Earth map for this region (Benz et al., 2010). Click on the map for the pdf of this report (66 MB pdf). Here is 10 MB jpg file.
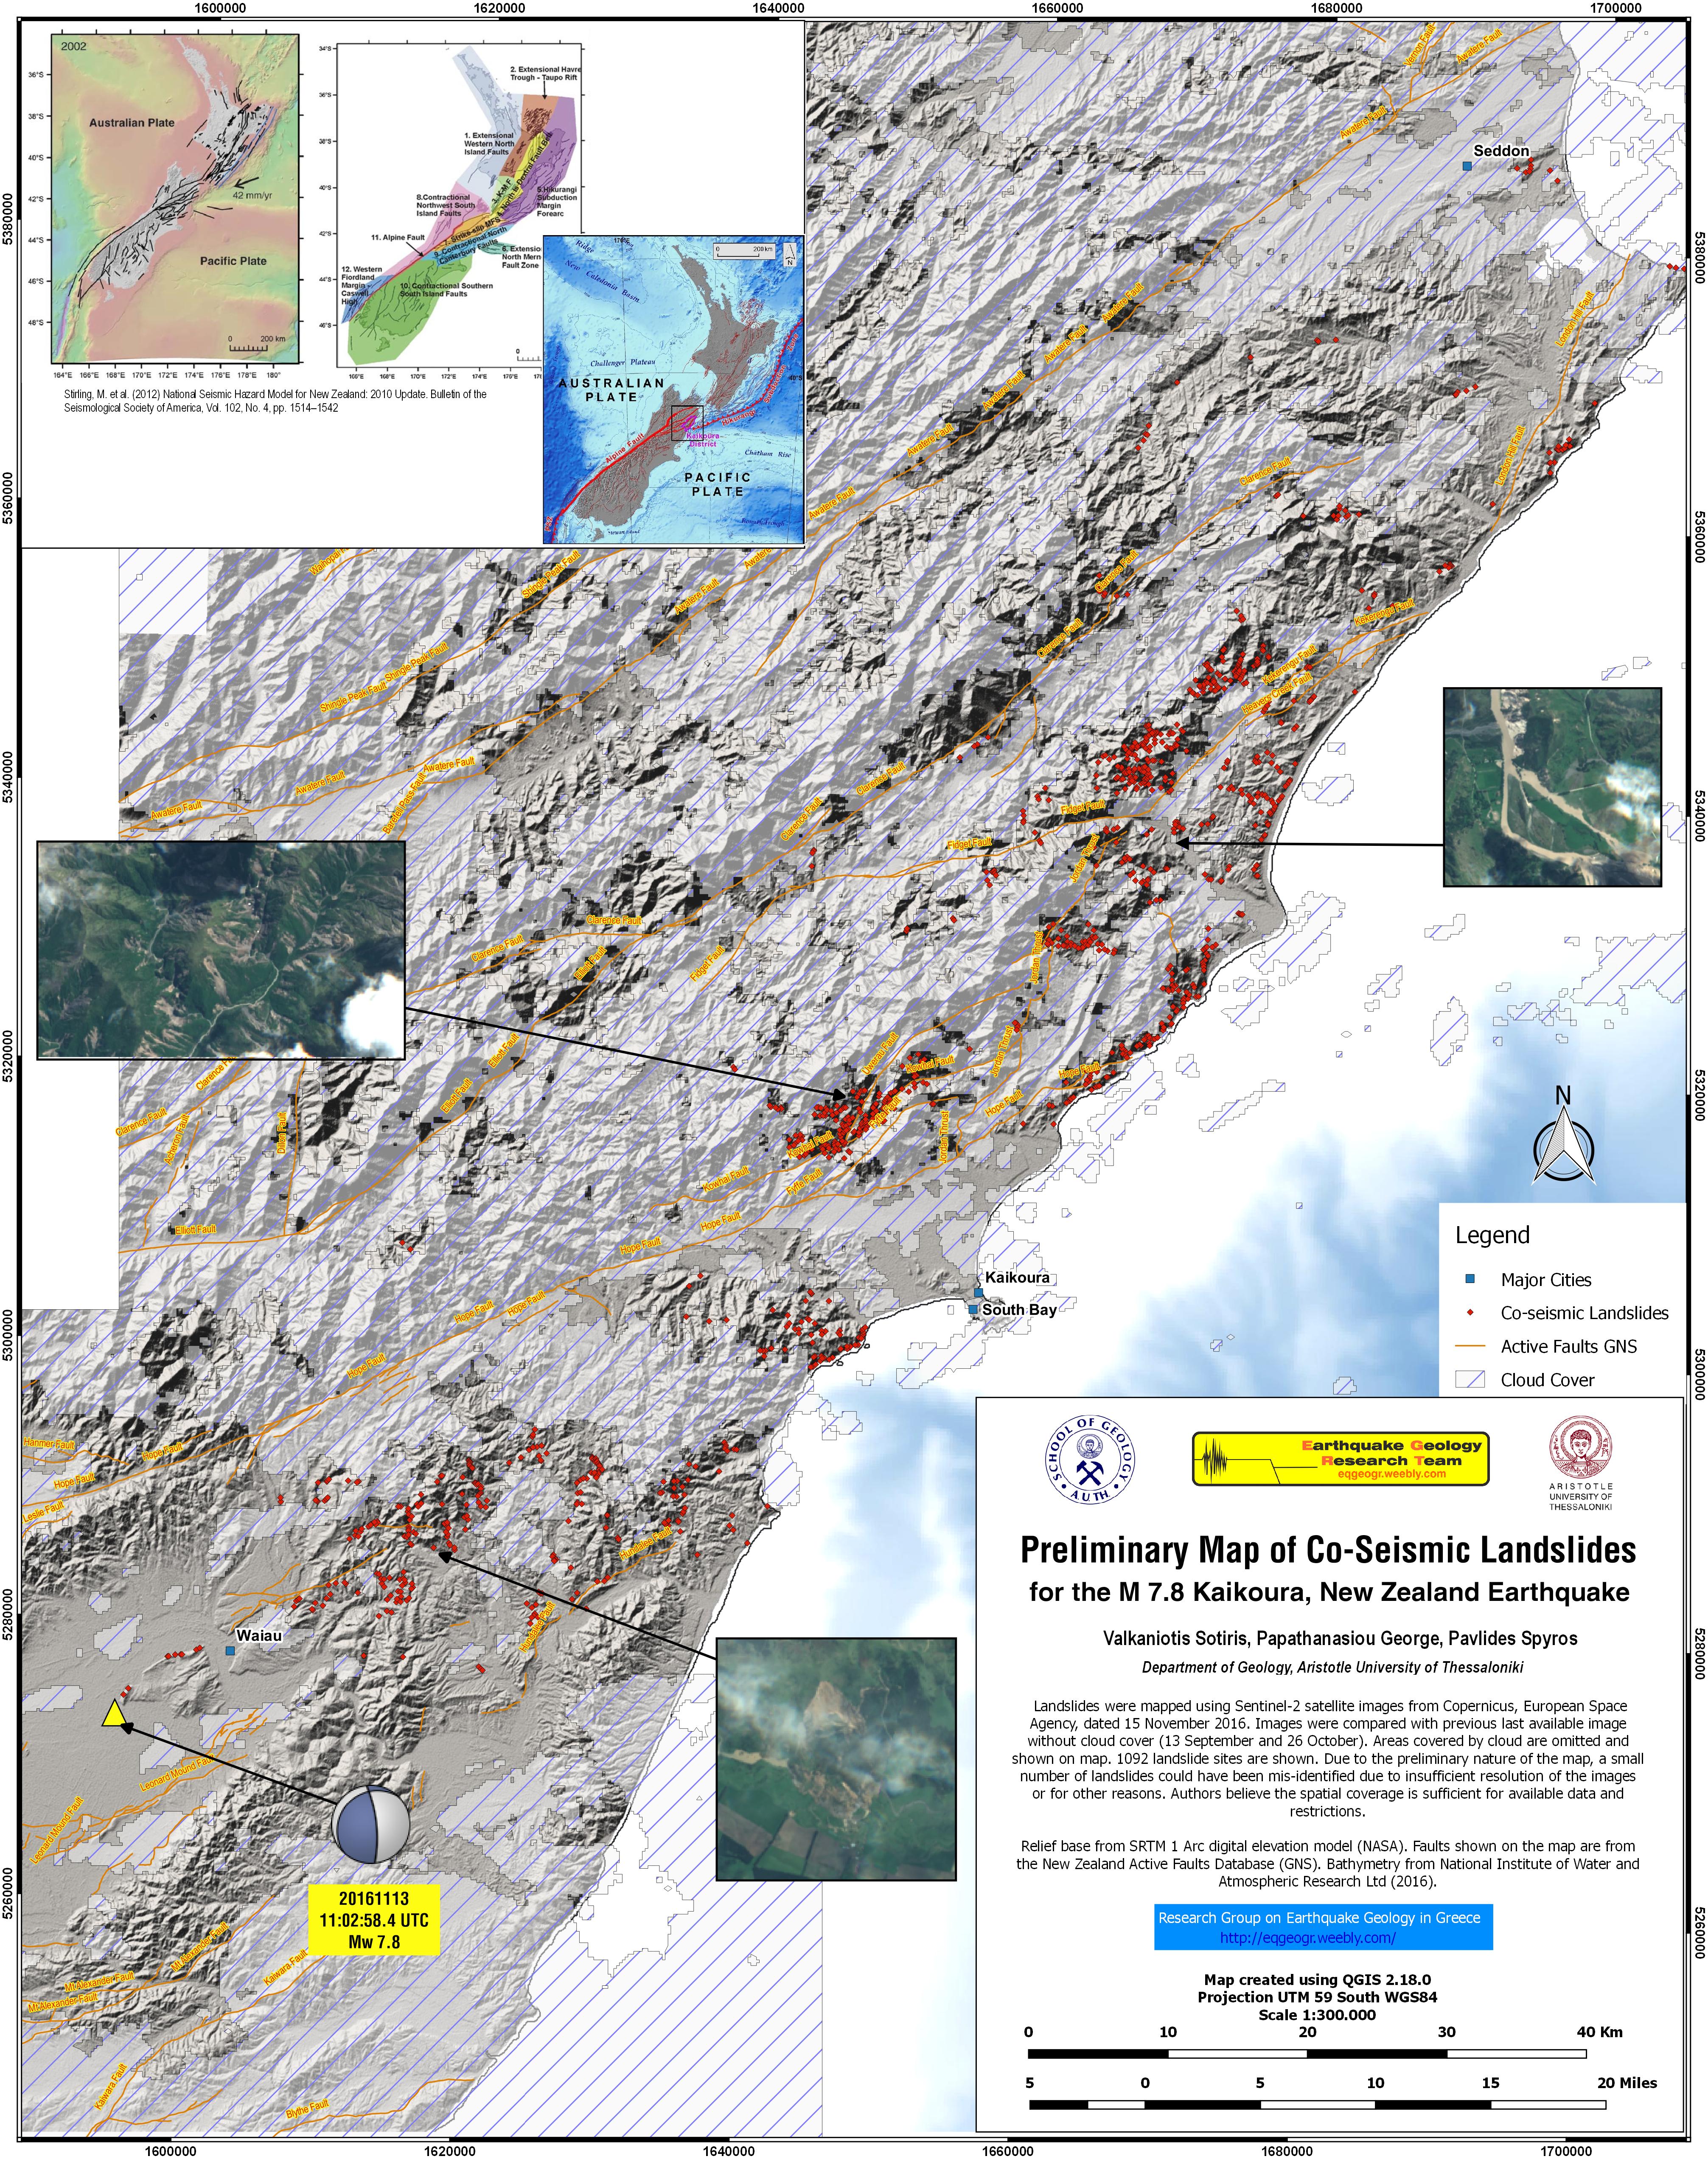
- Initial recon overflights report that there have been over 100,000 landslides from this earthquake. Below is a map that shows a different analysis that people are conducting. There will be more.
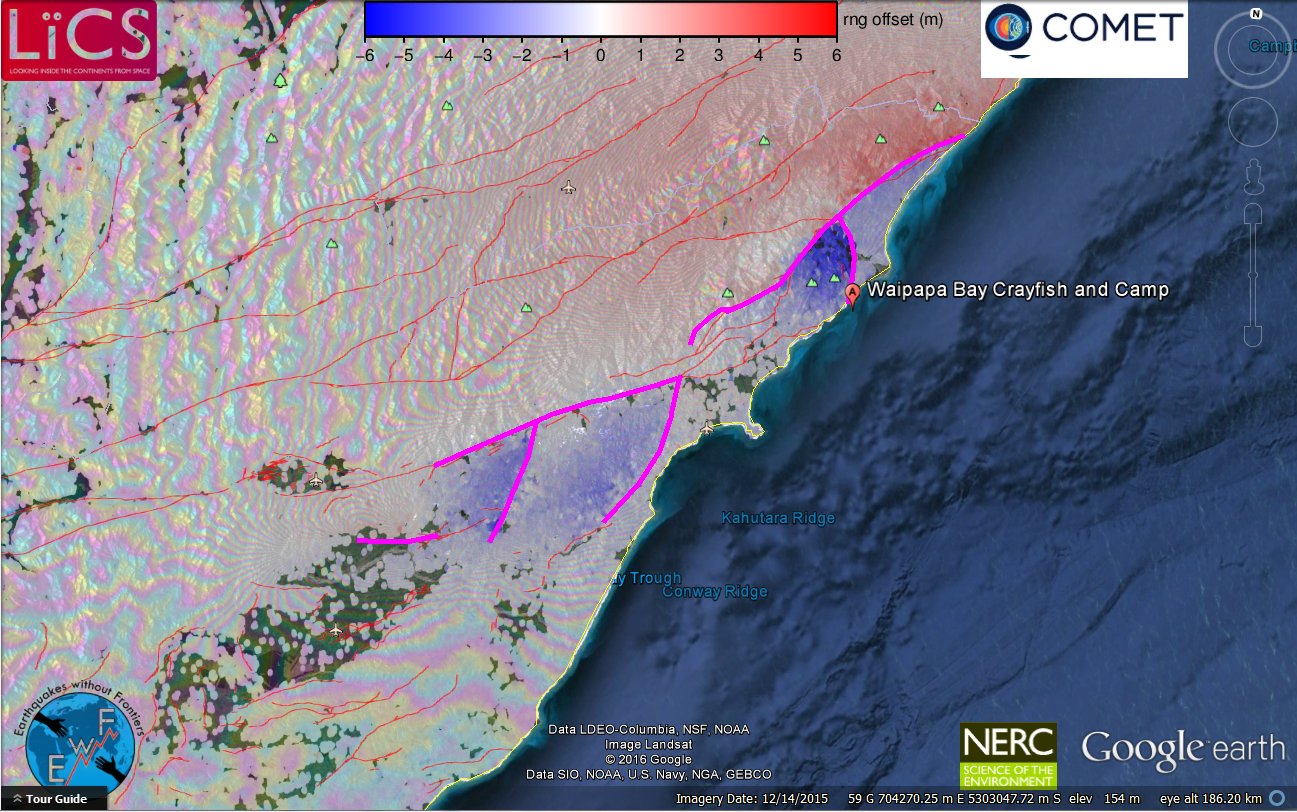
- Here is one of the early InSAR results from COMET. I will present more of these is a follow-up report.
- Here is a cool comparison animated gif showing before and after the earthquake. This is an animated gif showing photos taken by Casey Miln and Andrew Spencer.
- Casey Miln
- Andrew Spencer


- Here is a comparison satellite image from Chris Milliner.
- Here is a video of the Kekerengu fault rupture. This is the yt link for the embedded video below. Here is an mp4 link.
- Here is a video of the Papatea fault rupture. Here is an mp4 link for the video embedded below.
- Here is a video of the Papatea fault and uplifted coast. This is the yt link for the embedded video below.
- Here is a video of the earthquake and aftershocks. This is the yt link for the embedded video below.
- Here is a video showing a simulation of the M 7.8 Kaikoura earthquake. This is the yt link for the embedded video below.
Videos
- Benz, H.M., Herman, Matthew, Tarr, A.C., Furlong, K.P., Hayes, G.P., Villaseñor, Antonio, Dart, R.L., and Rhea, Susan, 2011, Seismicity of the Earth 1900–2010 eastern margin of the Australia plate: U.S. Geological Survey Open-File Report 2010–1083-I, scale 1:8,000,000.
- Furlong, K., 2007. Locating the deep extent of the plate boundary along the Alpine Fault zone, New Zealand: Implications for patterns of exhumation in the Southern Alps in Geology, v. 434, p. 1-14.
2 thoughts on “Earthquake Report: Kaikōura, New Zealand Post # 01”