Contrary to what some people spread around on the internets (some of them major earthquake experts), strike-slip earthquakes can and do generate tsunami (just like this one). More on this below.
I am in Portland, Oregon this week, attending the Winter National Tsunami Hazard Mitigation Program Meeting. While one of our workshops, several of us got an alert about a M 7.3 earthquake offshore of Cuba and Jamaica. My colleagues from Puerto Rico were immediately interested to learn more about this. We noticed that nothing was being posted to tsunami.gov.
https://earthquake.usgs.gov/earthquakes/eventpage/us60007idc/executive
The location is familiar with me as I have written reports for earthquakes in this region over the past couple of years. This earthquake happened along a strike-slip plate boundary fault. Thus, the chance of a large tsunami is low. However, strike-slip earthquakes DO generate tsunami, albeit smaller than those created by subduction zone earthquakes. In addition, earthquakes can trigger submarine landslides, which can also serve to cause tsunami (these can be very large, but generally impact the area near the landslide, like the 1998 Papua New Guinea tsunami.).
In a few minutes, the earthquake magnitude was updated to M 7.7. This is quite common, as seismological data are analyzed with greater detail after the initial automatic magnitude calculation.
A few minutes later, the USGS moment tensor (earthquake mechanism) was posted online, confirming that it was a strike-slip earthquake.
The IOC tide gage network was not working, so I could not check for tsunami observations until later. However, the Pacific Tsunami Warning Center sent out an email to the International Tsunami Bulletin Board (email list restricted to tsunami scientists) with arrival times. There was a suggestion that tsunami waves up to 1 meter may arrive along the coast in the region.
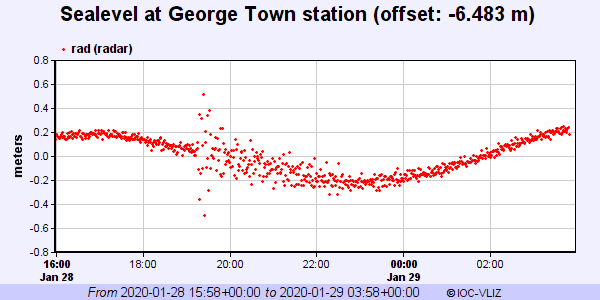
At lunch time, I went to my hotel room to put together an interpretive poster (thanks boss!) to send out on social media. By that time, a small tsunami wave had been observed at the tide gage on the west coast of Cayman Island. The PTWC sent out their final email, stating a 0.4 foot tsunami was recorded there. I went to the IOC website and the gage data were quite noisy, but it matched the PTWC email. Here is a link to the George Town Tide Gage.
Just as I was about to tweet the poster, the USGS earthquake fault slip model was published online (so I added that to the poster).
After lunch, as the workshop continued, there was a M 6.1 earthquake. I noticed it was west of the slip model. I had considered an alternate hypothesis (that the M 6.1 was triggered, not an aftershock), but now think that this is just part of the M 7.7 slip patch. Looking at the back projection data from IRIS, it suggests that this earthquake initiated in the east and propagated to the west. It makes sense to me that the fault reached a zone where the fault slip slowed down, until it reached the patch that slipped during the M 6.1. (simplifying this for this report)
Was this Cayman Islands Earthquake Sequence related to the ongoing Puerto Rico Earthquake Sequence? Probably not. They are simply too far from each other.
There are two types of earthquake triggering: static and dynamic. Triggering happens when an earthquake on one fault changes the stress on a different fault, causing that other fault to slip during an earthquake. These stress changes are small, so the “receiver” fault needs to be at a state of stress that is high enough that it would be almost ready to slip before the “source” earthquake.
Dynamic triggering happens when seismic waves from the source earthquake travel through the Earth, triggering an earthquake on the receiver fault. These changes in stress may take a while before the triggered earthquake happens, but generally, we think that this would happen while these waves are traveling through the area.
Static triggering happens when a source earthquake changes the stress in the crust surrounding the source earthquake. This change typically lasts months to years and won’t extend beyond two fault lengths of the source earthquake. So, If the source quake had a rupture length of 50 km, static triggering probably would not happen more than 100km from the source quake. This is just a rule of thumb… BUT the M 7.7 is very far from Puerto Rico, so is probably unrelated to the Puerto Rico Sequence.
Earthquake Description
This M 7.7 earthquake happened along the Oriente fault, which is the Septentrional fault further to the east. This fault is one of the boundaries between the North America plate to the north and the Caribbean plate to the south in a region called the Greater Antilles.
Further to the east, this plate boundary changes into a subduction zone along the Lesser Antilles. This subduction zone is the source of a great amount of research. There is some evidence that the megathrust subduction zone fault is not locked, so it is slipping and not capable of generating Great (M>8) earthquakes. However, I was on a team of French geologists aboard the Pourquoi Pas? in 2016. We were coring the deep sea to investigate the sedimentary record of Great earthquakes. Based on our analysis, it appears that the fault is capable of producing these large earthquakes, but the average time between earthquakes (the recurrence interval) is on he order of several millenia.
To the west of the M 7.7 earthquake, there is an oceanic spreading ridge where crust is created, forming the Cayman Trough. As the boundary steps to the south, the relative plate motion is focused on another left-lateral strike-slip fault, the Swan Island fault. This fault extends further to the west into Central America and turns into the Motagua Polochic fault system (there are actually multiple faults hypothesized to be the active part of this plate boundary here). I discuss this more in an Earthquake Report here.
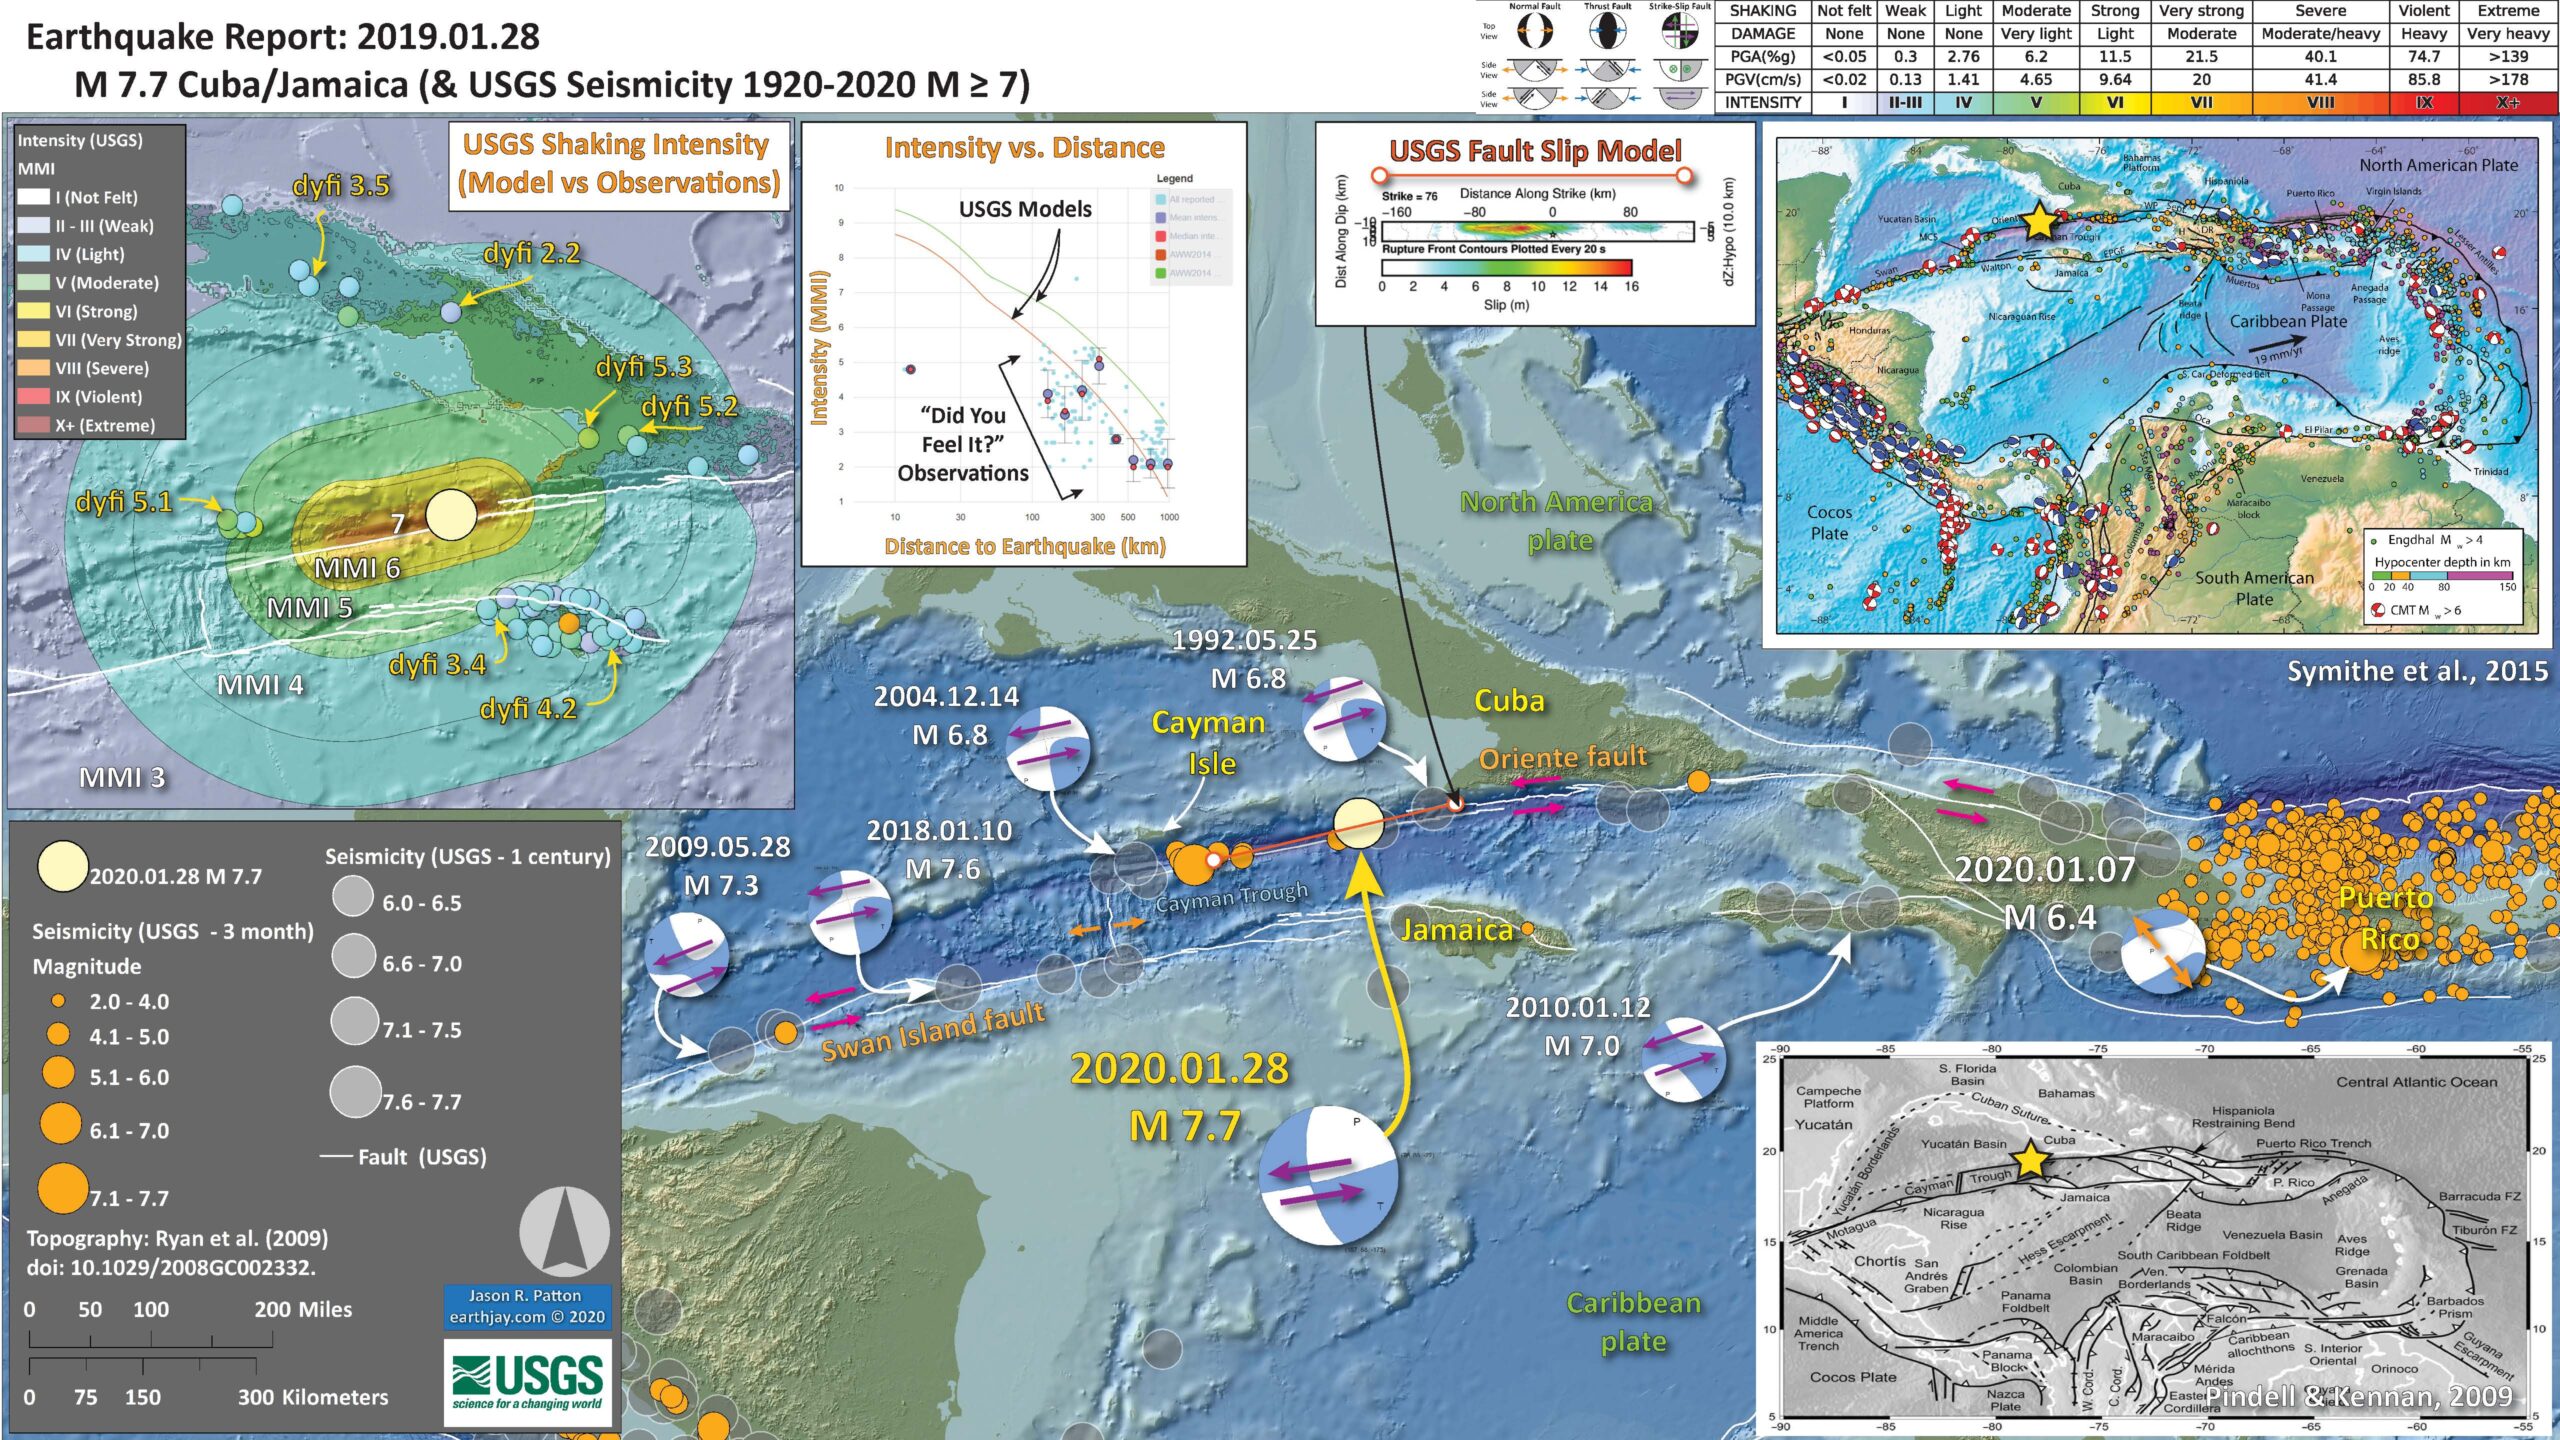
Below is my interpretive poster for this earthquake
- I plot the seismicity from the past 3 months, with diameter representing magnitude (see legend). I include earthquake epicenters from 1920-2020 with magnitudes M ≥ 6.0 in one version.
- I plot the USGS fault plane solutions (moment tensors in blue and focal mechanisms in orange), possibly in addition to some relevant historic earthquakes.
- A review of the basic base map variations and data that I use for the interpretive posters can be found on the Earthquake Reports page.
- Some basic fundamentals of earthquake geology and plate tectonics can be found on the Earthquake Plate Tectonic Fundamentals page.
- In the lower right corner is a map from Pindell and Kennan (2009) that shows the major plate tectonic faults in the Caribbean. I place a yellow star in the general location of today’s M 7.7 earthquake.
- In the upper right corner is a map from Symithe et al. (2015). I have used this figure in many of my reports because it is so awesome!!! This map includes the faults of the region, but also includes earthquake mechanisms (e.g. focal mechanisms).
- To the left of the Symithe map is the USGS model for the earthquake fault that slipped during this earthquake. The color represents the amount of slip. I placed a red line with circles at the end on the map where this fault model is located. Don’t forget, this is just a model (but it matches the data that the USGS uses to constrain the model).
- In the upper left corner is a map that shows a comparison of the USGS model for shaking intensity (using the Modified Mercalli Intensity (MMI) scale) and the USGS “Did You Feel It?” observations.
- The shaking intensity model is based on the results of analyzing thousands of earthquakes and using these earthquakes to develop a relation between earthquake size (e.g. magnitude) and how strongly it shakes based on the distance to the earthquake.
- The “DYFI” observations are based on the results of surveys that people submit to the USGS website. The questions people answer are about their observations of the earthquake. Here are some basic facts about this DYFI program and here is some scientific background behind the DYFI program.
- To the right of the intensity map is a plot of the data from the map. The vertical axis represents intensity (MMI) and the horizontal axis represents the distance from the earthquake. The solid lines represent the model results from the USGS. These are the models that the USGS used to create the color on the map to the left. The DYFI observations are the blue dots (the brown dots show averages ofthe blue dots). There is a decent match, but it is far from perfect.
I include some inset figures. Some of the same figures are located in different places on the larger scale map below.
- Here is the map with 3 month’s seismicity plotted.

- Here is the tsunami observation posted by the PTWC. A few years ago, it was conventional wisdom (at least, in my mind) that strike-slip earthquakes were not a producer of tsunami. In the past few years, however, most every large strike-slip submarine earthquake has generated a tsunami. We need to break this old way of viewing this.
- The main difference for tsunami from strike-slip earthquakes is that they are smaller than from subduction or thrust faults. BUT, even a tsunami with a size of about 2-3 meters can cause millions of dollars of damage. These are still dangerous events, even though they are not as dangerous as larger tsunami.
- As we can see from the plot below, it will take someone more skilled than I to understand the tsunami waves observed here. However, even I can see that there was a change in water surface elevation at about the right time given the distance to the earthquake from the Cayman Islands.
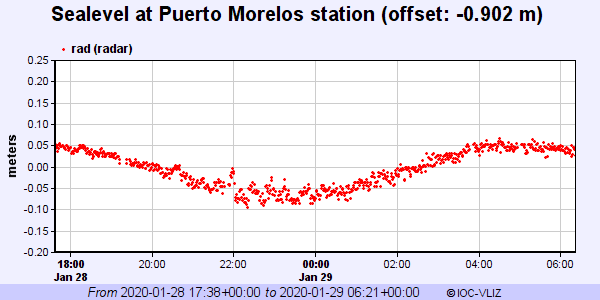
- UPDATE: 2020.01.29 – This morning I saw a tweet from Christoph Gruetzner and I realized that I had only reviewed the tide gage data from nearest the quake. Below is a plot from a site in Mexico which clearly shows a tsunami wave train. This is a better record that the one above from Cayman Island. The Cayman gage is located on the western side of the island, not optimal to record waves sourced from the east (why it is so noisy). This Puerto Morelos gage (below) is a much better record, albeit still a small wave that is in a location with significant background wave “noise.”
- Here is a figure that includes a map showing the location of these two tide gages. I will update this later, gotta get to the meeting today.


Some Relevant Discussion and Figures
- Here is the tectonic map from Symithe et al. (2015). I include their figure caption below in blockquote.
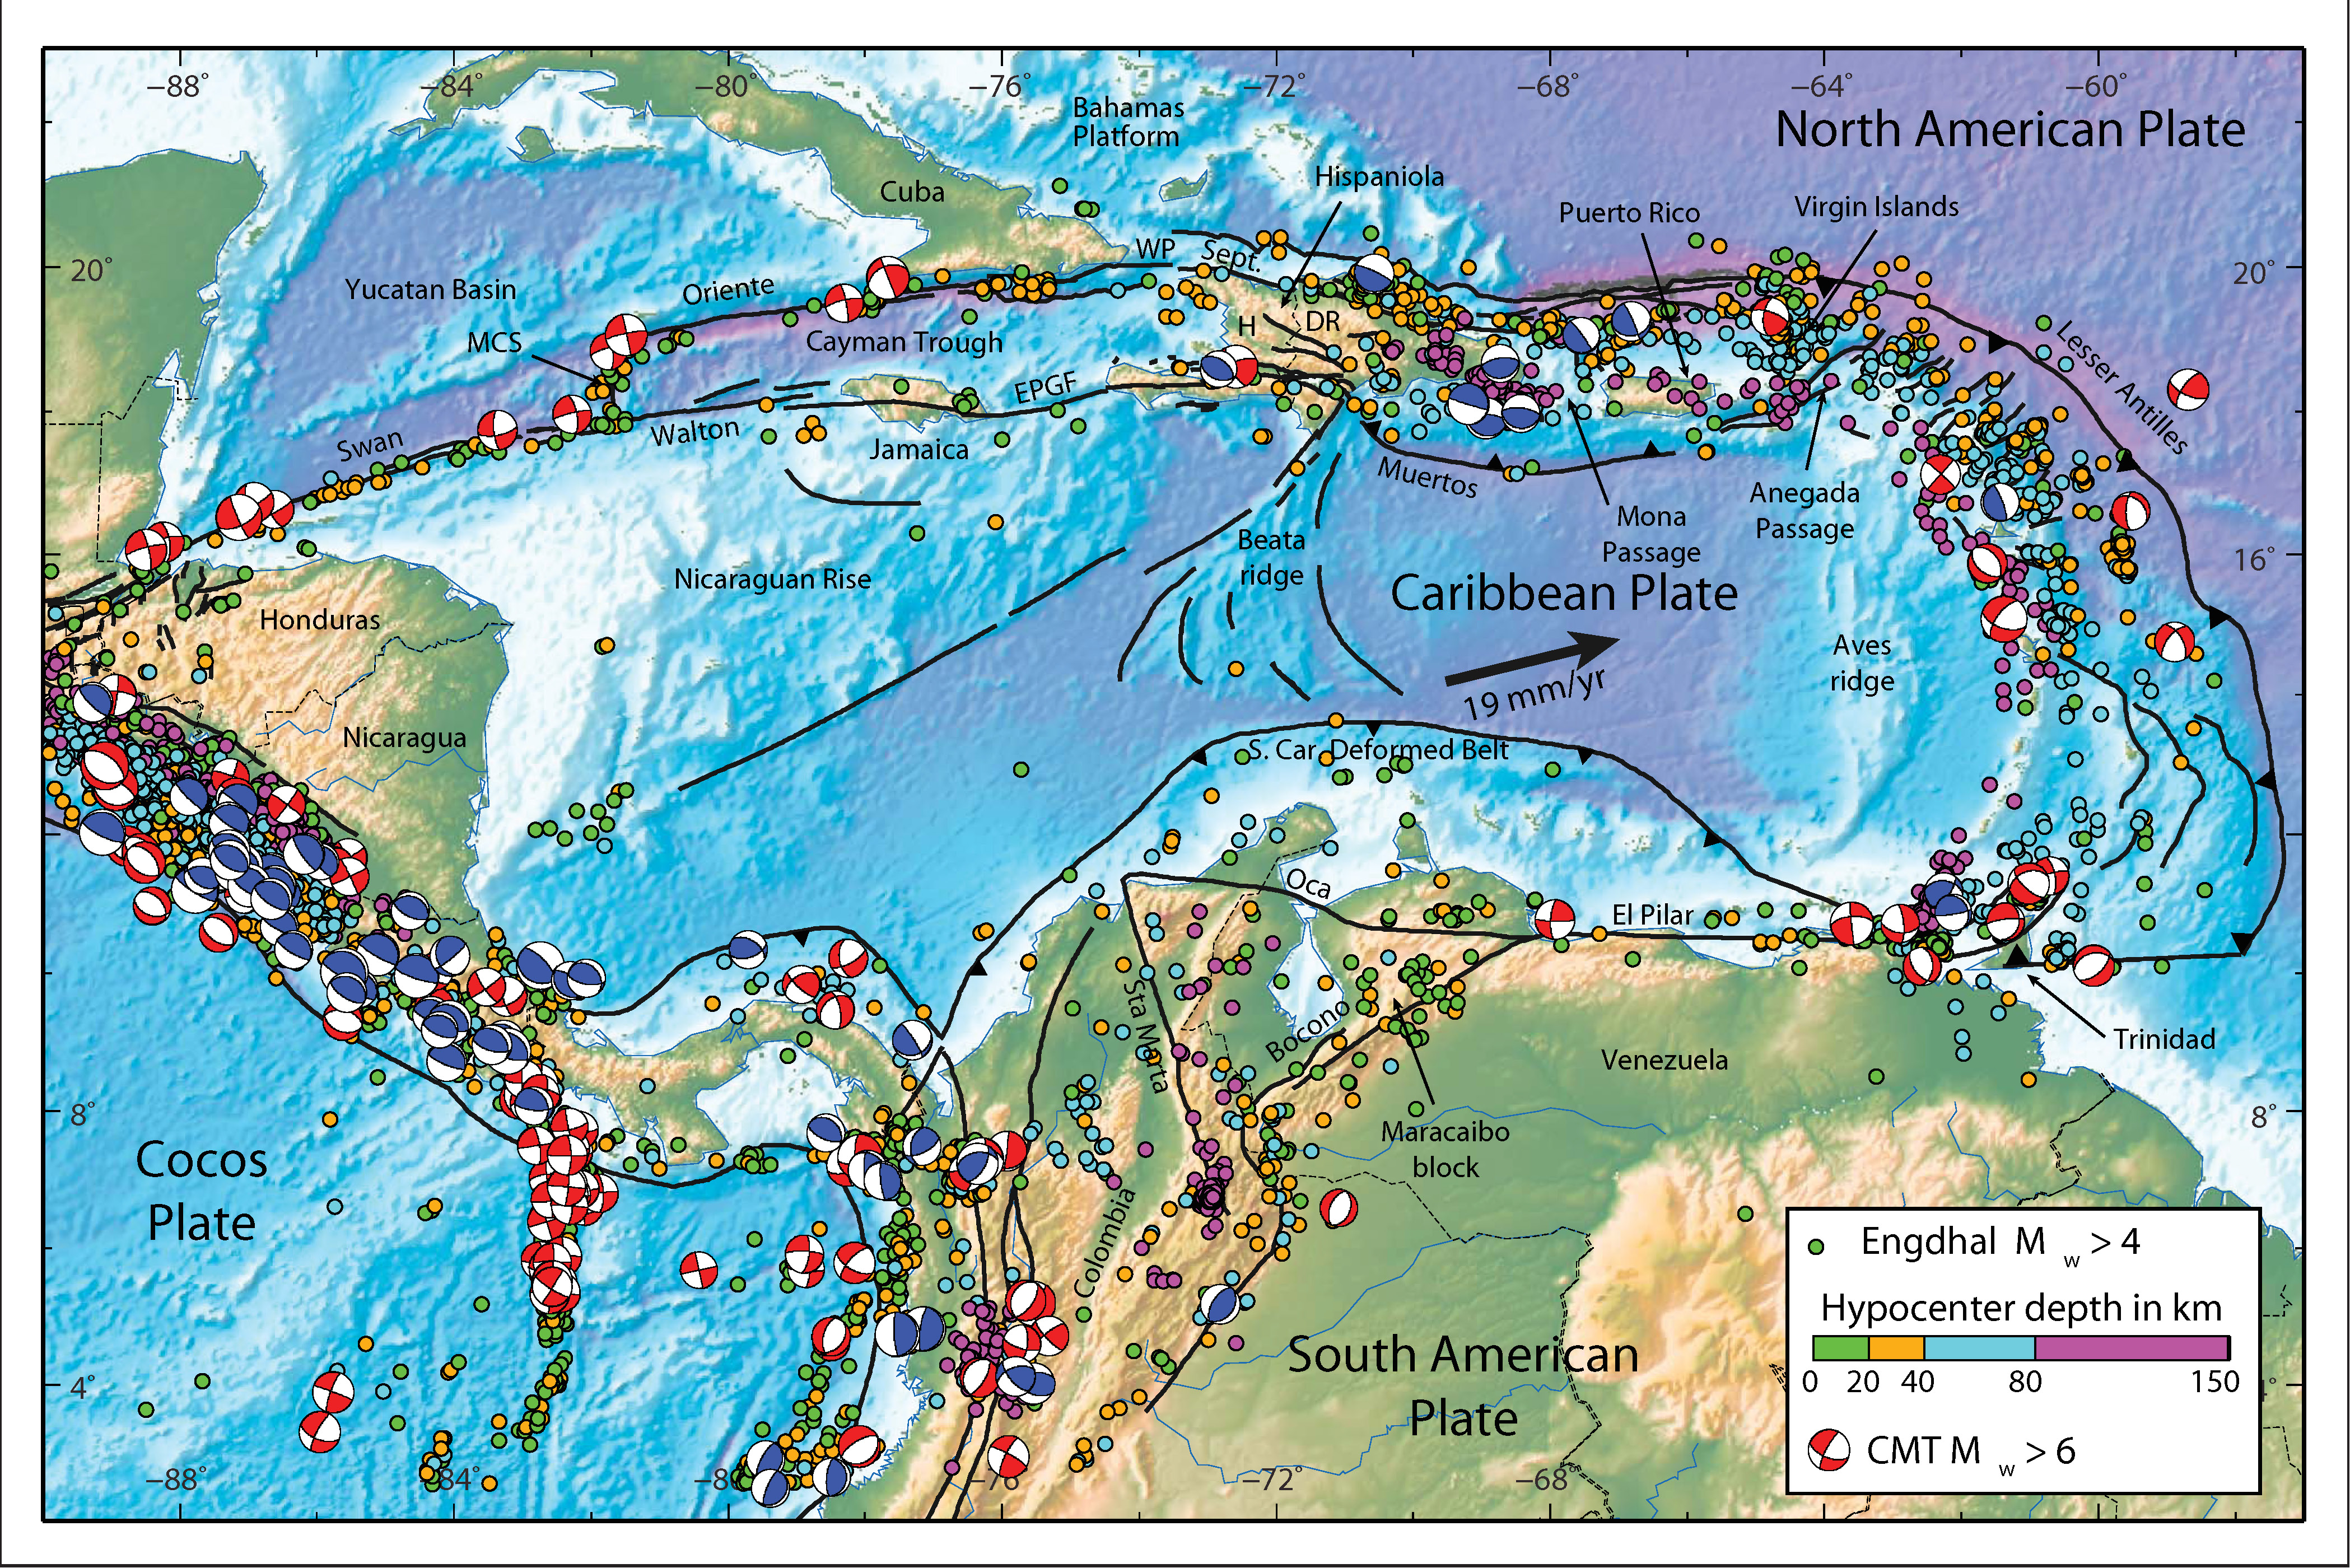
Seismotectonic setting of the Caribbean region. Black lines show the major active plate boundary faults. Colored circles are precisely relocated seismicity [1960–2008, Engdahl et al., 1998] color coded as a function of depth. Earthquake focal mechanism are from the Global CMT Catalog (1976–2014) [Ekstrom et al., 2012], thrust focal mechanisms are shown in blue, others in red. H = Haiti, DR = Dominican Republic, MCS = mid-Cayman spreading center, WP = Windward Passage, EPGF = Enriquillo Plaintain Garden fault.
- Here is the tectonic map from Garcia-Casco et al. (2011). I include their figure caption below in blockquote.

Plate tectonic configuration of the Caribbean region showing the location of the study cases presented in this issue (numbers refer to papers, arranged as in the issue), and other important geological features of the region (compiled from several sources).
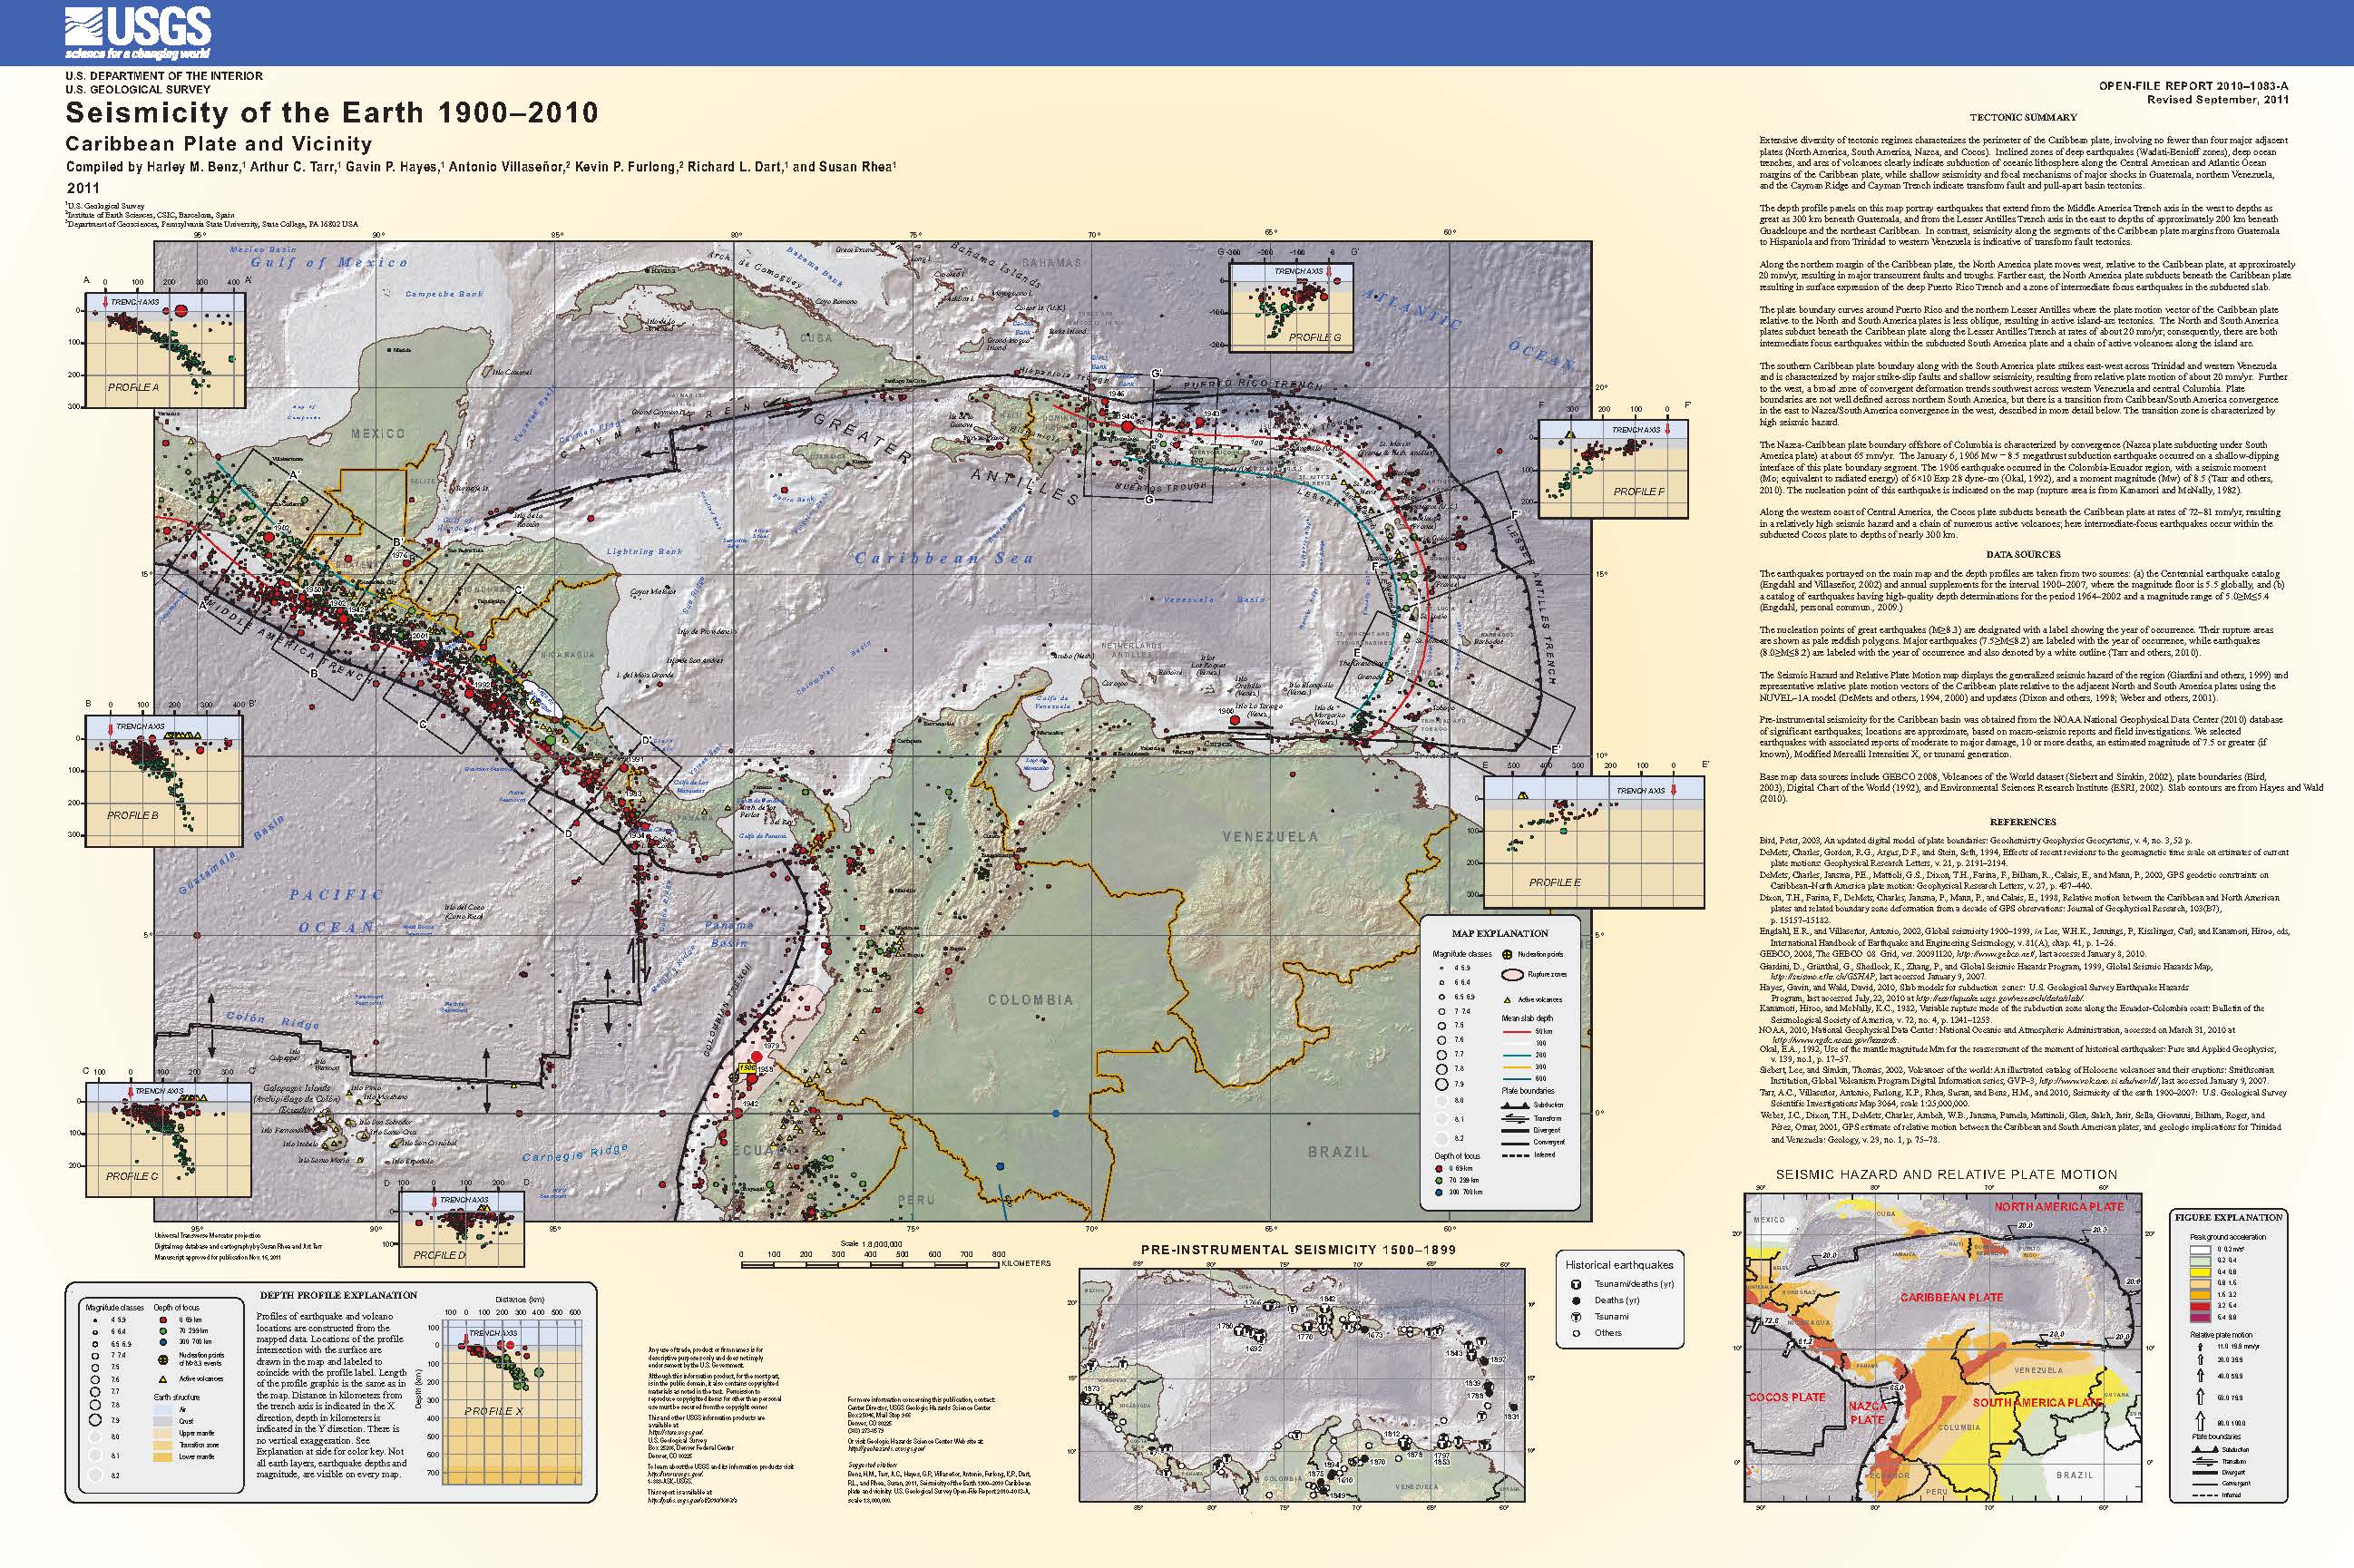
- Here is the Benz et al. (2011) Seismicity of the Earth poster for this region.
- Here is the map from Mann et a. (1991). Note how today’s earthquake is in an area that may have overlapping faults of different types.

A. Tectonic map of Cayman trough region showing strike-slip faults (heavy lines), oceanic crust (gray) in Cayman trough, and magnetic anomaly identifications (numbered bars) (after Rosencrantz et a., 1988). Arrows show relative displacement directions. Fault zones: OFZ – Oriente; DFZ- Dunvale; EPGFZ – Enriquillo-Plantain Garden; WFZ – Walton; SIFZ – Swan Islands; MFZ – Motagua. Bl. Late Miocene reconstruction of Cayman trough. C. Early Miocene reconstruction.
- Here is the large scale map from ten Brink et al. (2002) showing the bathymetry surrounding the Mid-Cayman Rise.

Bathymetry of central Cayman Trough adapted from Jacobs et al. (1989). Contour interval: 250 m. Dotted line: location of gravity transect.
- Here is the USGS Tectonic Summary for this 2018.01.10 M 7.6 earthquake. A more comprehensive review can be found here.
- The January 10, 2018, M 7.6 Great Swan Island, Honduras earthquake occurred as the result of strike slip faulting in the shallow crust near the boundary between the North America and Caribbean plates. Early focal mechanism solutions indicate that rupture occurred on a steeply dipping structure striking either west-northwest (right-lateral), or west-southwest (left-lateral). At the location of this earthquake, the North America plate moves to the west-southwest with respect to the Caribbean plate at a rate of approximately 19 mm/yr. Local to the January 10, 2018 earthquake, this motion is predominantly accommodated along the Swan Islands transform fault, a left-lateral structure. The location, depth and focal mechanism solution of today’s earthquake are consistent with rupture occurring along this plate boundary structure, or on a nearby and closely related fault.
- While commonly plotted as points on maps, earthquakes of this size are more appropriately described as slip over a larger fault area. Strike-slip-faulting events of the size of the January 10, 2018, earthquake are typically about 140×20 km (length x width).
- Nine other earthquakes of M 6 or larger have occurred within 400 km of the January 10, 2018 event over the preceding century. Previous strong earthquakes along the North America-Caribbean plate boundary in this region include the destructive M 7.5 Guatemala earthquake of February 4, 1976, which resulted in more than 23,000 fatalities. The 1976 earthquake occurred on the Motagua fault, a segment of the plate boundary that lies in southern Guatemala, about 650 km west-southwest of the hypocenter of the January 10, 2018, event. In May 2009, a M 7.3 earthquake occurred along the Swan Island transform fault approximately 300 km west of the January 10, 2018 event. The 2009 earthquake (which was much closer to land than the 2018 event) resulted in 7 fatalities, 40 injuries and 130 buildings being damaged or destroyed.
- 2016.01.17 1900-2016 Summary northern Caribbean
- 2020.01.28 M 7.7 Cayman Islands
- 2020.01.07 M 6.4 Puerto Rico
- 2018.08.21 M 7.3 Venezuela
- 2018.01.10 M 7.6 Cayman Trough
- 2016.01.17 M 5.1 pair Cuba
- 2010.01.12 M 7.0 Haiti
Caribbean Earthquake Reports
General Overview
Earthquake Reports
Social Media
#EarthquakeReport for the M7.7 left-lateral strike-slip #Earthquake #Terremoto #TremblementDeTerre along the Oriente-Septentrional fault system in the #GreaterAntilles
affecting #Cuba #CaymanIslands #Jamaica #tsunami observed and #GroundShaking
report:https://t.co/8sTAMIQlq6 pic.twitter.com/Y2PCHHxuDj
— Jason "Jay" R. Patton (@patton_cascadia) January 29, 2020
Watch the M7.7 Caribbean earthquake waves roll across the USArray Transportable Array seismic network (https://t.co/RIcNz4bgWq )! #earthquake #JamaicaEarthquake pic.twitter.com/aVSu6B1DTw
— IRIS Earthquake Sci (@IRIS_EPO) January 29, 2020
7.7 magnitude earthquake 80 miles ESE of Cayman Brac & Little Cayman#earthquake video is damage from Grand Cayman in the George Town Hospital staff parking lot @lookner pic.twitter.com/AWe3MtFUUB
— Raymond Gayle (@Kentsville) January 28, 2020
S-Waves arrive after P-Waves — RIP Beer but a good lesson in earthquake physics. https://t.co/YneCbBEwQd
— Switzer Coastal lab (@CoastalLabNTU) January 29, 2020
I've updated the seismicity map with aftershocks of today's M7.7 earthquake in Caribbean in purple. All are to West of mainshock epicenter & most clustered at about 200 km, suggesting rupture propagated to West & has length of ~200 km (expected for M7.7). pic.twitter.com/Ee2NTFOR0Z
— Jascha Polet (@CPPGeophysics) January 29, 2020
M 7.7 – 125km NNW of Lucea, Jamaica
2020-01-28 19:10:25 (UTC) pic.twitter.com/Oiyj7sFzuT— Alan Kafka (@Weston_Quakes) January 29, 2020
Here is the IRIS interpreted version of their similar section for reference: https://t.co/byjiAkbhLI
— Mark Vanstone (@wmvanstone) January 28, 2020
Jamaica had some tremors 🥴 pic.twitter.com/pubHU8ULHT
— kendrabradia (@kendrabradia) January 28, 2020
There was just a 7.3 magnitude earth quake in Jamaica.
In my apt in Miami – this just happened.
Could feel the whole building swaying.
Crazy! pic.twitter.com/r5pPJzcLvm
— Nunya Bizniz (@Pladizow) January 28, 2020
More sinkholes appear in towns in Jamaica after a 7.7 magnitude earthquake strikes off the coast of Cuba and Jamaica. pic.twitter.com/b2yaVOHkMp
— 🗞️🇻🇮 State of the Territory News (@sottvi) January 28, 2020
#EarthquakeUpdate Tsunami Map showing areas of Jamaica that could be impacted by waves (in yellow) not exceeding 3 feet pic.twitter.com/WeLZUGhGTZ
— ODPEM (@odpem) January 28, 2020
It’s getting really wild out there in Jamaica 😐 #earthquake #jamaica pic.twitter.com/X82CyHCBA2
— kendrabradia (@kendrabradia) January 28, 2020
The tanks are part of the Cayman Water West Bay facility.https://t.co/MTioQQPKxI pic.twitter.com/cCruNnS1e5
— bbdd333 (@bbdd333) January 29, 2020
The direction a fault ruptures in an earthquake can affect the intensity of shaking. Using methods like back-projection and finite fault modeling (FFM) helps determine this directivity. https://t.co/LjR89f2p1q
— Dr. Kasey Aderhold (@kaseyaderhold) January 28, 2020
Mw=7.8, CUBA REGION (Depth: 27 km), 2020/01/28 19:10:25 UTC – Full details here: https://t.co/NLpq1TBmAc pic.twitter.com/tU0JMJB6Eg
— Earthquakes (@geoscope_ipgp) January 28, 2020
On the Oriente fault, 1962 and 1917 #earthquakes are the strongest events before the network set-up, resp. M6.1 and M7. From Van Dusen and Doser, 2000 https://t.co/iy8OnA9r8Z pic.twitter.com/YG8woSpENn
— Stéphane Baize (@stef92320) January 28, 2020
Earthquake my family in Cayman Islands pic.twitter.com/Vh8njK0SRs
— Jeannine Brown (@Jeannin54070867) January 28, 2020
Mw7.7 #earthquake #Cuba Region #Jamaica #CaymanIslands@QuakeEarly Mwpd magnitude indicated Mw7.8 only 6min after origin time.
Mwpd is a rapid size estimate for very large and very long duration earthquakes; for tsunami warning.https://t.co/IjO3uk81xJhttps://t.co/INpfQ6nPJa pic.twitter.com/twnPxiZrkC
— Anthony Lomax 🌍🇪🇺 (@ALomaxNet) January 29, 2020
Let's talk about earthquake shaking. Ppl who feel earthquakes sometimes talk about "rollers" versus "shakers." The shaking you feel in any earthquake depends to some extent on geology: if you live in a valley, you tend to feel waves sloshing, or rolling.
— Susan Hough (@SeismoSue) January 29, 2020
Looks as if there was a tiny little #tsunami (few centimetres) caused by the M7.7 #earthquake in the #Caribbean yesterday. Gauge data from https://t.co/GfWqeHMv4r pic.twitter.com/Z4FMh8iSxq
— Christoph Gruetzner (@ch_gruetze) January 29, 2020
— Jason "Jay" R. Patton (@patton_cascadia) February 1, 2020
- Frisch, W., Meschede, M., Blakey, R., 2011. Plate Tectonics, Springer-Verlag, London, 213 pp.
- Hayes, G., 2018, Slab2 – A Comprehensive Subduction Zone Geometry Model: U.S. Geological Survey data release, https://doi.org/10.5066/F7PV6JNV.
- Holt, W. E., C. Kreemer, A. J. Haines, L. Estey, C. Meertens, G. Blewitt, and D. Lavallee (2005), Project helps constrain continental dynamics and seismic hazards, Eos Trans. AGU, 86(41), 383–387, , https://doi.org/10.1029/2005EO410002. /li>
- Jessee, M.A.N., Hamburger, M. W., Allstadt, K., Wald, D. J., Robeson, S. M., Tanyas, H., et al. (2018). A global empirical model for near-real-time assessment of seismically induced landslides. Journal of Geophysical Research: Earth Surface, 123, 1835–1859. https://doi.org/10.1029/2017JF004494
- Kreemer, C., J. Haines, W. Holt, G. Blewitt, and D. Lavallee (2000), On the determination of a global strain rate model, Geophys. J. Int., 52(10), 765–770.
- Kreemer, C., W. E. Holt, and A. J. Haines (2003), An integrated global model of present-day plate motions and plate boundary deformation, Geophys. J. Int., 154(1), 8–34, , https://doi.org/10.1046/j.1365-246X.2003.01917.x.
- Kreemer, C., G. Blewitt, E.C. Klein, 2014. A geodetic plate motion and Global Strain Rate Model in Geochemistry, Geophysics, Geosystems, v. 15, p. 3849-3889, https://doi.org/10.1002/2014GC005407.
- Meyer, B., Saltus, R., Chulliat, a., 2017. EMAG2: Earth Magnetic Anomaly Grid (2-arc-minute resolution) Version 3. National Centers for Environmental Information, NOAA. Model. https://doi.org/10.7289/V5H70CVX
- Müller, R.D., Sdrolias, M., Gaina, C. and Roest, W.R., 2008, Age spreading rates and spreading asymmetry of the world’s ocean crust in Geochemistry, Geophysics, Geosystems, 9, Q04006, https://doi.org/10.1029/2007GC001743
- Pagani,M. , J. Garcia-Pelaez, R. Gee, K. Johnson, V. Poggi, R. Styron, G. Weatherill, M. Simionato, D. Viganò, L. Danciu, D. Monelli (2018). Global Earthquake Model (GEM) Seismic Hazard Map (version 2018.1 – December 2018), DOI: 10.13117/GEM-GLOBAL-SEISMIC-HAZARD-MAP-2018.1
- Silva, V ., D Amo-Oduro, A Calderon, J Dabbeek, V Despotaki, L Martins, A Rao, M Simionato, D Viganò, C Yepes, A Acevedo, N Horspool, H Crowley, K Jaiswal, M Journeay, M Pittore, 2018. Global Earthquake Model (GEM) Seismic Risk Map (version 2018.1). https://doi.org/10.13117/GEM-GLOBAL-SEISMIC-RISK-MAP-2018.1
- Zhu, J., Baise, L. G., Thompson, E. M., 2017, An Updated Geospatial Liquefaction Model for Global Application, Bulletin of the Seismological Society of America, 107, p 1365-1385, https://doi.org/0.1785/0120160198
- Benz, H.M., Tarr, A.C., Hayes, G.P., Villaseñor, Antonio, Furlong, K.P., Dart, R.L., and Rhea, Susan, 2011. Seismicity of the Earth 1900–2010 Caribbean plate and vicinity: U.S. Geological Survey Open-File Report 2010–1083-A, scale 1:8,000,000.
- Franco, A., C. Lasserre H. Lyon-Caen V. Kostoglodov E. Molina M. Guzman-Speziale D. Monterosso V. Robles C. Figueroa W. Amaya E. Barrier L. Chiquin S. Moran O. Flores J. Romero J. A. Santiago M. Manea V. C. Manea, 2012. Fault kinematics in northern Central America and coupling along the subduction interface of the Cocos Plate, from GPS data in Chiapas (Mexico), Guatemala and El Salvador in Geophysical Journal International., v. 189, no. 3, p. 1223-1236. DOI: https://doi.org/10.1111/j.1365-246X.2012.05390.x
- Garcia-Casco, A., Projenza, J.A., Iturralde-Vinent, M.A., 2011. Subduction Zones of the Caribbean: the sedimentary, magmatic, metamorphic and ore-deposit records UNESCO/iugs igcp Project 546 Subduction Zones of the Caribbean in Geologica Acta, v. 9, no., 3-4, p. 217-224
- Mann, P., Tyburski, S.A., and Rosencratz, E., 1991. Neogene development of the Swan Islands restraining-bend complex, Caribbean Sea in Geology, v. 19, p. 823-826.
- Symithe, S., E. Calais, J. B. de Chabalier, R. Robertson, and M. Higgins, 2015. Current block motions and strain accumulation on active faults in the Caribbean in J. Geophys. Res. Solid Earth, v. 120, p. 3748–3774, doi:10.1002/2014JB011779.
- Ten Brink, U.S., Coleman, D.F., and Dillon, W.P., 2002. The nature of the crust under Cayman Trough from gravity in Marine and Petroleum Geology, v. 119, p. 971-987.
References:
Basic & General References
Specific References
Return to the Earthquake Reports page.