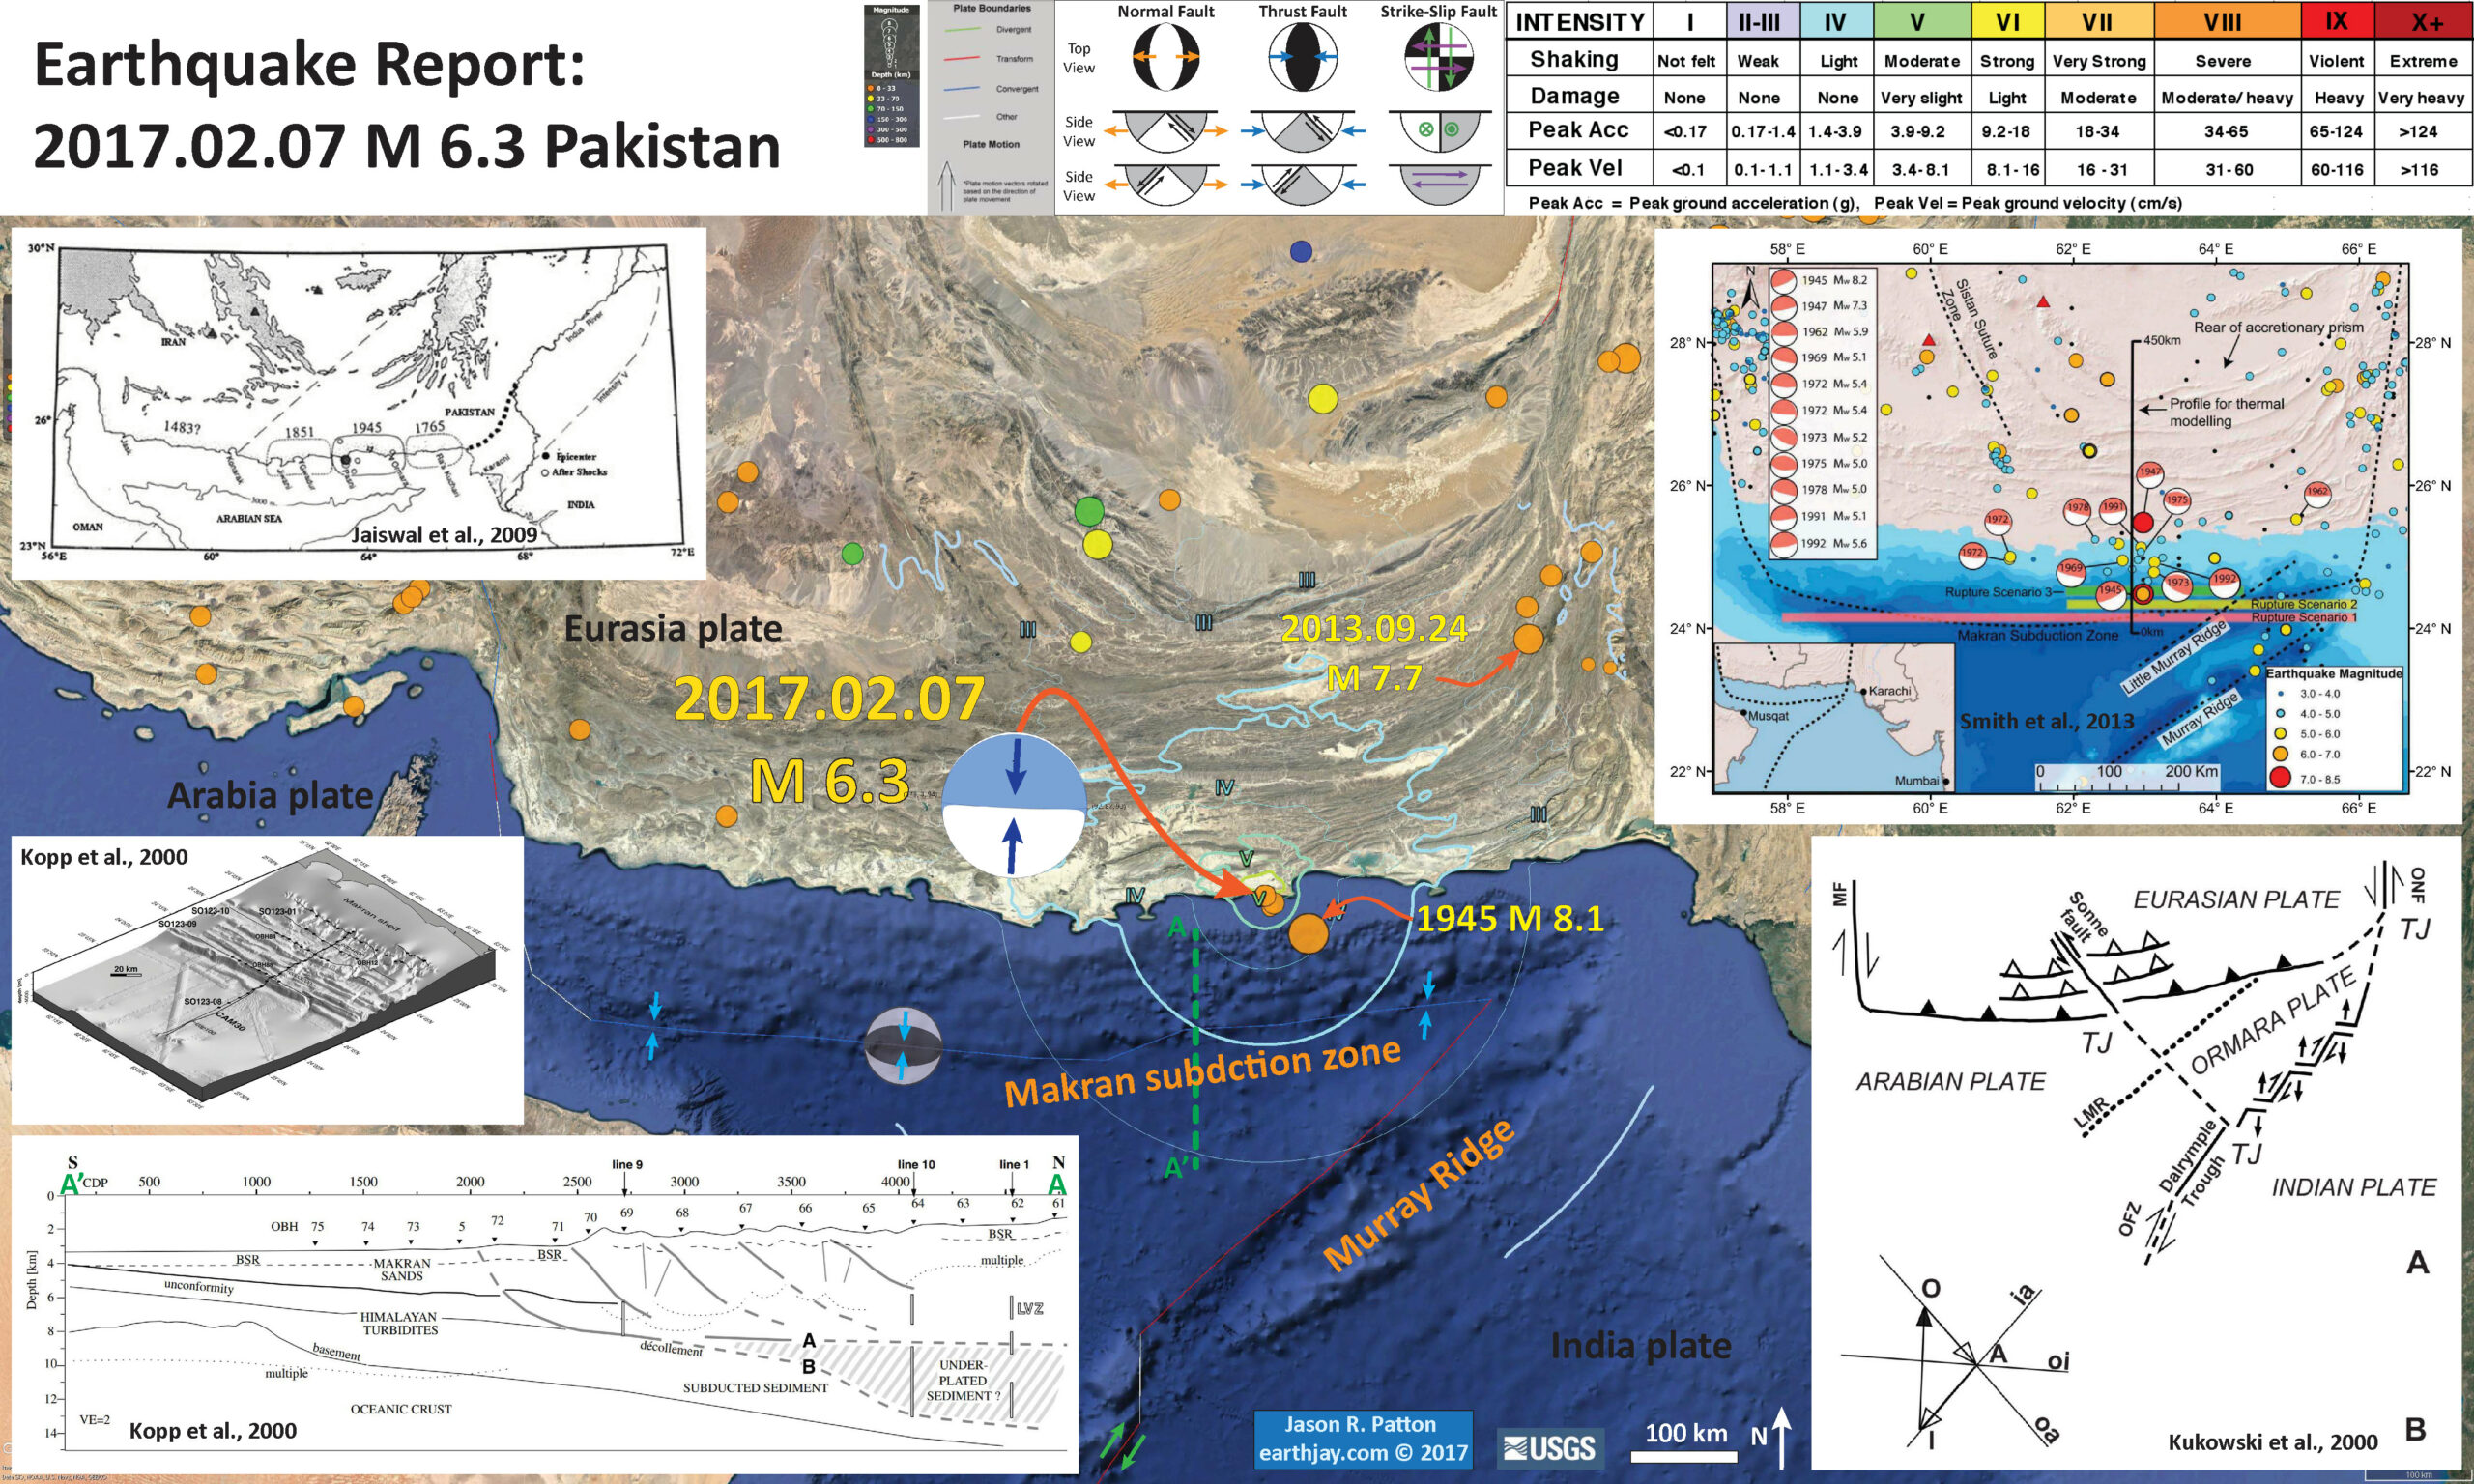
There was a good sized earthquake along the Makran subduction zone. This subduction zone is a convergent plate boundary where the Arabia plate subducts (goes beneath) northwards under the Eurasia plate. There has been one aftershock reported by the USGS. These earthquakes are in the region of an earthquake with a magnitude of M 8.1 from 1945, which generated a large tsunami in the region. There are some reports of damage. There was an aftershock to the 1945 earthquake in 1947, when there was an earthquake with a magnitude of M 6.8 occurred in almost the same location as this 2017 earthquake. However, the 2017 M 6.3 is much deeper. There is some indication that there may be underplated sediment (sediment that is scraped off of the downgoing plate and attached to the upper plate). Perhaps the 1945 and 1947 earthquakes are on a shallower fault. Perhaps their locations are poorly resolved due to poor seismometer instrument coverage at that time.
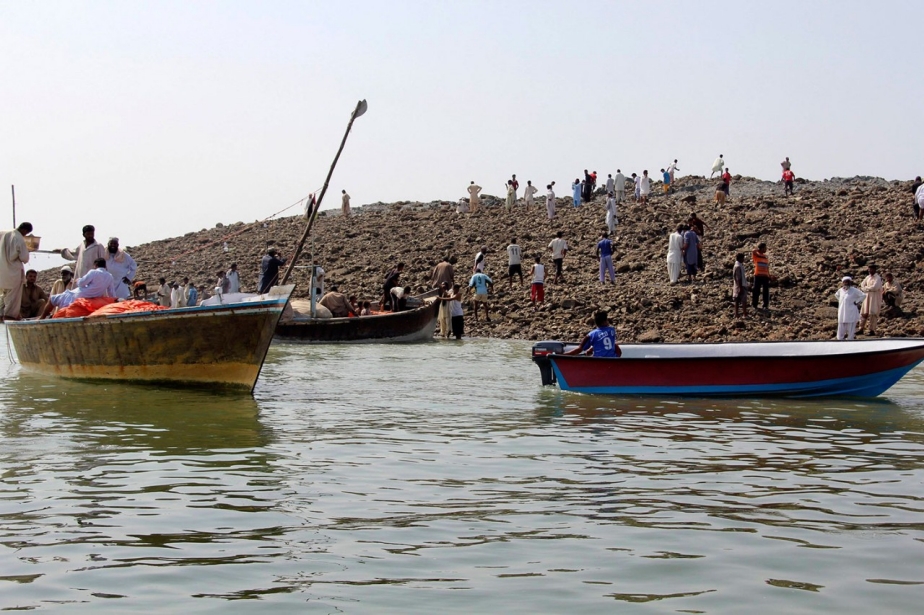
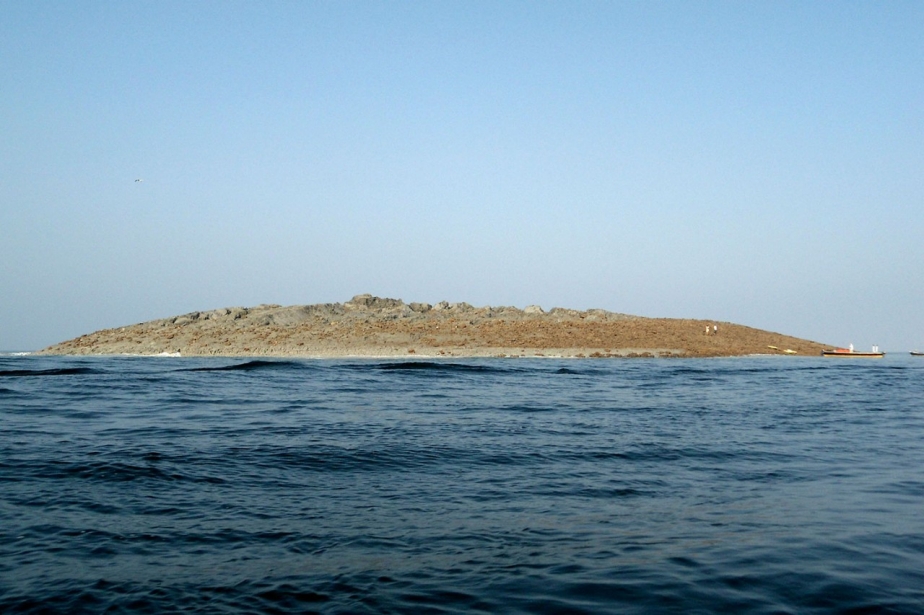
This is also a region that experienced some effects from an earthquake further to the north in 2013. On 2013.09.24 there was an earthquake with a magnitude of M 7.7 that caused ground shaking throughout the region, as well as an interesting feature that arose from the seafloor along the continental shelf (what this feature is called is in debate; some called it a mud volcano). Here is my brief report on the 2013 earthquake.
-
Here are the USGS websites for these earthquakes.
- 2017.02.07 22:03 (UTC) M 6.3
- 2017.02.08 11:02 (UTC) M 5.2
- 2013.09.24 11:29 (UTC) M 7.7
- 1945.11.27 21:56 (UTC) M 8.1
Below I present my interpretive poster for this M 6.3 earthquake. I include epicenters for earthquakes from the past century with magnitudes M ≥ 6.0. Here is the kml I created from the USGS earthquakes website.
I include some inset figures in the poster below.
- In the upper right corner I include a map that shows historic earthquakes in the region (Smith et al., 2013). The authors plot focal mechanisms for selected earthquakes. These earthquakes all have similar solutions as this 2017 M 6.3 earthquake. Given the low angle of subduction along this fault system, and that all these fault plane solutions have either a shallow fault or a steep fault, I suspect that these earthquakes are all occurring on a shallowly dipping fault that is southward vergent. Vergence refers to which direction the fault is oriented in the up-dip direction. The Makran subduction zone fault dips down to the north, so is southward vergent.
- In the lower right corner I include a line drawing of the faults and plate boundaries in this region (Kukowski et al., 2000). I like this figure because it is simple yet includes some details of the complexity of the faulting in this region (especially the Murray Ridge, which is a series of enechelon east-west striking spreading ridges offset by north-east striking strike-slip faults, forming Dalyrimple Trough). This detail is missing on the USGS plate boundary fault (the red line in the main interpretive poster, as plotted in Google Earth). The paper from which this is taken is a paper where they document the northwest striking Sonne fault that crosses oblique to the fold and thrust belt of the Makran margin.
- In the lower left corner is are two figures from Kopp et al. (2000). The upper panel shows a low angle oblique view of the bathymetry for the Makran margin in this region. The lower panel shows their interpretation of seismic reflection data that they presented in that paper. This profile is located on the upper panel, as well as on the interpretive poster as a green dashed line labeled A-A.’ These earthquakes occurred to the east of the northernmost extent of this seismic profile, but this profile gives us a good idea about the general configuration of the accretionary prism here.
- In the upper left corner is a figure from Jaiswal et al. (2009) that shows some regions where large subduction zone tsunamigenic earthquakes have happened. There has been much work done on the 1945 tsunami (modeling, interviewing of observers, etc.).
-
Here are some of the figures that I included in the poster, as well as some additional related figures. I include their original figure captions as blockquotes beneath the figures.
- Here is the Smith et al. (2013) figure showing the historic earthquakes and their focal mechanisms.
Location map of the Makran Subduction Zone. Earthquakes from post-1960 (and pre-1960 with assigned magnitudes) from the EHB Catalog [Engdahl et al., 1998] are illustrated by circles. Those from pre-1960 with no assigned magnitude are small black dots. Significant possible plate boundary events with focal mechanisms from Byrne et al. [1992] and the Global CMT Catalog (magnitudes in inset table). Bathymetry is from the GEBCO_08 Grid [Smith and Sandwell, 1997]. Strike lengths of three rupture scenarios for magnitude calculations are indicated by shaded bars. The thermal modeling profile is marked as a black line. Triangles are volcanoes.
- Here are two figures from Kukowski et al. (2000) showing the faults and their interpretations of this large strike-slip fault that cuts oblique to the margin.
A: Plate tectonic sketch indicating position and framework of newly identified Ormara plate. ONF is Ornach Nal fault; OFZ is Owen Fracture Zone;TJ is triple junction. For symbols see Figure 1 and text. B:Velocity diagram for triple junction among Arabian, Ormara, and Indian plates.
A:Three-dimensional perspective, shaded bathymetric image of Makran accretionary wedge, showing Sonne strike-slip fault and erosive canyons crossing wedge. B:Tectonic interpretation showing offset of accretionary ridges and extensional jog of Sonne fault, which may result from some rotation of Ormara plate.
- Here are a series of figures from Kopp et al. (2000). The upper figure is the low angle oblique view of the region that they studied. The lower figure includes the seismic data and their interpretation (that led to their interpretation presented in the interpretive poster above).
Bathymetric map of the MAKRAN accretionary wedge with profile and OBH locations. The labelled lines/OBH are discussed in the text.
Prestack depth migration and interpretation of CAM30. The migration was calculated with velocities derived from depth-focusing (cdp 0±3200) and semblance (cdp 3200±4800) analysis. A post-migration radon filter was applied to reduce residual multiples. The interpretation is based on the distinct seismic signature of sedimentary reflectors in the abyssal plain and within the ®rst two thrusts (Fruehn et al., 1997).
- There was a semi-recent paper where some important discoveries were made regarding the sediment routing along this margin (Bourget et al., 2011). This paper includes material that may eventually lead to an earthquake history for this margin. I include a few of their figures below.
- This figure shows the geomorphology of the Makran continental margin and how the authors interpret there to be different sedimentary pathways.
- This is a illustration showing how some turbidity currents may interact with the submarine landforms.
- This figure links the offshore sediment routing systems with the onshore sources of sediment.
- This is their summary illustration showing their interpretation of the factors controlling sedimentation along this margin.
Slope map of the Makran turbidite system, showing the seven canyon systems (yellow), their main pathway (red) and the main architectural elements in the abyssal plain. Longitudinal depth profiles of these canyon pathways are shown in Fig. 4. The cross-section (below) shows a general longitudinal profile of the Makran margin from the upper slope (Canyon 5) to the Oman abyssal plain, with main slope changes.
Interpretative cartoon showing the sedimentary processes within the plunge pools at the deformation front.
(A) 3D onshore topography (SRTM data) and offshore bathymetry (MARABIE and CHAMAK cruises merged with the ETOPO 1 database) of the Makran accretionary prism, showing the structural organization of the margin. Significant streams/rivers and submarine canyons are drawn. Note the shallowing of the deformation front depth (red line) towards the east, joining the western edge of the India plate in the triple-junction area (simplified after Ellouz-Zimmermann et al., 2007b; Mouchot, 2009). (B) Along-strike evolution of the depth of the deformation front (black dashed line) and the length of the Makran submarine canyons (red continuous line). (C) Along-strike evolution of the Makran watersheds size (km2). Note that the largest watersheds are confined in the eastern Makran and Kirthar range, corresponding to the triple-junction area where the higher reliefs are observed.
Summary of the impact of the variability of the forcing parameters (tectonics and fluvial input) on the theoretical ‘equilibrium’ conditions of the Makran canyons, and its implication for sediment distribution and turbidite system architecture at large (continental slope) and small (architectural elements in the abyssal plain) scales of observation.
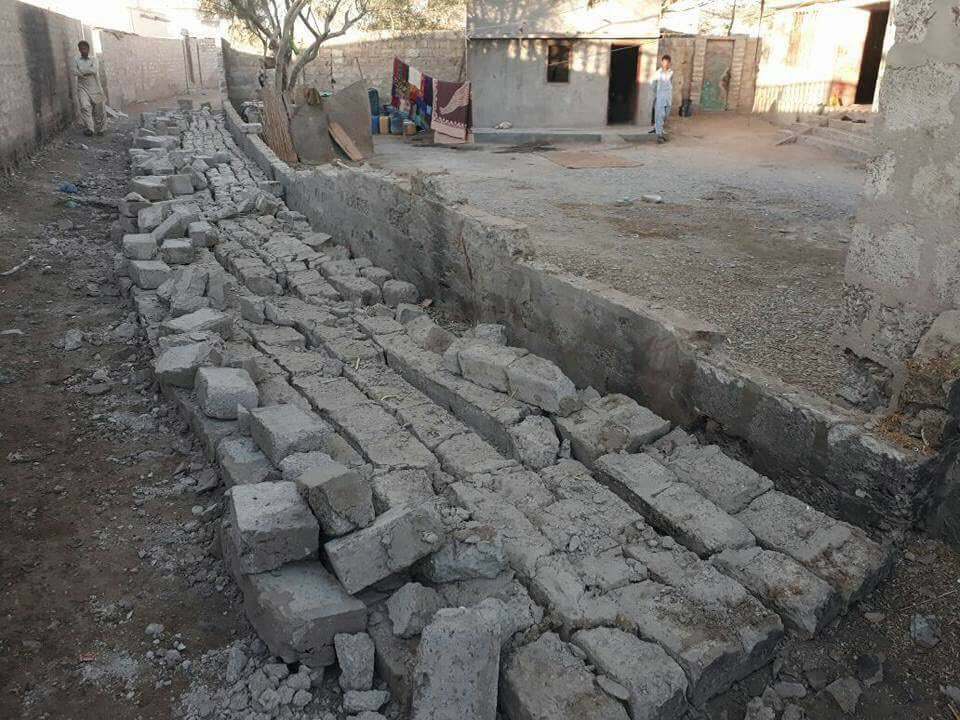
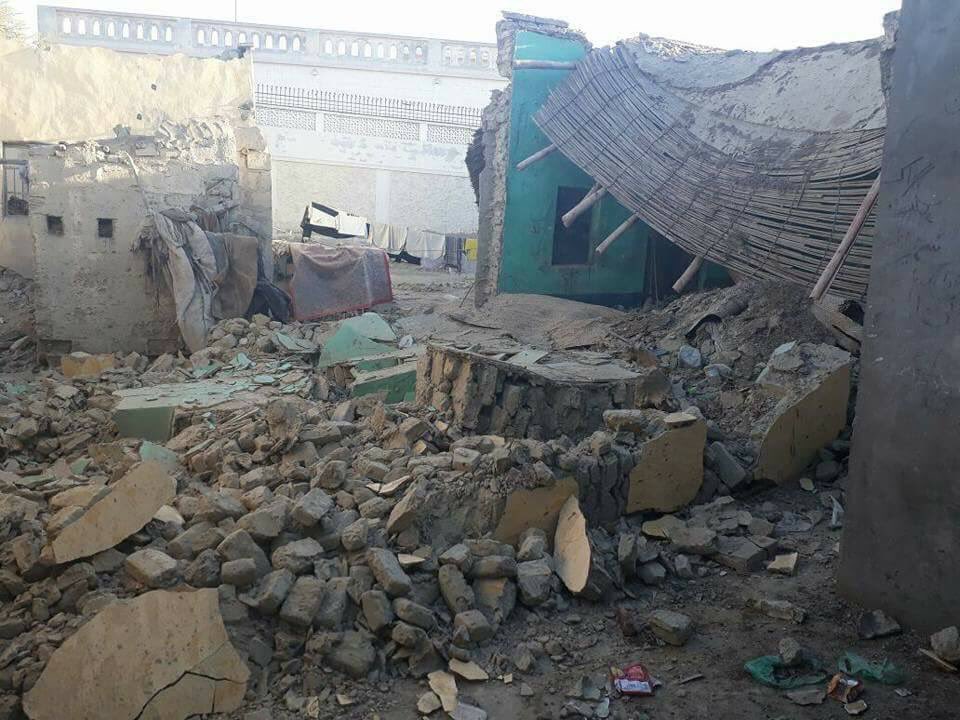
- Here are some photos of some damage from the town of Pasni in Gwadar. These were posted on social media by Faiz Baluch.
M 7.7 Earthquake Observations
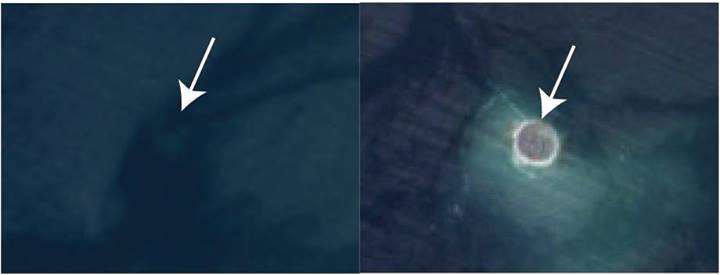
- The 2013 M 7.7 Pakistan earthquake produced some interesting effects along the coast. Here are some photos of the island that formed as a result of this earthquake.
- Here is an aerial image of the island published by RT as acquired by NASA.
- Here is a satellite image of before and after shots as prepared by Danielle Madugo.
- Here are three photos taken from people who visited the island.
- This is a fascinating observation. Following the 1945 M 8.1 earthquake, a similar island formed in this region. Schluter et al. (2002) published a paper where they put forth their interpretations for the formation of these mud volcanoes.
No. of house & walls collapsed due to late night earthquake in coastal town of Pasni in Gwadar. No loss of lives reported. #Balochistan pic.twitter.com/q7pXfgk1IA
— Faiz Baluch (@Faiz_Baluch) February 8, 2017
References:
- Kopp, C., Fruehn, J., Flueh, E.R., Reichart, C., Kukoski, N., Bialas, J., and Klaeschen, D., 2000. Structure of the Makran subduction zone from wide-angle and reflection seismic data in Tectonophysics, p. 171-191
- Kukowski, N., Schilhorn, T., Flueh, E.R., and Huhn, K., 2000. Newly identified strike-slip plate boundary in the northeastern Arabian Sea in Geology, v. 28, no. 4, p. 355-358.
- Schluter, H.U., Prexl, A., Gaedicke, C., Roseser, H. , Reichert, C., Meyer, H., and von Daniels, C., 2002. The Makran accretionary wedge: sediment thicknesses and ages and the Origin of mud volcanoes in Marine Geology, v. 185, p. 219-232.
- Smith, G.L., McNeill, L.C., WEang, K., He, J., Henstock, T., 2013. Thermal structure and megathrust seismogenic potential of the Makran subduction zone in GRL v. 40, p. 1528-1533, doi:10.1002/grl.50374
