Last night we had an earthquake in the Bismarck Sea, a region that is formed by an oceanic spreading ridge and bordered to the north and to the south by subduction zones. This M = 5.3 earthquake is small in magnitude compared to the earthquakes that occur along the New Britain trench to the south. Here is the USGS web page for this earthquake.
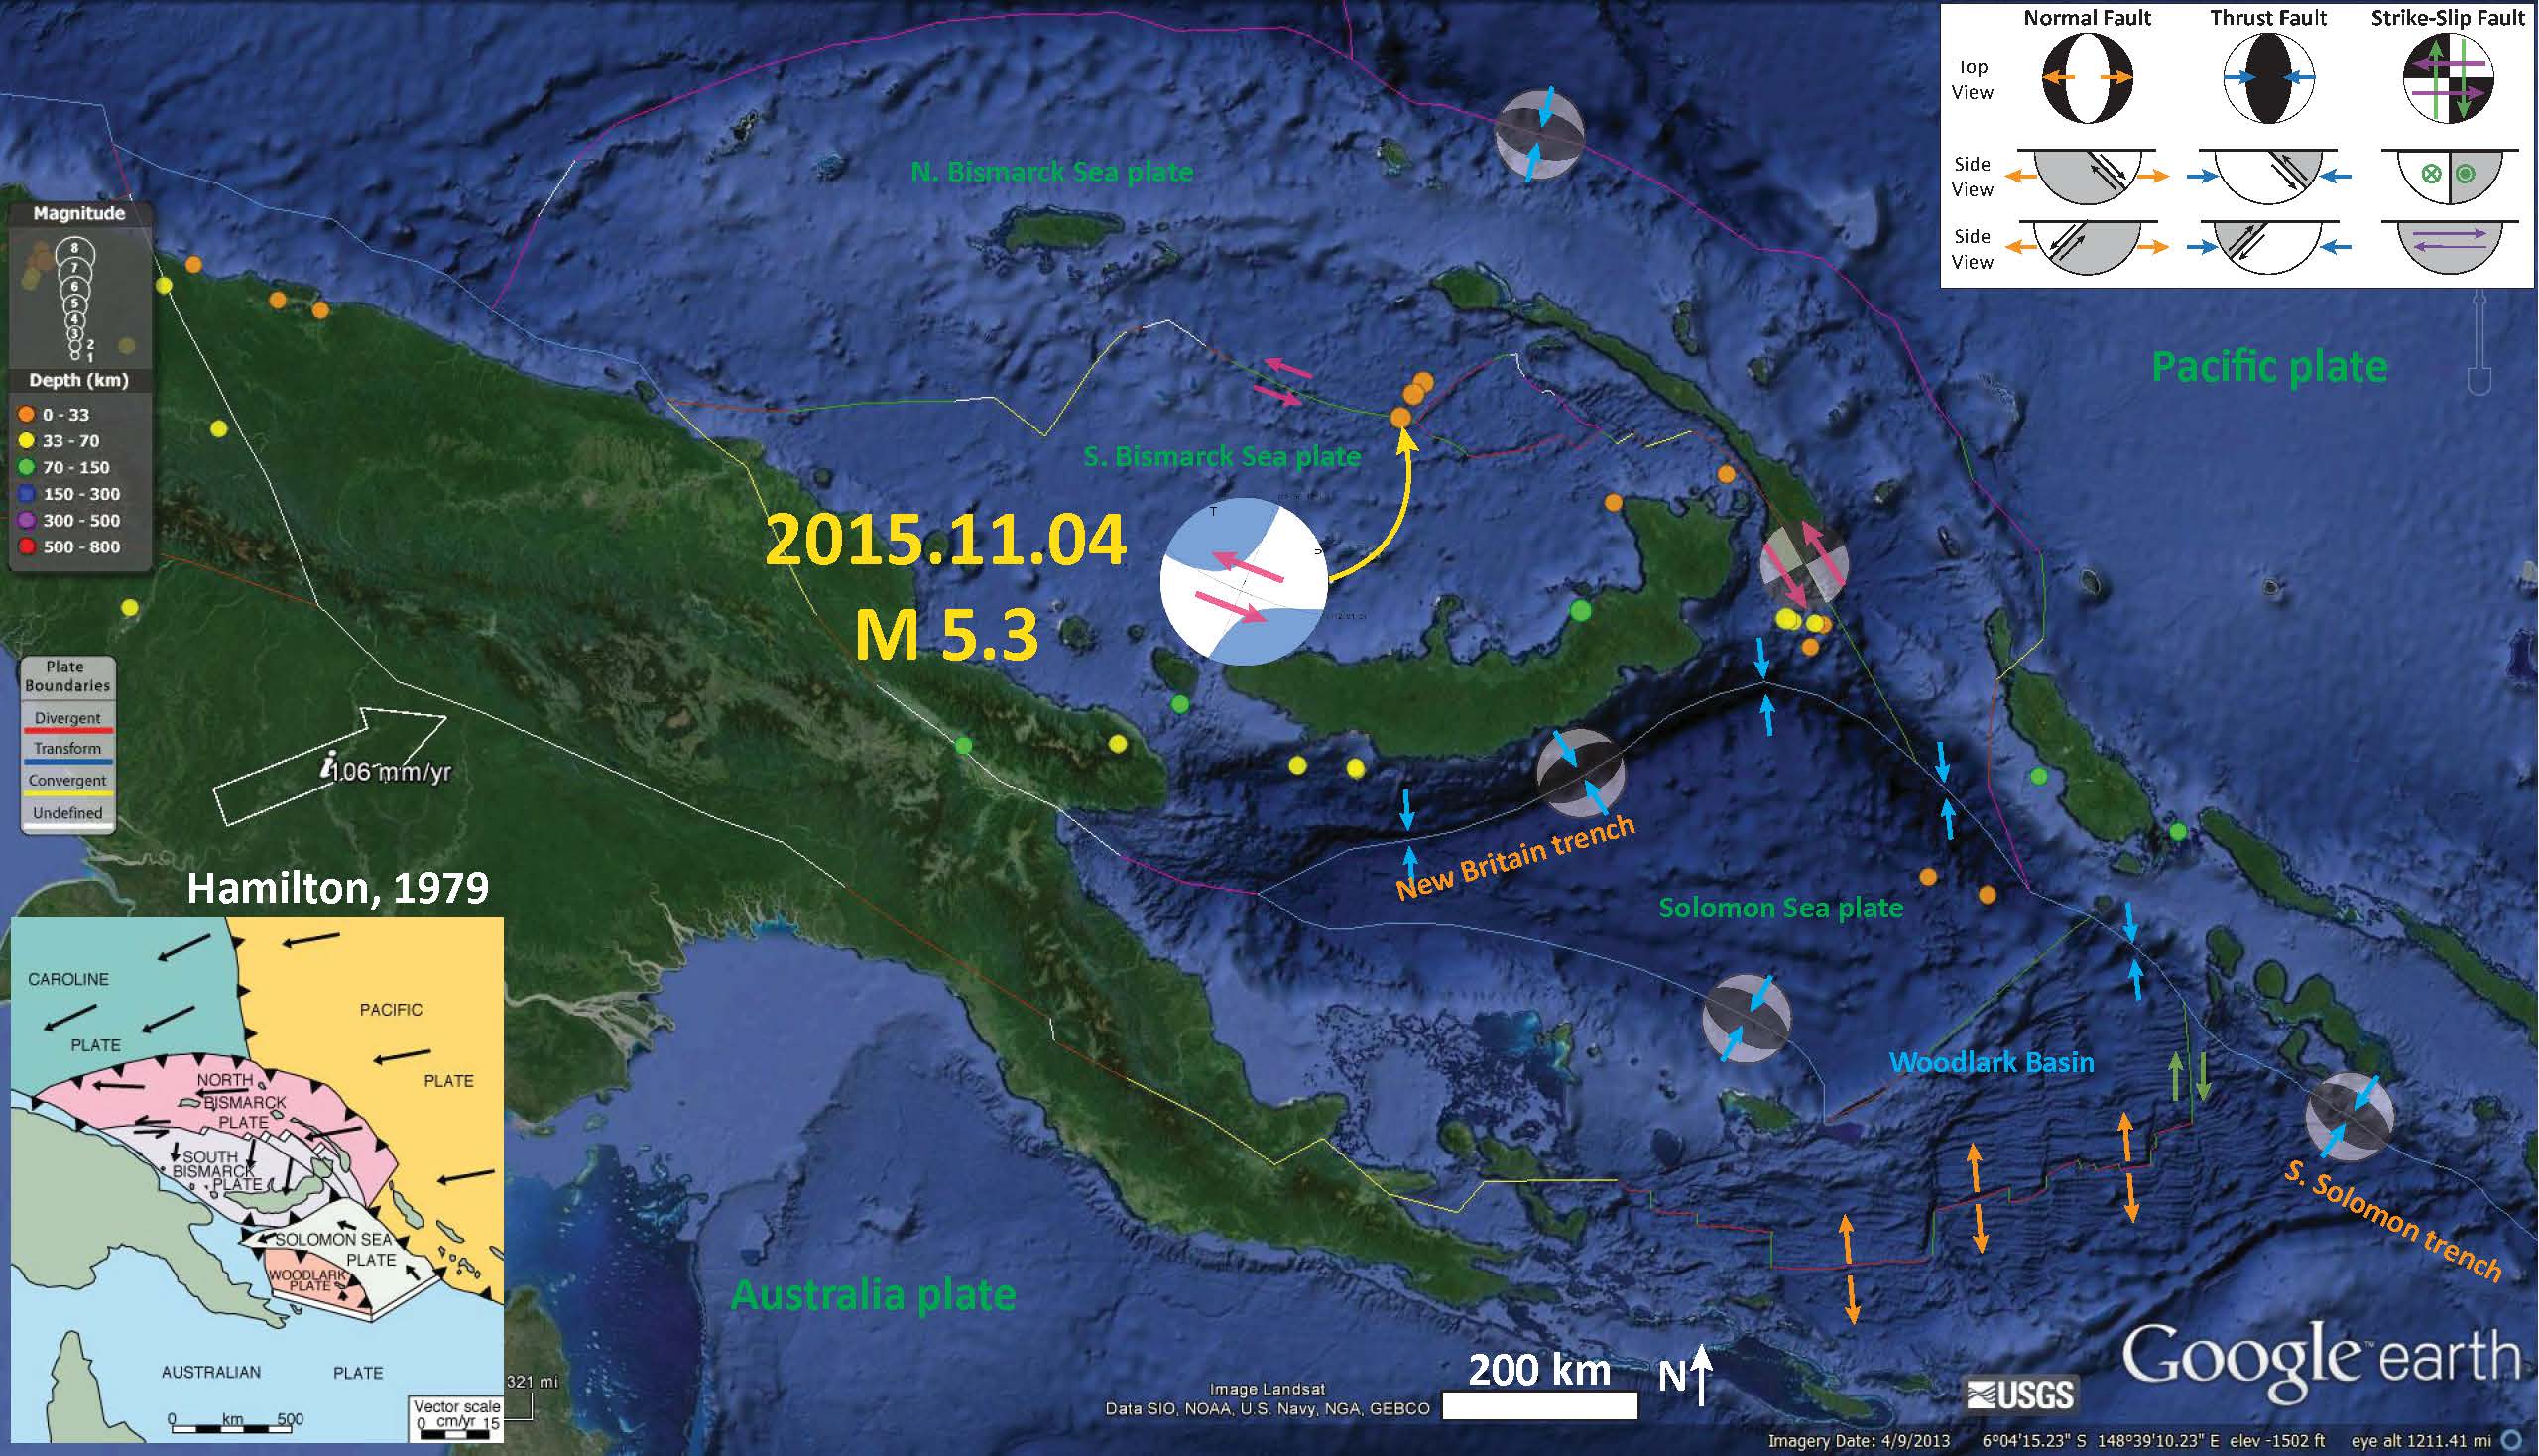
I placed a moment tensor / focal mechanism legend in the upper right corner of the map. There is more material from the USGS web sites about moment tensors and focal mechanisms (the beach ball symbols). Both moment tensors and focal mechanisms are solutions to seismologic data that reveal two possible interpretations for fault orientation and sense of motion. One must use other information, like the regional tectonics, to interpret which of the two possibilities is more likely.
Here is a map that shows the regional tectonics and the epicenters from the three ~M = 5.x earthquakes from yesterday. I plot the moment tensor from the largest of these, the M = 5.3 earthquake. This M = 5.3 earthquake lies along a transform plate boundary (a strike slip fault system that connects two spreading ridges) that is a configuration that would lead to left lateral motion. Therefore, I interpret this earthquake to have been a left-lateral strike slip earthquake.

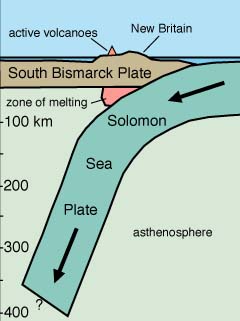
Here is a map modified from Hamilton (1979), also inset into the above map. This shows the relative motion between the Solomon Sea plate and the South Bismarck plate. There are some right-lateral transform faults in the South Bismarck plate (the upper plate), but today’s moment tensor and hypocentral depth support the hypothesis that this was on the megathrust.

This is a cross section that goes along with the above map. This shows the configuration of the megathrust. I got both of the graphics from Oregon State University, CEOAS here.
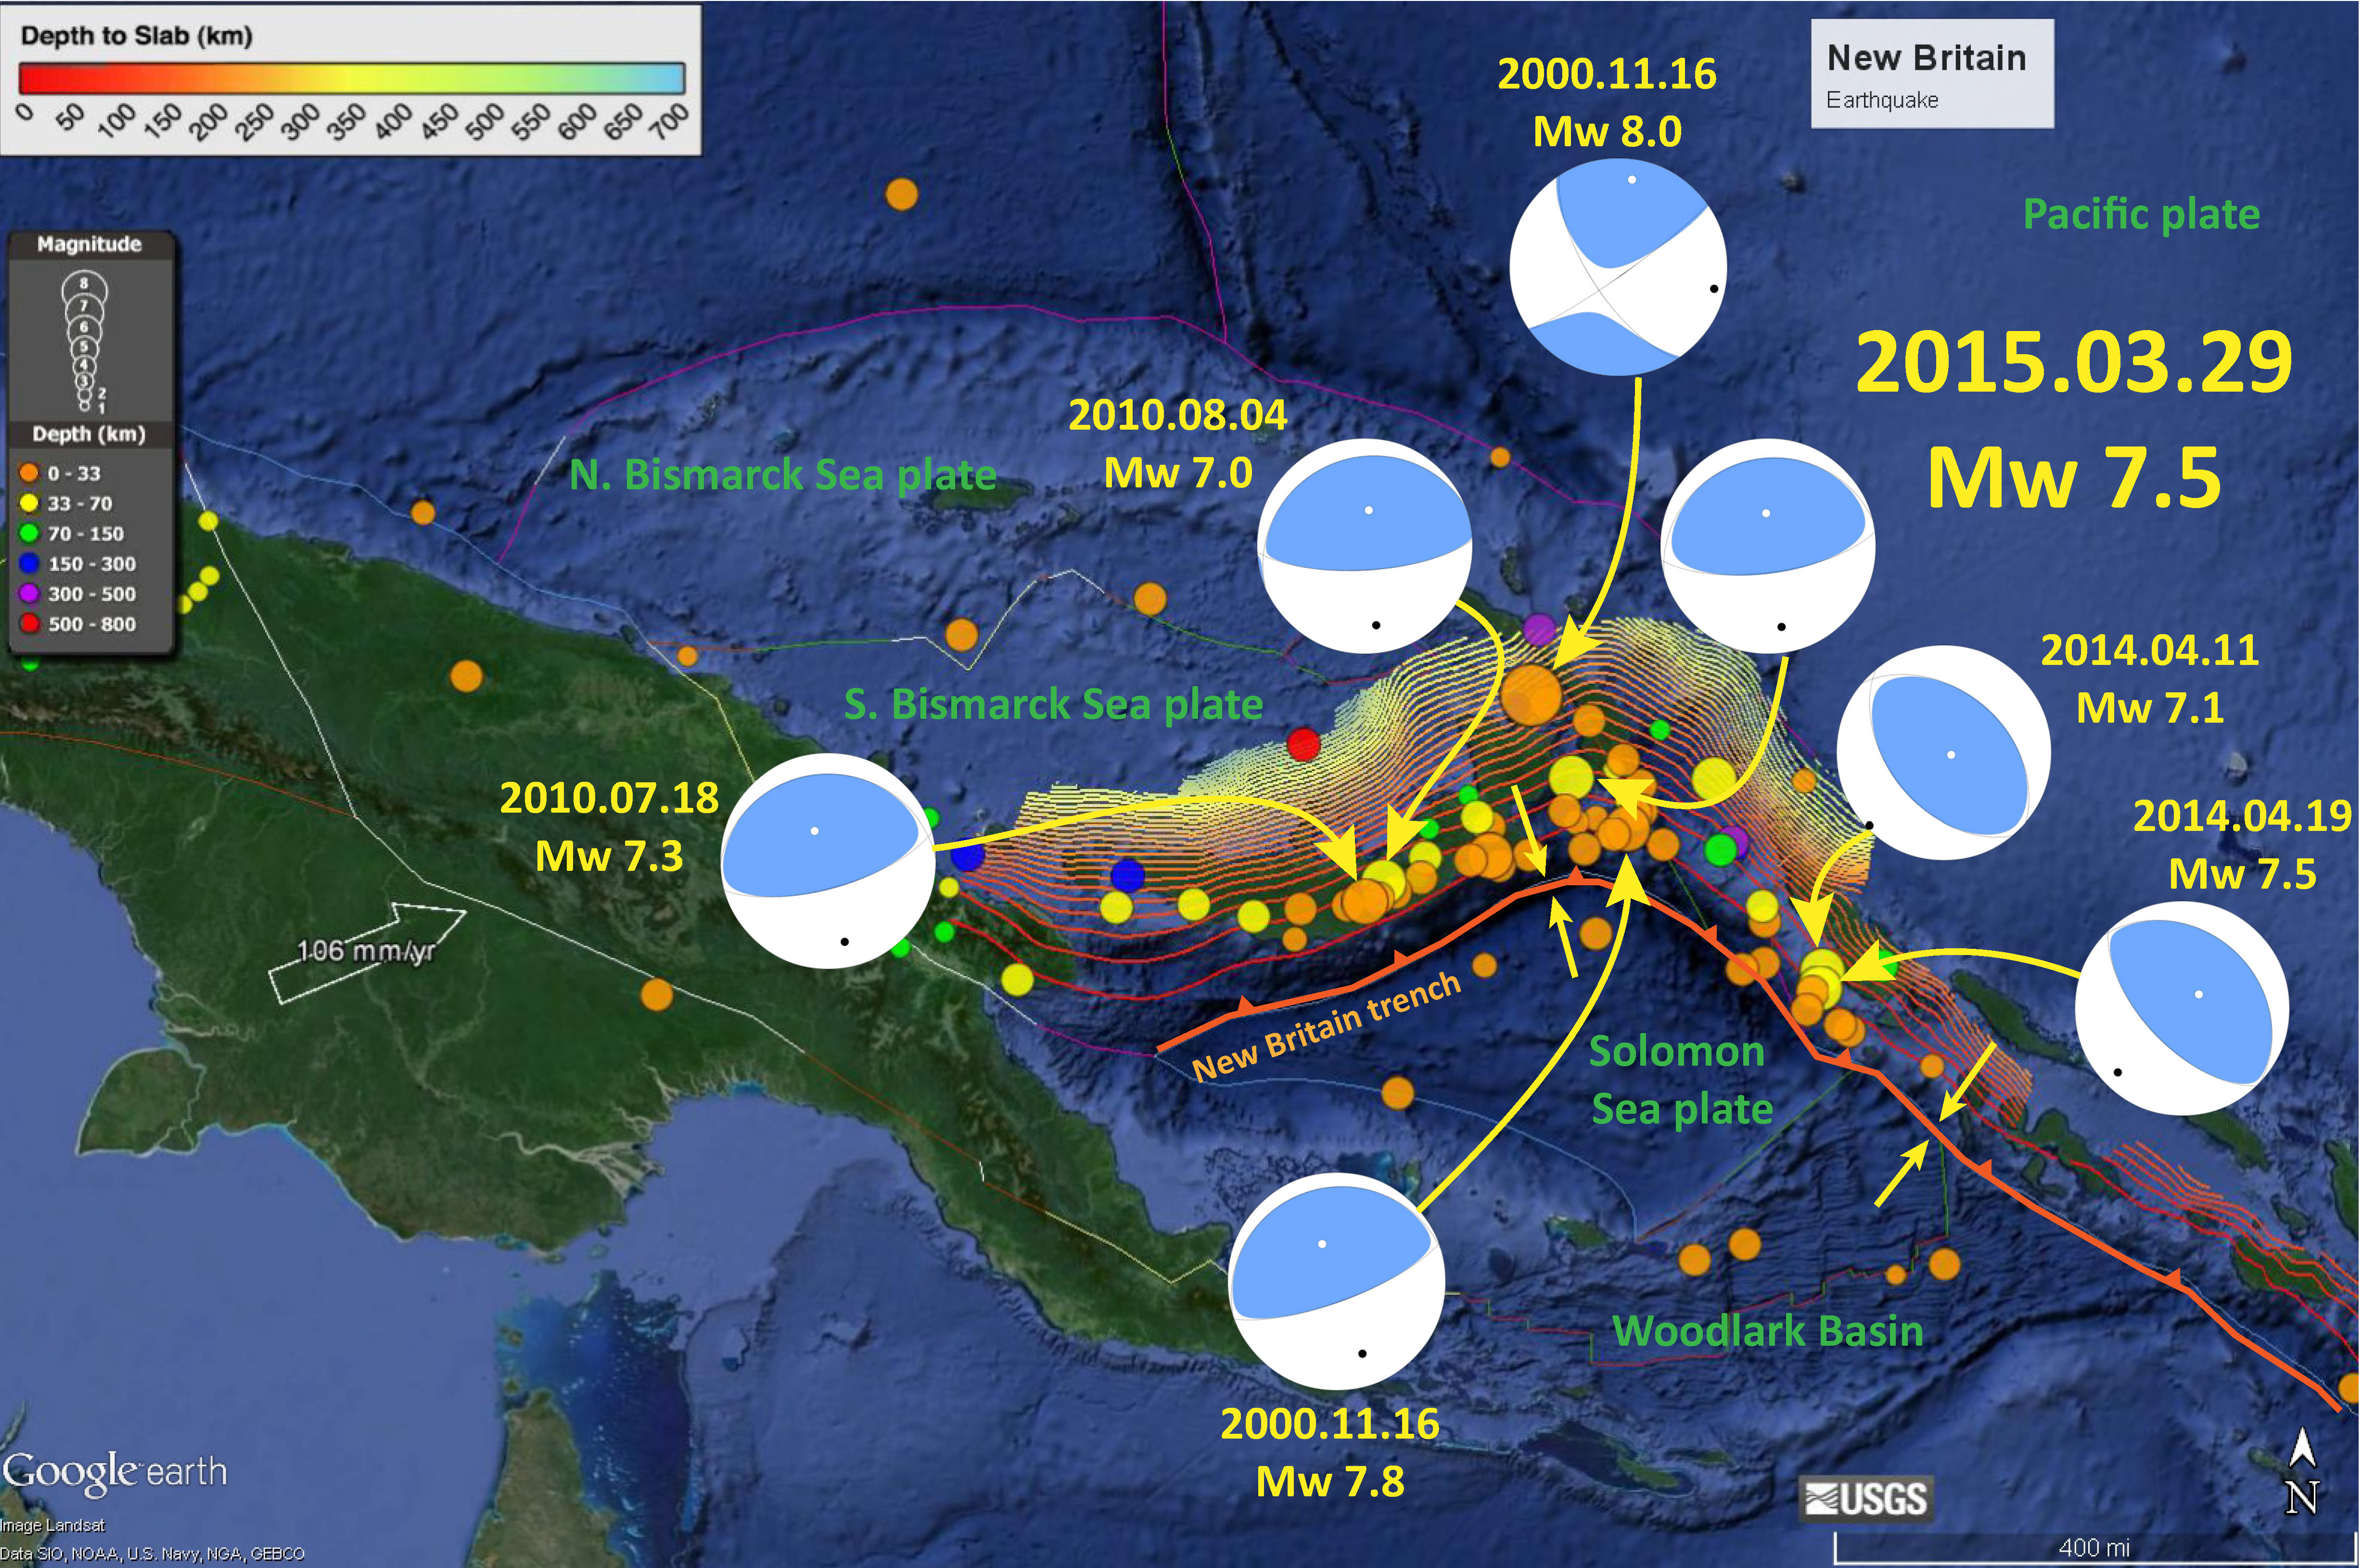
In March 2015, there was a swarm of earthquakes related to the subduction zone that forms the New Britain trench. Here is my report for that earthquake swarm. Below is a map that I prepared for that earthquake report. In the map below, I also plot the slab contours, the depth to the subduction zone fault interface (Hayes et al., 2012). These contours are based upon an interpretation of the location of the fault based largely upon seismicity. When one looks at the seismicity in cross-sectional view, it is clear that the hypocenters do not align to a curvilinear planar surface, which is how we generally view faults in our simplistic minds. Subduction zone fault systems are comprised of shear zones that may be tens to hundreds of meters thick. Also, there may be additional sub-parallel fault systems that accommodate some strain. Therefore, these contours are simply approximations of the position of the megathrust. Since nobody has ever been there to directly observe the location of the fault, these are probably the best estimate of its location.
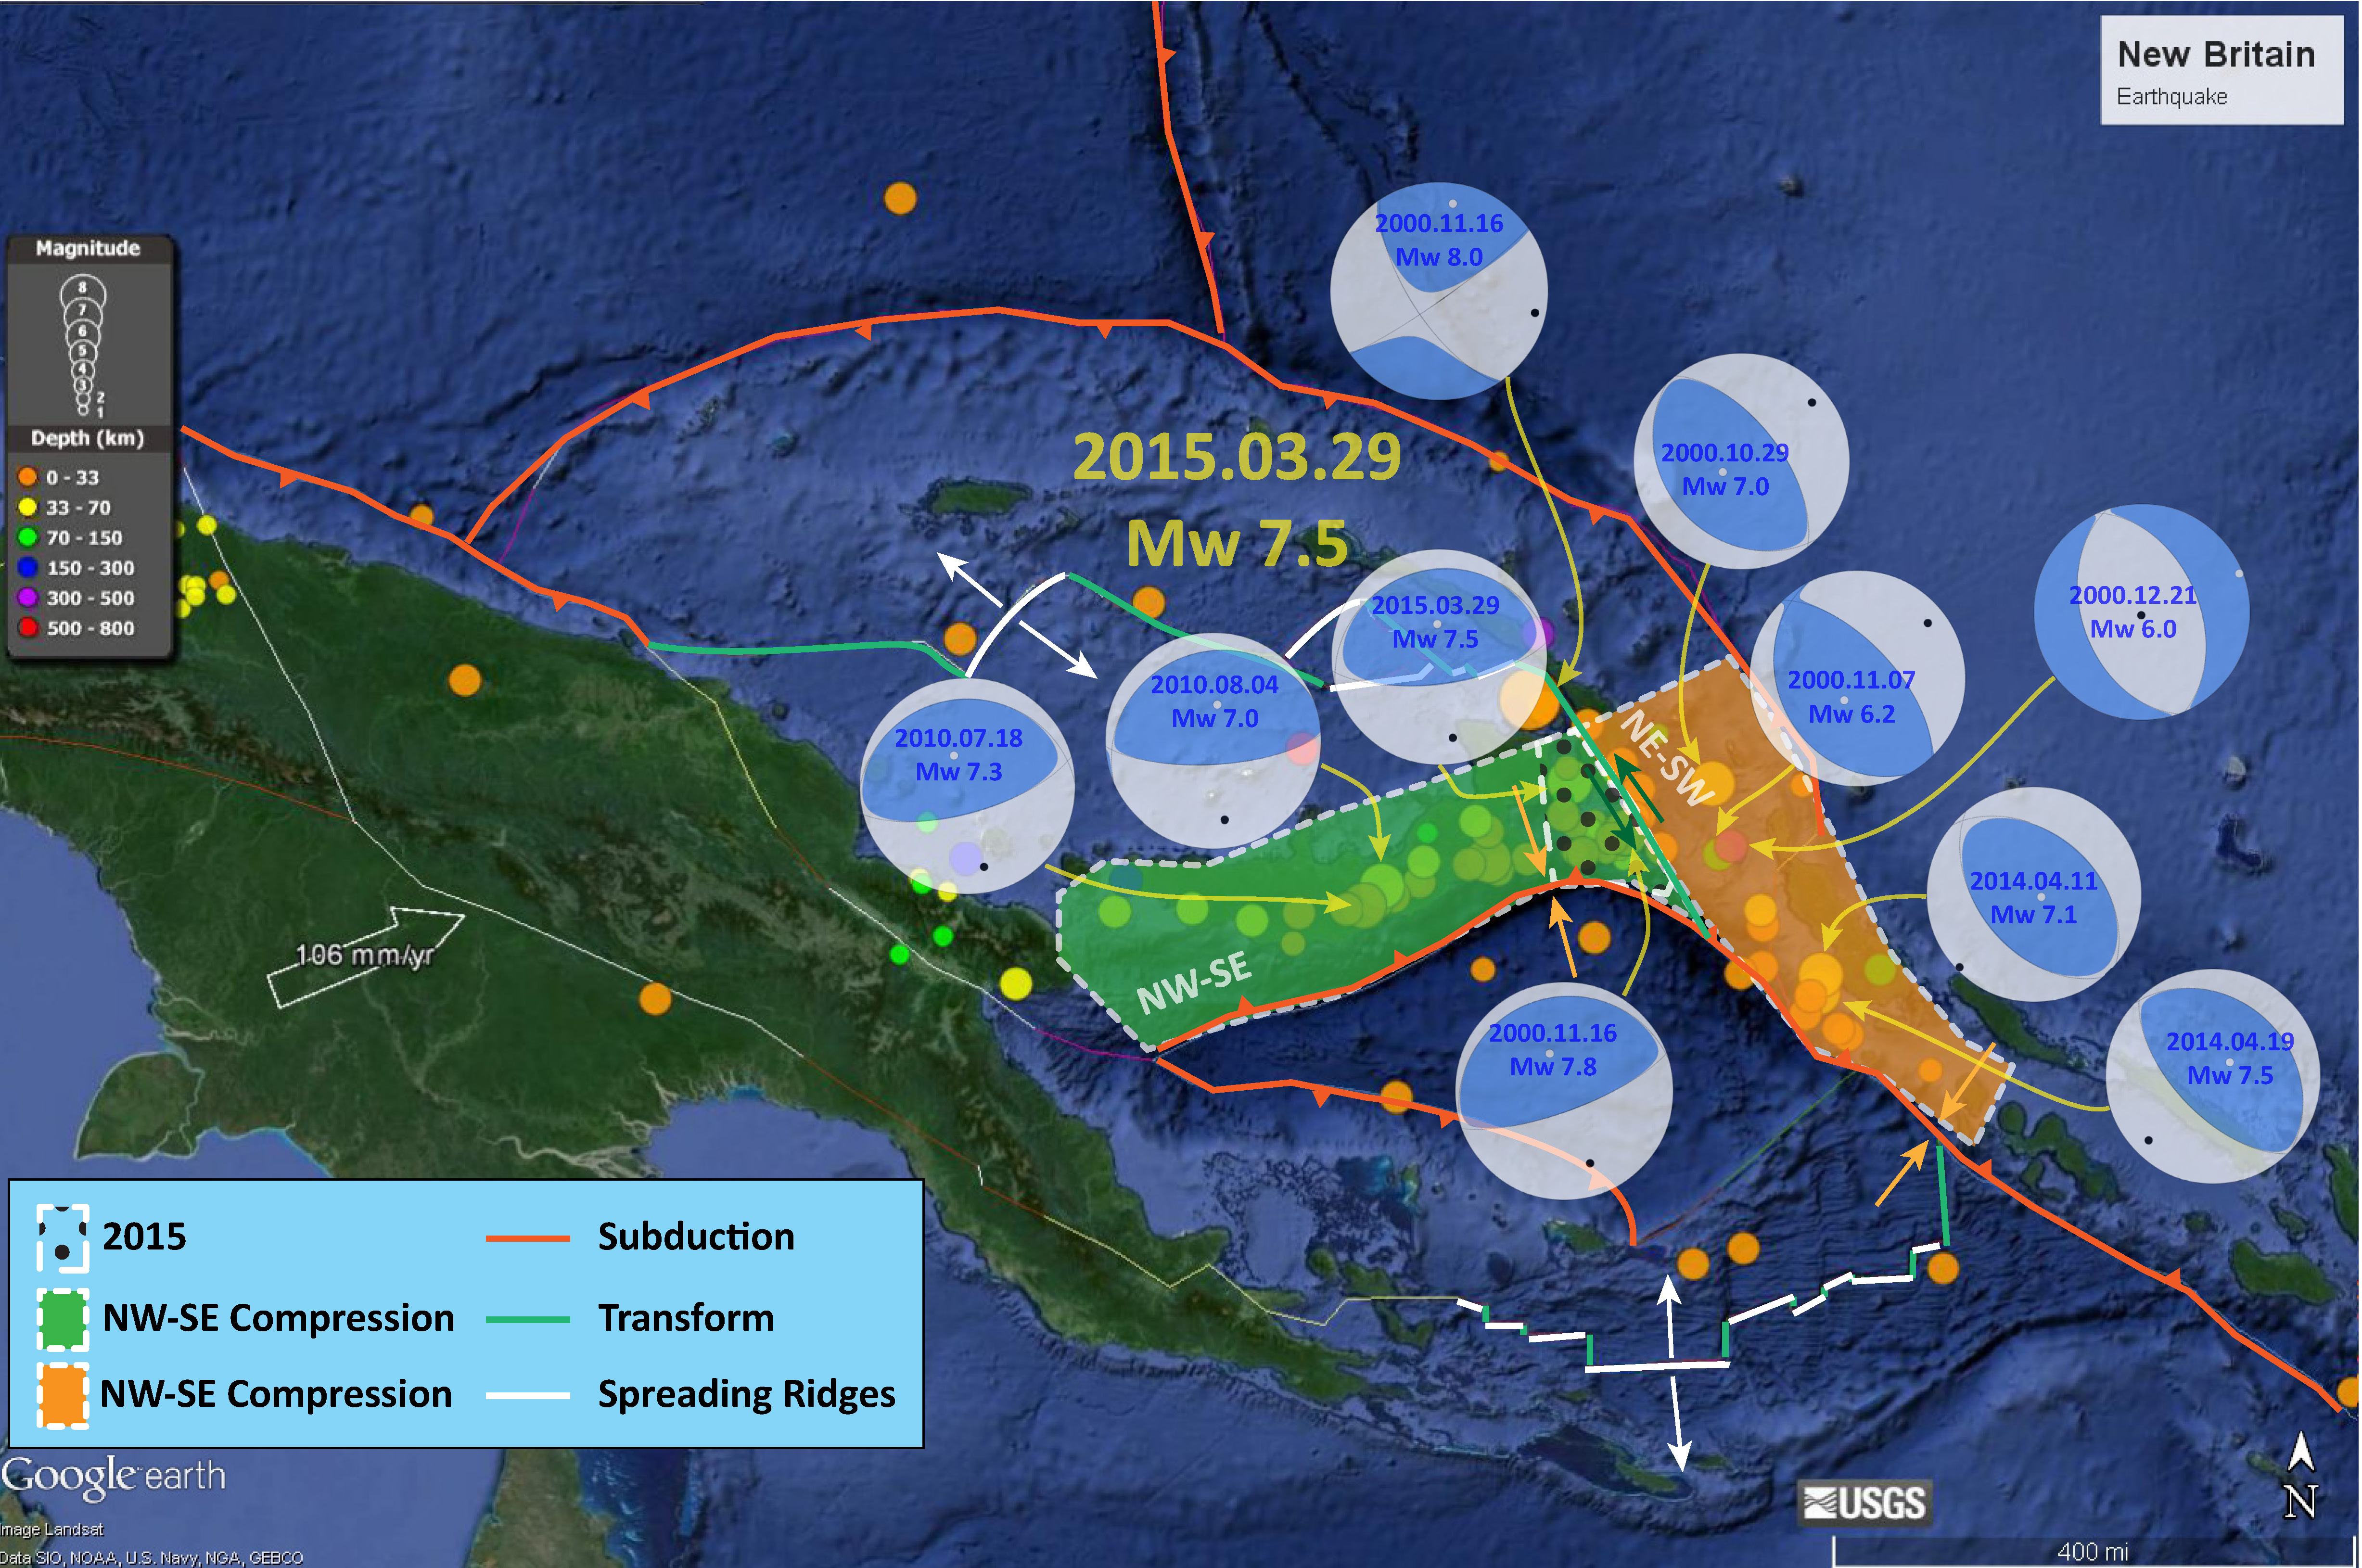
Following that swarm, I queried the USGS earthquake database for earthquakes with moment tensors plotted for the period from 2000-2015. Here is a report where I discuss these earthquakes. Below is a map that presents these earthquakes with their moment tensors.
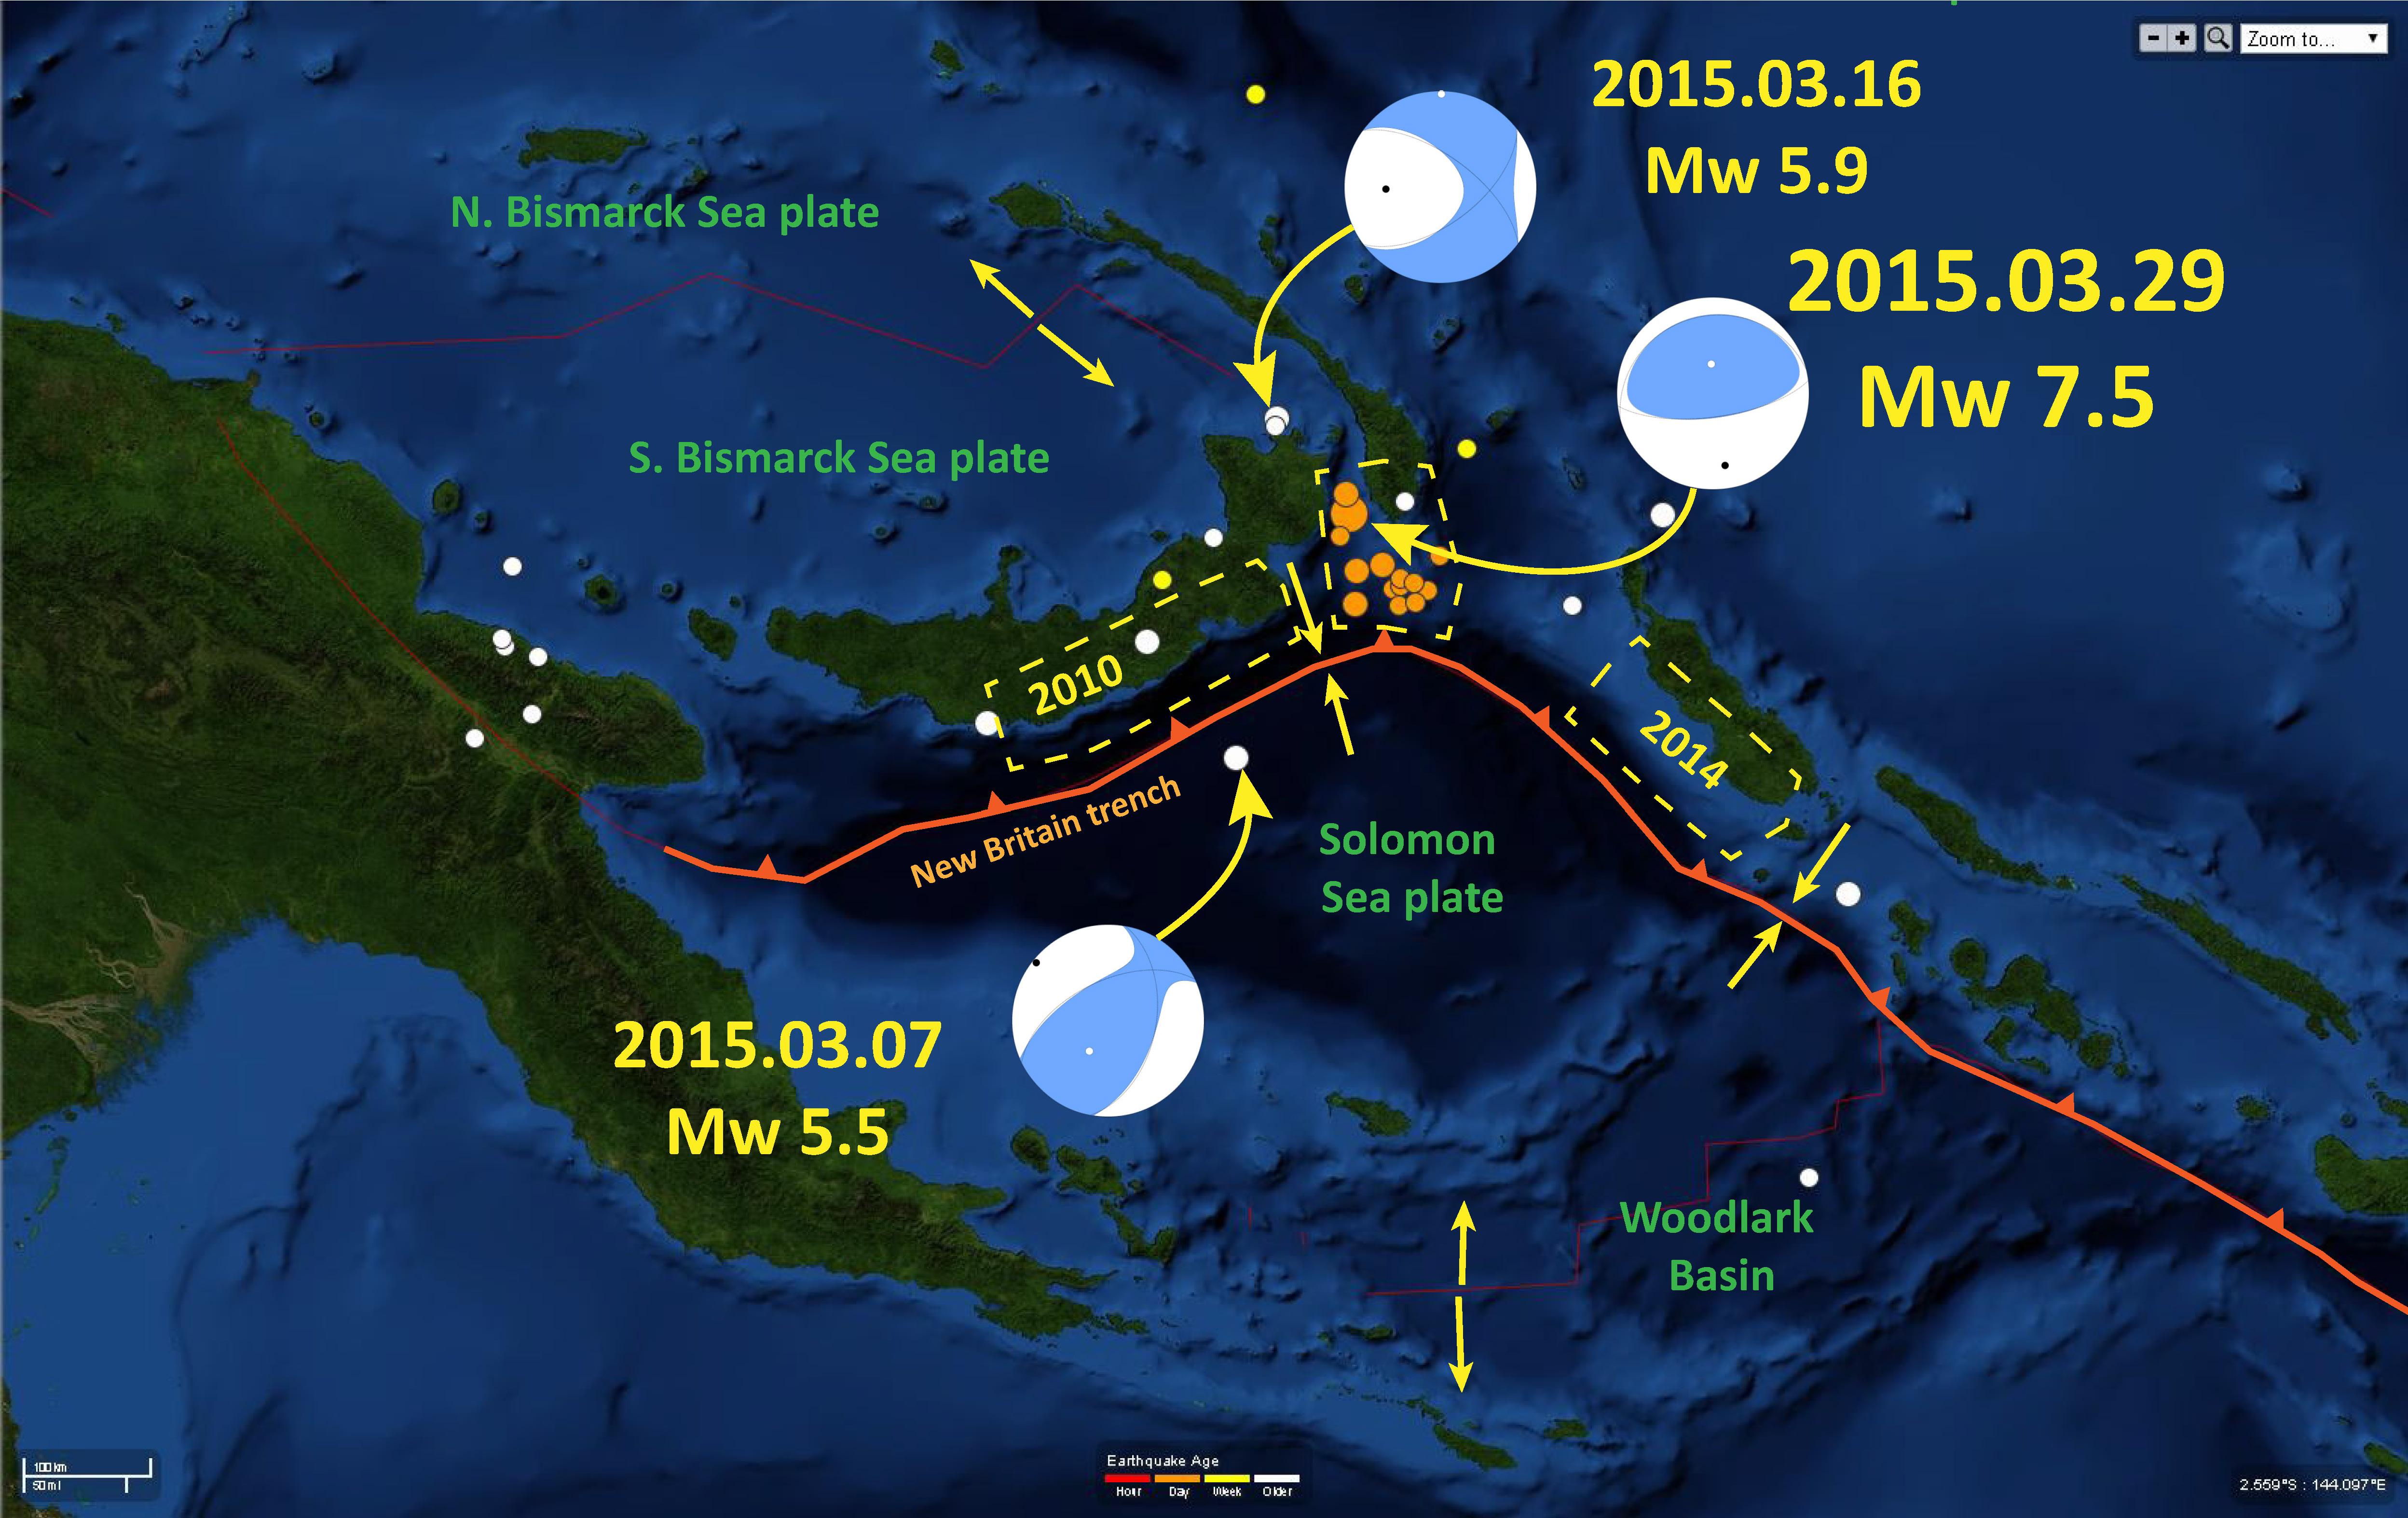
Here is a map that shows how these recent earthquakes represent different plate boundaries in this region. I put this together as a result of the March, 2015 earthquake swarm.
-
References:
- Hayes, G. P., D. J. Wald, and R. L. Johnson (2012), Slab1.0: A three-dimensional model of global subduction zone geometries, J. Geophys. Res., 117, B01302, doi:10.1029/2011JB008524
- Hamilton, W., 1979, Tectonics of the Indonesian region: U.S. Geological Survey Prof. Paper 1078.