Earlier today there was a large earthquake associated in some way with the subduction zone forming the Middle America Trench. There is currently some debate about what plate this earthquake occurred within, but it appears to be an intraplate earthquake within the downgoing Cocos plate (CP), beneath the North America plate (NAP).
I initially thought that this was unrelated to the recent M 8.1 earthquake offshore of Chiapas, Mexico. This is due to my view of aftershocks, that they typically occur within 2 rupture lengths of the mainshock and that they need to be on the same fault (or nearby synthetic fault). However, upon discussing this on twitter, Dr. Susan Hough suggests that this need not be the case, referring to Richter, “Charles Richter observed in the ’50s that distant aftershocks could be part of local sequences set into motion by early triggered quakes.” My initial view was also based upon the slab contours (depth contours to the top of the subducting plate, as published by Hayes et al., 2012), which are discontinuous in this region. This suggested that the earthquake was in the upper plate, the NAP. However, upon discussions with Dr. Stephen Hicks, he suggested people refer to Gérault et al. (2015) that show how the subducting slab (the CP) is flat in this region. This evidence may place the M 7.1 earthquake within the CP.
- Upon doing my research, I learned that there was a very similar earthquake in this region in 1999. Below are the USGS websites for these two similar earthquakes.
- 2017.09.19 M 7.1 Puebla, Mexico
- 1999.06.15 M 7.0 Puebla, Mexico
- Here are my two reports for the M 8.1 Earthquake.
- 2017.09.08 M 8.1 Chiapas, Mexico
- 2017.09.08 M 8.1 Chiapas, Mexico Update #1
Click on this link to my first update for this M 7.1 earthquake: UPDATE #1
- Science
- earthquakereport dot com
- Servicio Sismológico Nacional (SSN)
- IPGP
- Geoscope
- IRIS
- IRIS Teachable Moment
- UC Berkeley Seismo Blog
- News
- BBC
- LA Times More than 200 killed as powerful 7.1 earthquake strikes central Mexico
- The Guardian Are the two Mexican earthquakes connected – and are more on the way?
- Forbes Deadly Mexico City Earthquake Triggered Volcanic Eruption, Leaves At Least 217 Dead
Here are some additional reports found elsewhere on the internets (President G. W. Bush used to call the internet, “the internets”. heheh).
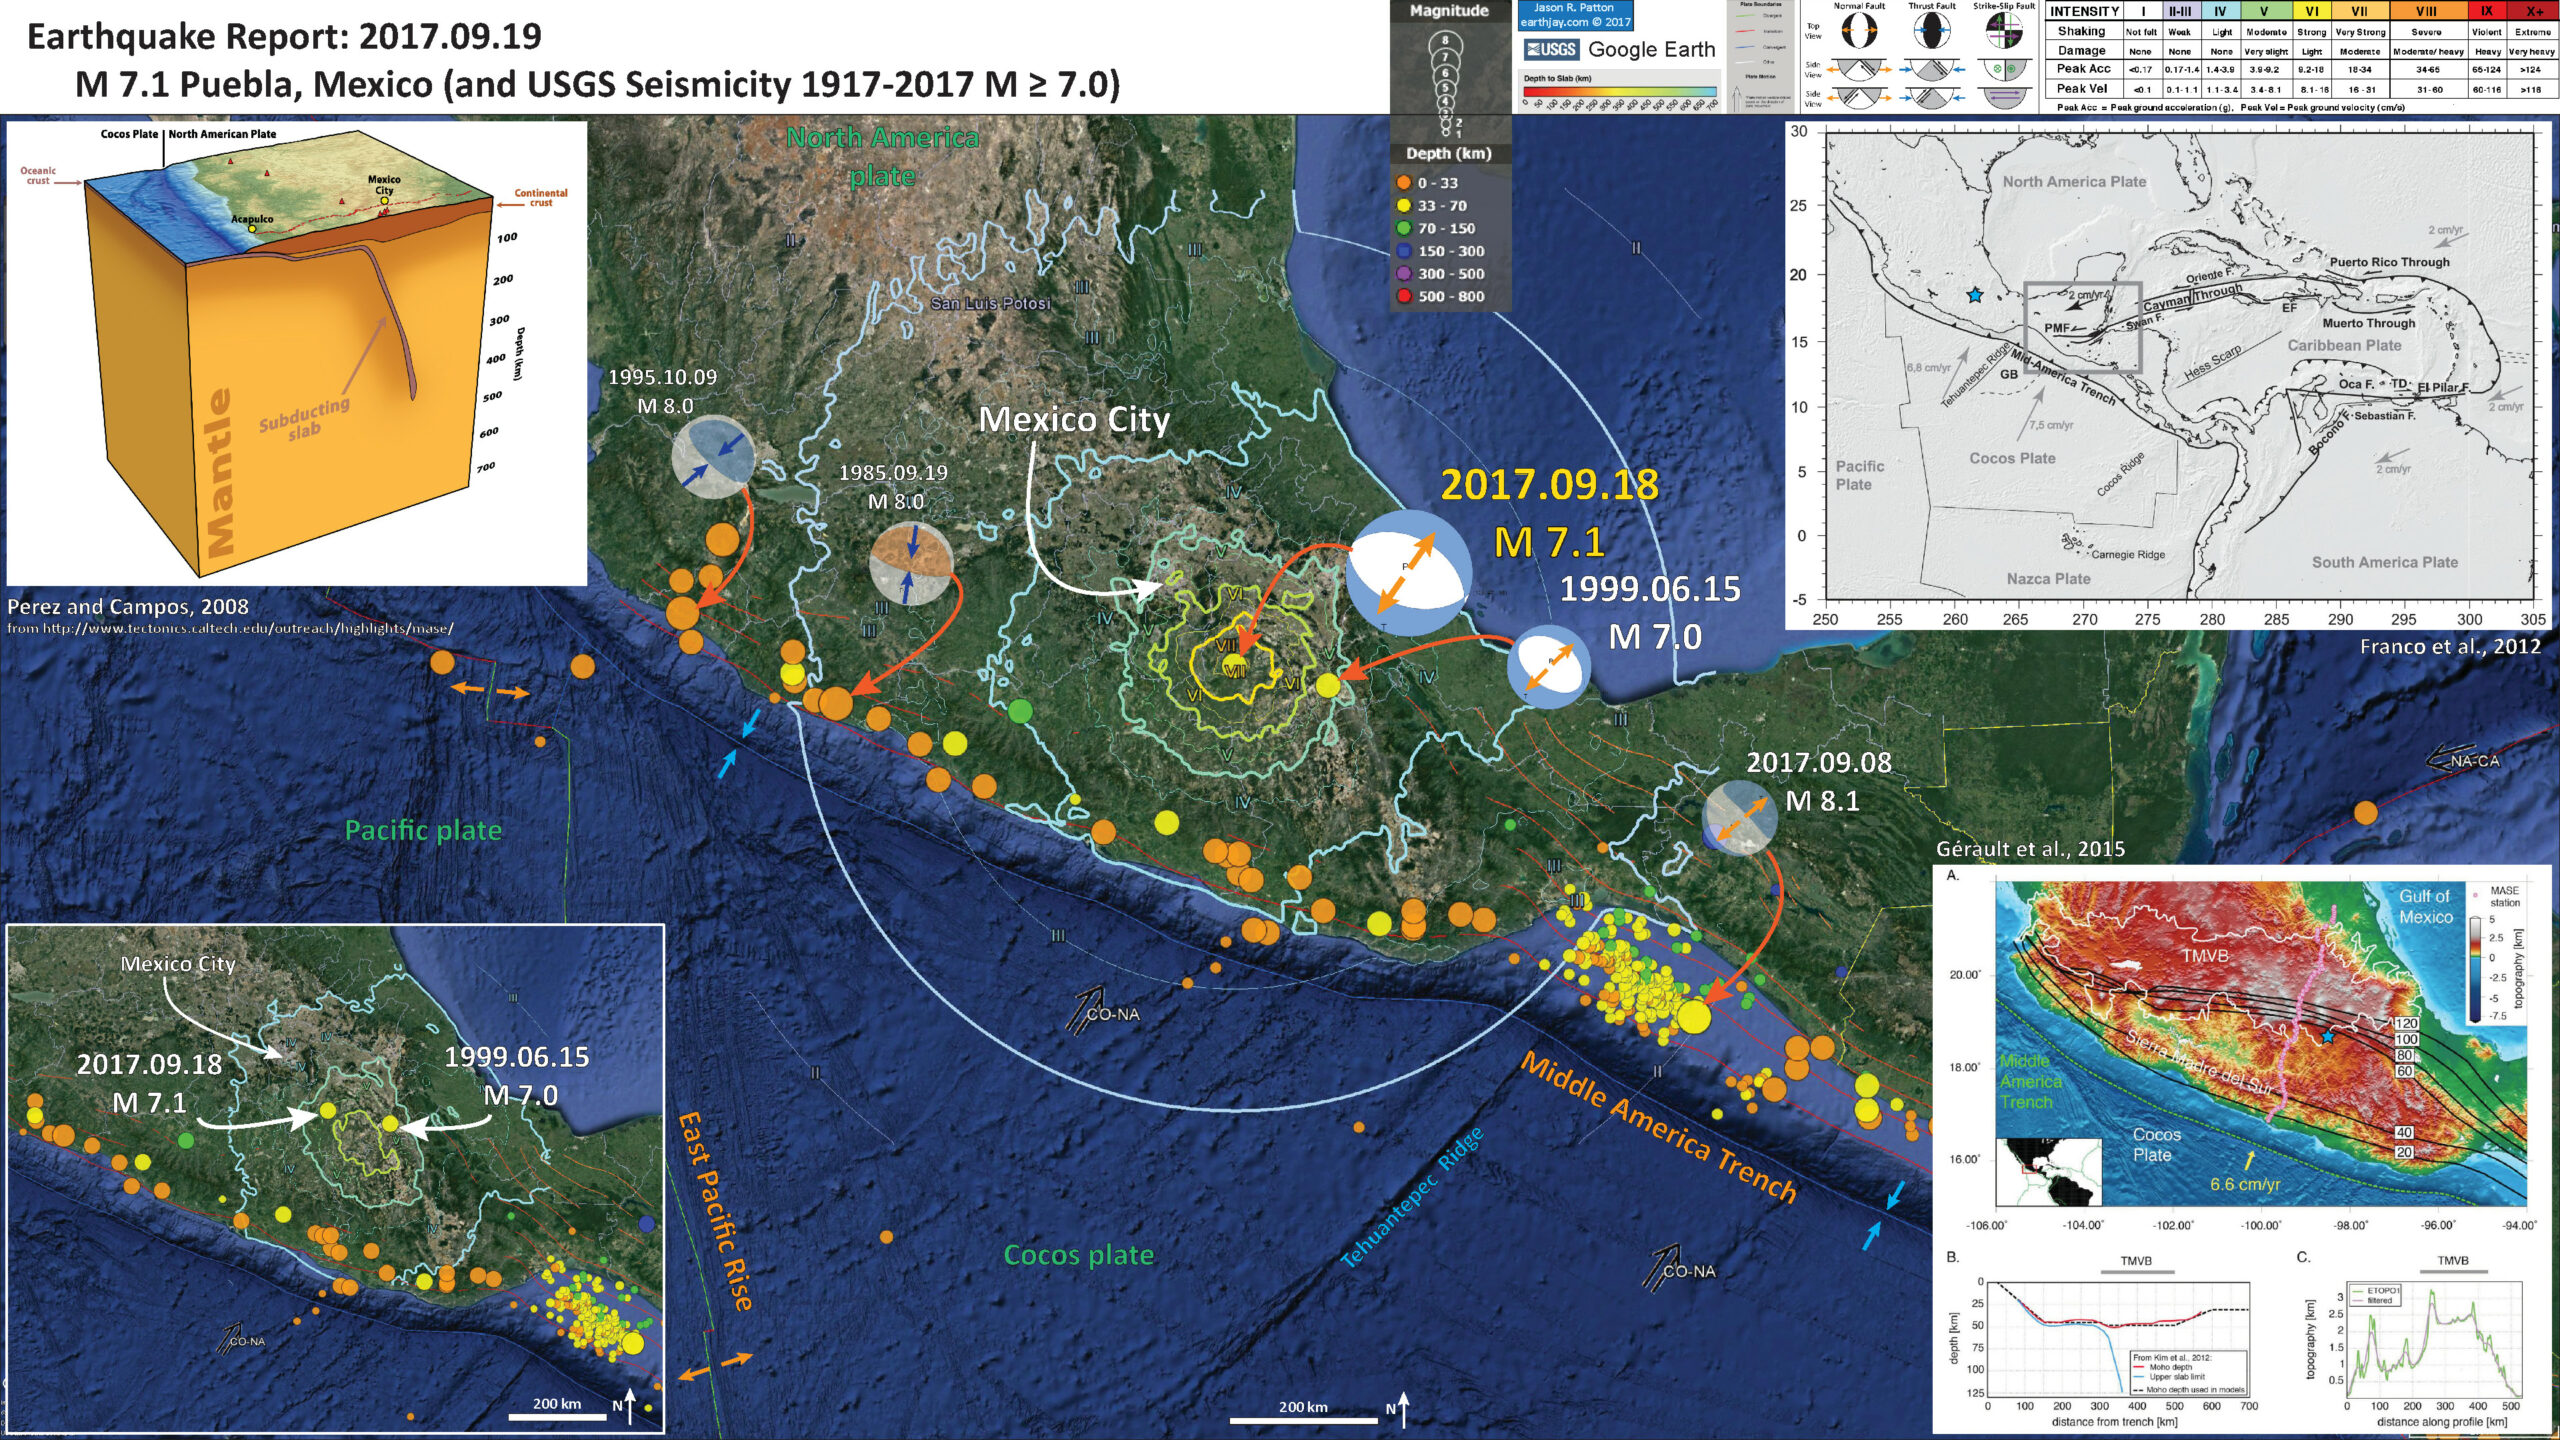
Below is my interpretive poster for this earthquake
I plot the seismicity from the past month, with color representing depth and diameter representing magnitude (see legend). I also include USGS epicenters from 1917-2017 for magnitudes M ≥ 7.0. I include fault plane solutions for the 1985 and 1995 earthquakes (along with the MMI contours for those earthquakes, see below for a discussion of MMI contours). I also include the moment tensor for the 2017.09.08 M 8.1 and 1999.06.15 M 7.0 earthquakes. I prepared the same poster below that also includes MMI contours for the 1985 M 8.0 earthquake. One may see that for both the 1985 and today’s M 7.1 earthquake, there are similar intensities in Mexico City. The 1985 did have slightly higher MMI intensities (MMI 6 vs. MMI 5.5). We will just need to wait and see as damage reports come in as these MMI contours are simply model based estimates (and the USGS Did You Feel It system was not yet created in 1985). I also include a map below that shows the 2017.09.08 M 8.1 MMI contours for comparison.
- I placed a moment tensor / focal mechanism legend on the poster. There is more material from the USGS web sites about moment tensors and focal mechanisms (the beach ball symbols). Both moment tensors and focal mechanisms are solutions to seismologic data that reveal two possible interpretations for fault orientation and sense of motion. One must use other information, like the regional tectonics, to interpret which of the two possibilities is more likely.
- I also include the shaking intensity contours on the map. These use the Modified Mercalli Intensity Scale (MMI; see the legend on the map). This is based upon a computer model estimate of ground motions, different from the “Did You Feel It?” estimate of ground motions that is actually based on real observations. The MMI is a qualitative measure of shaking intensity. More on the MMI scale can be found here and here. This is based upon a computer model estimate of ground motions, different from the “Did You Feel It?” estimate of ground motions that is actually based on real observations.
- I include the slab contours plotted (Hayes et al., 2012), which are contours that represent the depth to the subduction zone fault. These are mostly based upon seismicity. The depths of the earthquakes have considerable error and do not all occur along the subduction zone faults, so these slab contours are simply the best estimate for the location of the fault.
- In the upper right corner is a figure from Franco et al. (2012) that shows the tectonic plate boundaries in this region. I place a blue star in the general location of this M 8.1 earthquake (as below).
- In the upper left corner is a figure from Perez and Campos (2008; as presented here) which shows the interpreted geometry of the subducting slab in this region. The profile of the seismic array used as a basis for this interpretation (the MASE array) is denoted by the brown dashed line. This line is also shown on the figure in the lower right corner).
- In the lower right corner is a figure that shows the slab contours for the Mexico subduction zone (Gérault et al., 2015). I also place a blue star in the general location of today’s earthquake.
- In the lower left corner is a map showing the same seismicity presented in the main map, but I include MMI contours from the 1999 earthquake. I show where Mexico City is and the ground shaking from 1999 does not have the same intensities (in Mexico City) as does the 2017 M 7.1 earthquake.
I include some inset figures in the poster.

- This shows the MMI contours for the 1985 M 8.0 earthquake.

- This version includes the MMI contours for the 2017.09.08 M 8.1 earthquake.

- As I was writing this, the USGS prepared a poster. Below is that poster (also on the earthquake page here.)

- Here is a comparison of the modeled intensities for three earthquakes, the 1985, 1999, and today’s M 7.1 earthquakes.

- Here is the Franco et al. (2012) tectonic map.
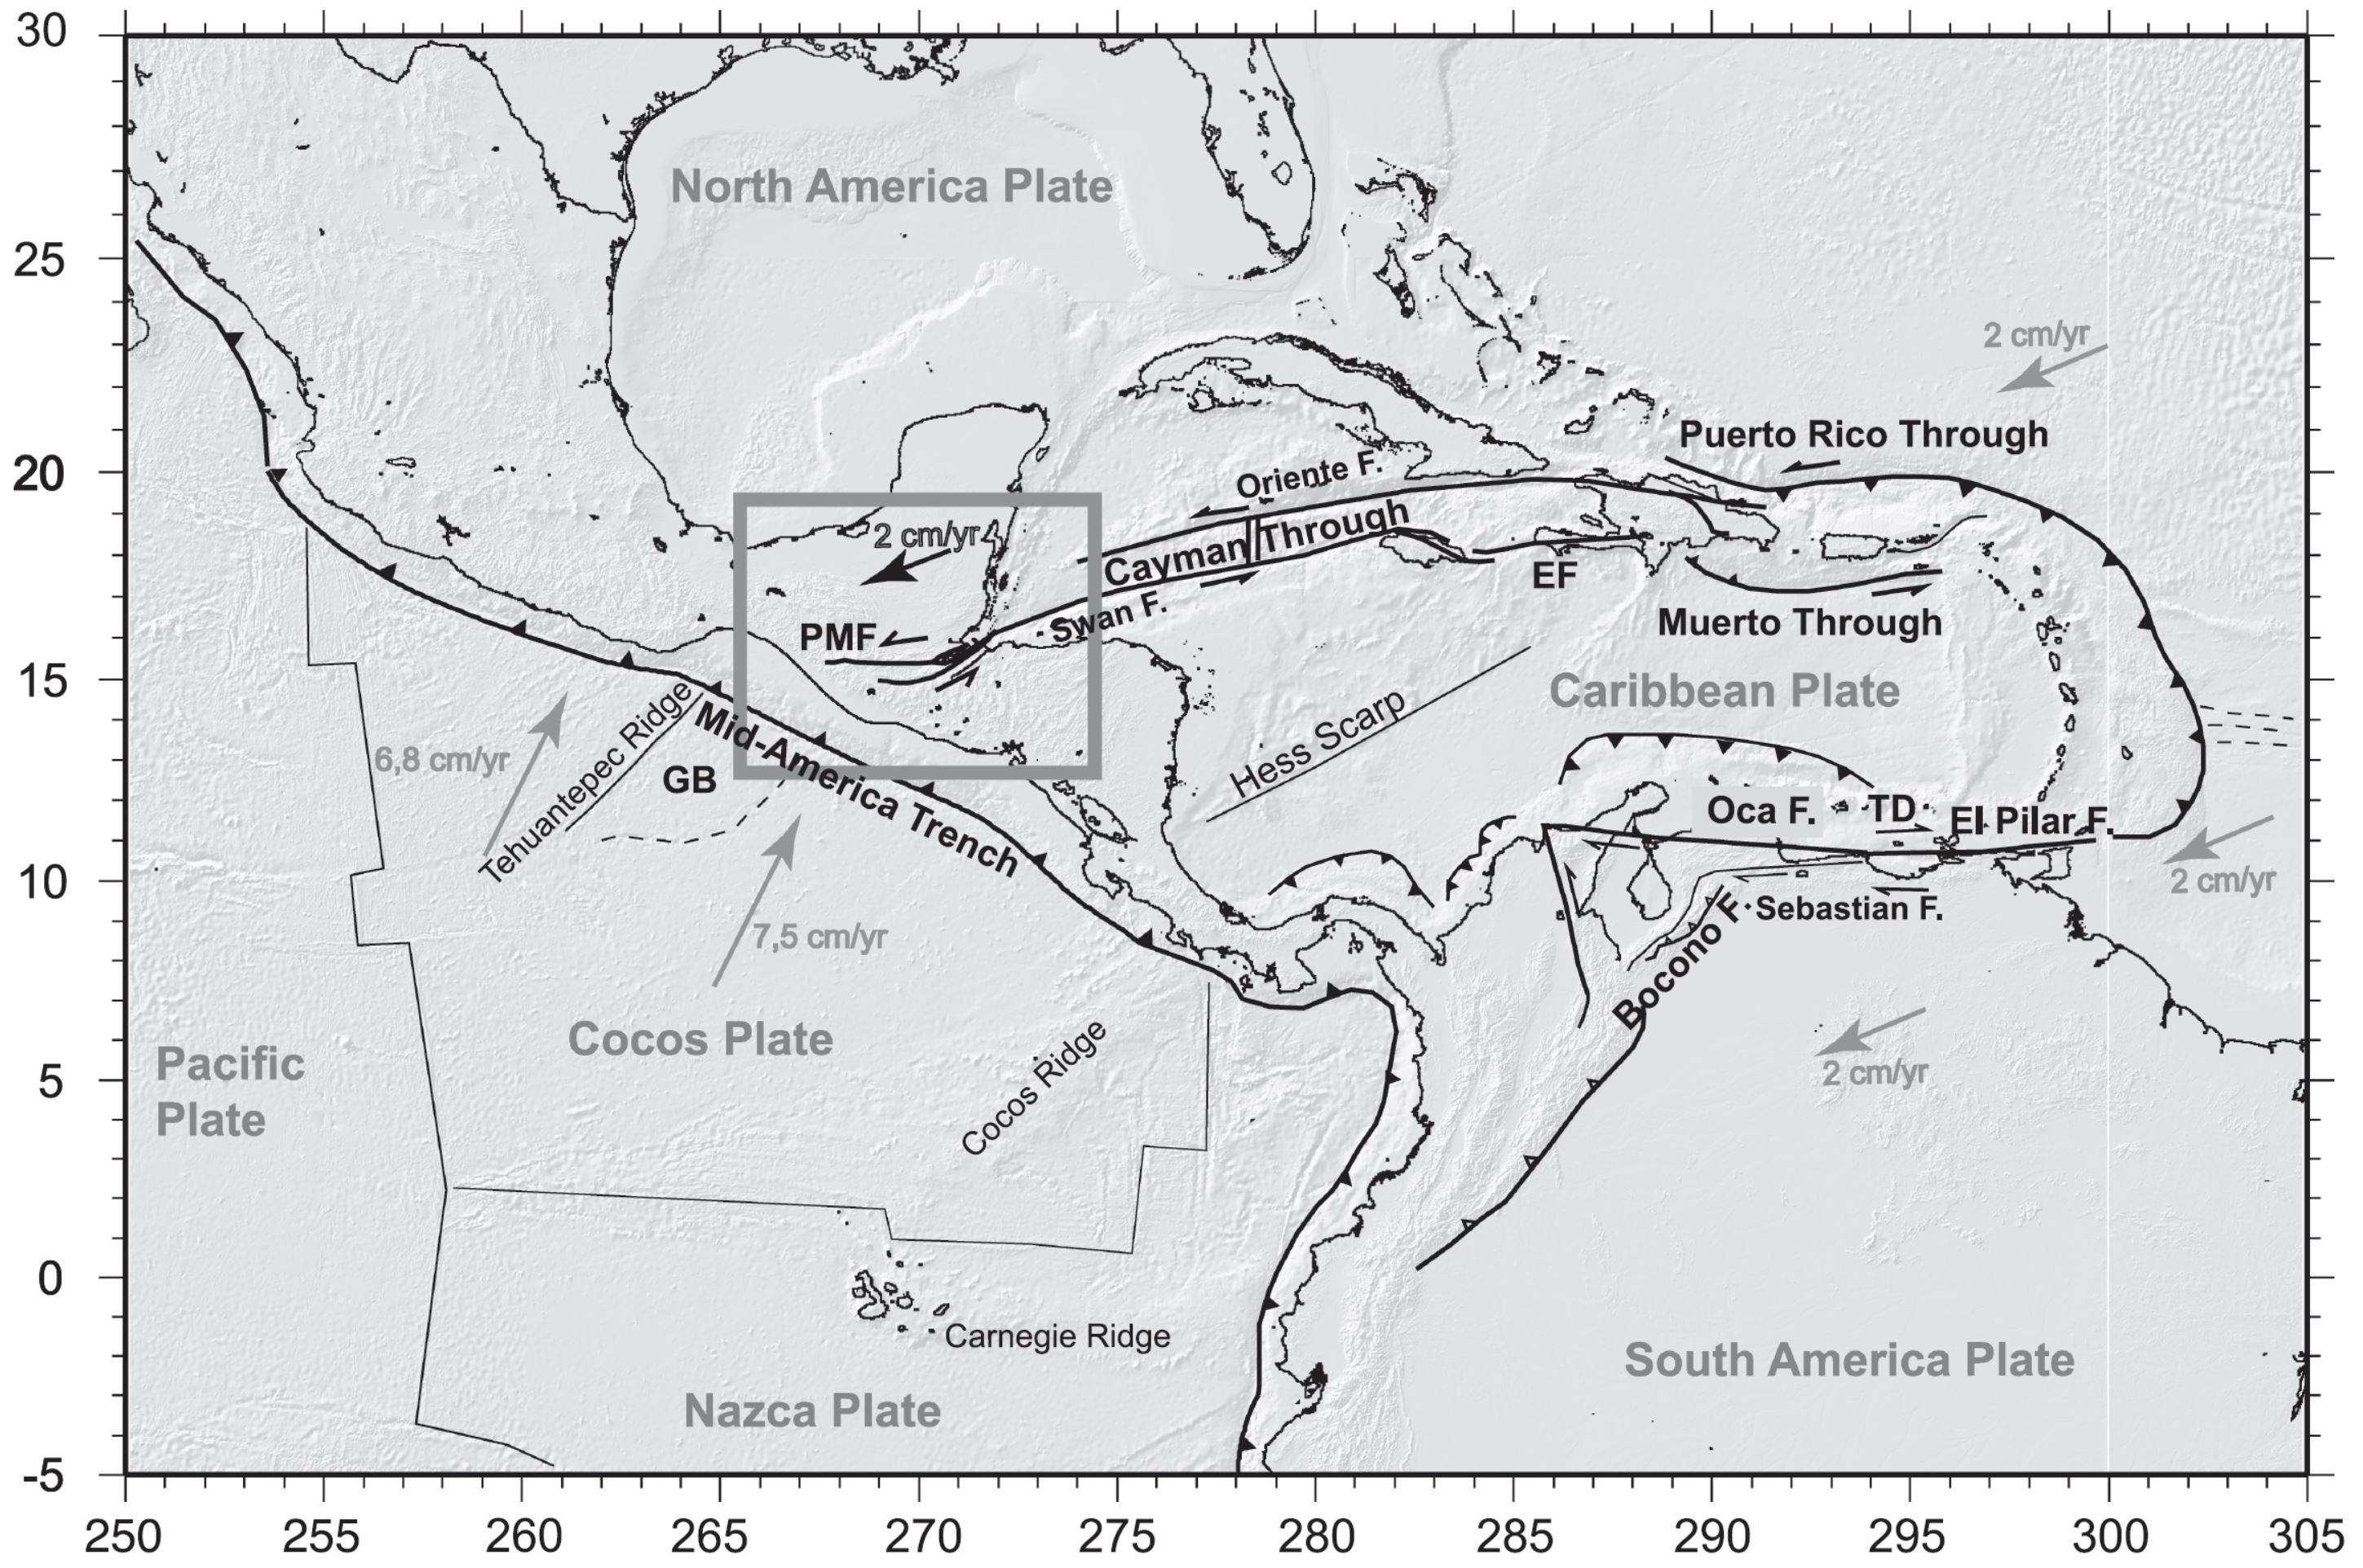
Tectonic setting of the Caribbean Plate. Grey rectangle shows study area of Fig. 2. Faults are mostly from Feuillet et al. (2002). PMF, Polochic–Motagua faults; EF, Enriquillo Fault; TD, Trinidad Fault; GB, Guatemala Basin. Topography and bathymetry are from Shuttle Radar Topography Mission (Farr&Kobrick 2000) and Smith & Sandwell (1997), respectively. Plate velocities relative to Caribbean Plate are from Nuvel1 (DeMets et al. 1990) for Cocos Plate, DeMets et al. (2000) for North America Plate and Weber et al. (2001) for South America Plate.
- Here is the figure from Gérault et al. (2015) that shows the slab contours.

(a) Geodynamic context of southwestern Mexico. Topography and bathymetry from ETOPO1 [Amante and Eakins, 2009]. A white curve outlines the Trans-Mexican Volcanic Belt (TMVB) [Ferrari et al., 2012]. The black lines show the isodepths of the Cocos slab at a 20 km interval, using seismicity up to ∼45 km depth and tomography below [Kim et al., 2012a]. These slab contours show that distinct topographic domains are associated with variations in slab geometry. The yellow vector shows the relative convergence velocity between the Cocos and North America Plate near Acapulco, holding North America fixed [DeMets et al., 2010]. The pink circles show the locations of the Meso-America Subduction Experiment (MASE) stations. (b) Moho depth (red) and upper slab limit (blue) from Kim et al. [2012a, 2013]. The dashed line shows the simplified Moho depth that we used in the numerical models. (c) Measured and smoothed topography along the MASE profile as a function of the distance from the southernmost seismic station, near Acapulco. The topography is smoothed using three passages of a rectangular sliding average of width 15 km.
- P
- Here are some figures from Pérez-Campos et al. (2008) that show results from the MASE seismic experiment. First is the map showing the seismic array in the tectonic context.
- These authors used receiver functions to estimate the depth to the Cocos plate (the slab depth). Below is their figure showing their results. Receiver function analyses use an array (a linear network, or grid network, but a linear network in this case) of seismometers. “A receiver function technique is a way to model the structure of the Earth by using the information from teleseismic earthquakes recorded at a three component seismograph.” More can be found on this here and here.
- And finally, here is their model of the subducting slab. The authors also use seismic tomography to evaluate the geometry of the plates in this region. Seismic tomography is the same as a CT scan of the Earth. We can think of seismic tomography as a 3-D X-Ray of the Earth, just using seismic waves instead.

MASE seismic array. Slab isodepth contours from Pardo and Sua´rez [1995] are in blue dashed lines. The dots represent epicenters of M>4 earthquakes, reported by the Servicio Sismolo´gico Nacional (SSN; in pink) from December 2004 through June 2007 and those re-located by Pardo and Sua´rez [1995] (in green). The thick orange line represents the profile of Figures 2 and 3. The arrows indicate the beginning (dark blue) and end (light blue) of the flat segment, and the tip of the slab (red).

Receiver function images. The black triangles denote the position of the stations along the profile with elevation exaggerated 10 times. The thick brown line denotes the extent of the TMVB. Seismicity (SSN: pink; Pardo and Sua´rez [1995]: green), within 50 km of the MASE profile, is shown as dots. The bottom left plot shows RFs for one teleseismic event along the flat slab portion of the slab; the bottom middle plot illustrates the corresponding model (LVM = low velocity mantle and OC = oceanic crust). Compressional-wave velocity models A, B, and C shown in the bottom right plot were determined from waveform modeling of RFs. They correspond to the structure at A, B, and C of the bottom left plot.

Composite model: tomographic and RF image showing the flat and descending segments of the slab. The key features are the flat under-plated subduction for 250 km, and the location and truncation of the slab at 500 km. The zone separating the ocean crust from the continental Moho is estimated to be less than 10 km in thickness. NA = North America, C = Cocos, LC = lower crust, LVM = low velocity mantle, OC = oceanic crust.
- Below is a video that explains seismic tomography from IRIS.
Update 17:25 PST
- While I was in the bath, I was thinking about the Tehuantepec Ridge (TR; a fracture zone, not really a ridge) may be the location of a tear in the slab of the downgoing Cocos plate. There is a small age offset (of the oceanic crust) on either side of the TR and the dip of the slab is different too. When I got back in bed (I am currently ill), I saw Dr. Jasha Polet’s post showing the cross sections at the locations for these two earthquakes. Whether there is a tear or not, the slab is behaving differently in these locations. This lends credence to the interpretation that these earthquakes are not a foreshock/aftershock sequence. Below I present Dr. Polet’s cross sections, along with a map showing the entire region.
- Map
- Northern Cross Section M 7.1. The M 7.1 earthquake is the largest focal mechanism in the easternmost part of the section (the outline is not black like the other focal mechanisms).
- Southern Cross Section M 8.1. The M 8.1 earthquake is the largest focal mechanism at about 200 km distance (the outline is not black like the other focal mechanisms).
Compare & contrast cross-sections of two recent Mexico quakes, dip of subducting slab, distance to trench and deep seismicity very different pic.twitter.com/Nb7sn0FwyF
— Jascha Polet (@CPPGeophysics) September 19, 2017


- Also, Dr. Gavin Hayes (as mentioned above with the earthquake poster) tweeted this interpretation below. This is also posted on the USGS website for this earthquake.
Slab cross-section & sketched interpretation through today's Mexico EQ… pic.twitter.com/Ffpf8UxtL5
— Gavin Hayes (@gph_seismo) September 19, 2017
- 2017.09.19 M 7.1 Puebla, Mexico
- 2017.09.08 M 8.1 Chiapas, Mexico
- 2017.09.08 M 8.1 Chiapas, Mexico Update #1
- 2017.06.22 M 6.8 Guatemala
- 2017.06.14 M 6.9 Guatemala
- 2017.05.12 M 6.2 El Salvador
- 2017.03.29 M 5.7 Gulf of California
- 2016.11.24 M 7.0 El Salvador
- 2016.04.29 M 6.6 East Pacific Rise / MAT
- 2016.01.21 M 6.6 Mexico
- 2015.09.13 M 6.6 Gulf California
- 2015.09.13 M 6.6 Gulf California Update #1
- 2014.10.14 M 7.3 El Salvador
- 2013.10.20 M 6.4 Gulf California
Mexico | Central America
General Overview
Earthquake Reports
References:
- Benz, H.M., Dart, R.L., Villaseñor, Antonio, Hayes, G.P., Tarr, A.C., Furlong, K.P., and Rhea, Susan, 2011 a. Seismicity of the Earth 1900–2010 Mexico and vicinity: U.S. Geological Survey Open-File Report 2010–1083-F, scale 1:8,000,000.
- Benz, H.M., Tarr, A.C., Hayes, G.P., Villaseñor, Antonio, Furlong, K.P., Dart, R.L., and Rhea, Susan, 2011 b. Seismicity of the Earth 1900–2010 Caribbean plate and vicinity: U.S. Geological Survey Open-File Report 2010–1083-A, scale 1:8,000,000.
- Franco, A., C. Lasserre H. Lyon-Caen V. Kostoglodov E. Molina M. Guzman-Speziale D. Monterosso V. Robles C. Figueroa W. Amaya E. Barrier L. Chiquin S. Moran O. Flores J. Romero J. A. Santiago M. Manea V. C. Manea, 2012. Fault kinematics in northern Central America and coupling along the subduction interface of the Cocos Plate, from GPS data in Chiapas (Mexico), Guatemala and El Salvador in Geophysical Journal International., v. 189, no. 3, p. 1223-1236. DOI: https://doi.org/10.1111/j.1365-246X.2012.05390.x
- Franco, S.I., Kostoglodov, V., Larson, K.M., Manea, V.C>, Manea, M., and Santiago, J.A., 2005. Propagation of the 2001–2002 silent earthquake and interplate coupling in the Oaxaca subduction zone, Mexico in Earth Planets Space, v. 57., p. 973-985.
- Garcia-Casco, A., Projenza, J.A., Iturralde-Vinent, M.A., 2011. Subduction Zones of the Caribbean: the sedimentary, magmatic, metamorphic and ore-deposit records UNESCO/iugs igcp Project 546 Subduction Zones of the Caribbean in Geologica Acta, v. 9, no., 3-4, p. 217-224
- Gérault, M., Husson, L., Miller, M.S., and Humphreys, E.D., 2015. Flat-slab subduction, topography, and mantle dynamics in southwestern Mexico in Tectonics, v. 34, p. 1892-1909, doi:10.1002/2015TC003908.
- Hayes, G. P., D. J. Wald, and R. L. Johnson, 2012. Slab1.0: A three-dimensional model of global subduction zone geometries, J. Geophys. Res., 117, B01302, doi:10.1029/2011JB008524.
- Lay et al., 2011. Outer trench-slope faulting and the 2011 Mw 9.0 off the Pacific coast of Tohoku Earthquake in Earth Planets Space, v. 63, p. 713-718.
- Manea, M., and Manea, V.C., 2014. On the origin of El Chichón volcano and subduction of Tehuantepec Ridge: A geodynamical perspective in JGVR, v. 175, p. 459-471.
- Mann, P., 2007, Overview of the tectonic history of northern Central America, in Mann, P., ed., Geologic and tectonic development of the Caribbean plate boundary in northern Central America: Geological Society of America Special Paper 428, p. 1–19, doi: 10.1130/2007.2428(01). For
- McCann, W.R., Nishenko S.P., Sykes, L.R., and Krause, J., 1979. Seismic Gaps and Plate Tectonics” Seismic Potential for Major Boundaries in Pageoph, v. 117
- Pérez-Campos, Z., Kim, Y., Husker, A., Davis, P.M. ,Clayton, R.W., Iglesias,k A., Pacheco, J.F., Singh, S.K., Manea, V.C., and Gurnis, M., 2008. Horizontal subduction and truncation of the Cocos Plate beneath central Mexico in GRL, v. 35, doi:10.1029/2008GL035127
- Symithe, S., E. Calais, J. B. de Chabalier, R. Robertson, and M. Higgins, 2015. Current block motions and strain accumulation on active faults in the Caribbean in J. Geophys. Res. Solid Earth, v. 120, p. 3748–3774, doi:10.1002/2014JB011779.
Any thoughts as to why the earthquake was normal? From the figure that shows moment tensors for other recent, large events, most of the past earthquakes were compressional. Or is that one part of the argument for the earthquake occurring in the lower plate?
This is a normal earthquake, probably caused by bending in the donwgoing Cocos plate. There was a very similar earthquake in 1999 to the southeast.
THe image under: “Here is a comparison of the modeled intensities for three earthquakes, the 1985, 1999, and today’s M 7.1 earthquakes.” is WRONG. The bottom 2nd and 3rd images are reversed. You placed 1999 title yet epicenter belongs to 2017.
Thanks!!!! I apologize for not getting back to you earlier. I am not sure how I missed your comment. Thanks! I will make this fix!