There was a M 6.2 earthquake in Italy tonight. Here is the USGS website for today’s earthquake. There is lots of information about the tectonics of this region. I can hardly do justice to all the people who have worked here. It seems like every route I take for more information, I get 10 more publications.
This earthquake is north of the region that had an M 6.3 earthquake in 2009 that led to an interesting (putting it nicely) interaction between scientists, public employees/politicians, and the legal system. Basically, several seismologists were sentenced to prison. More on this is found online, for example, here and here.
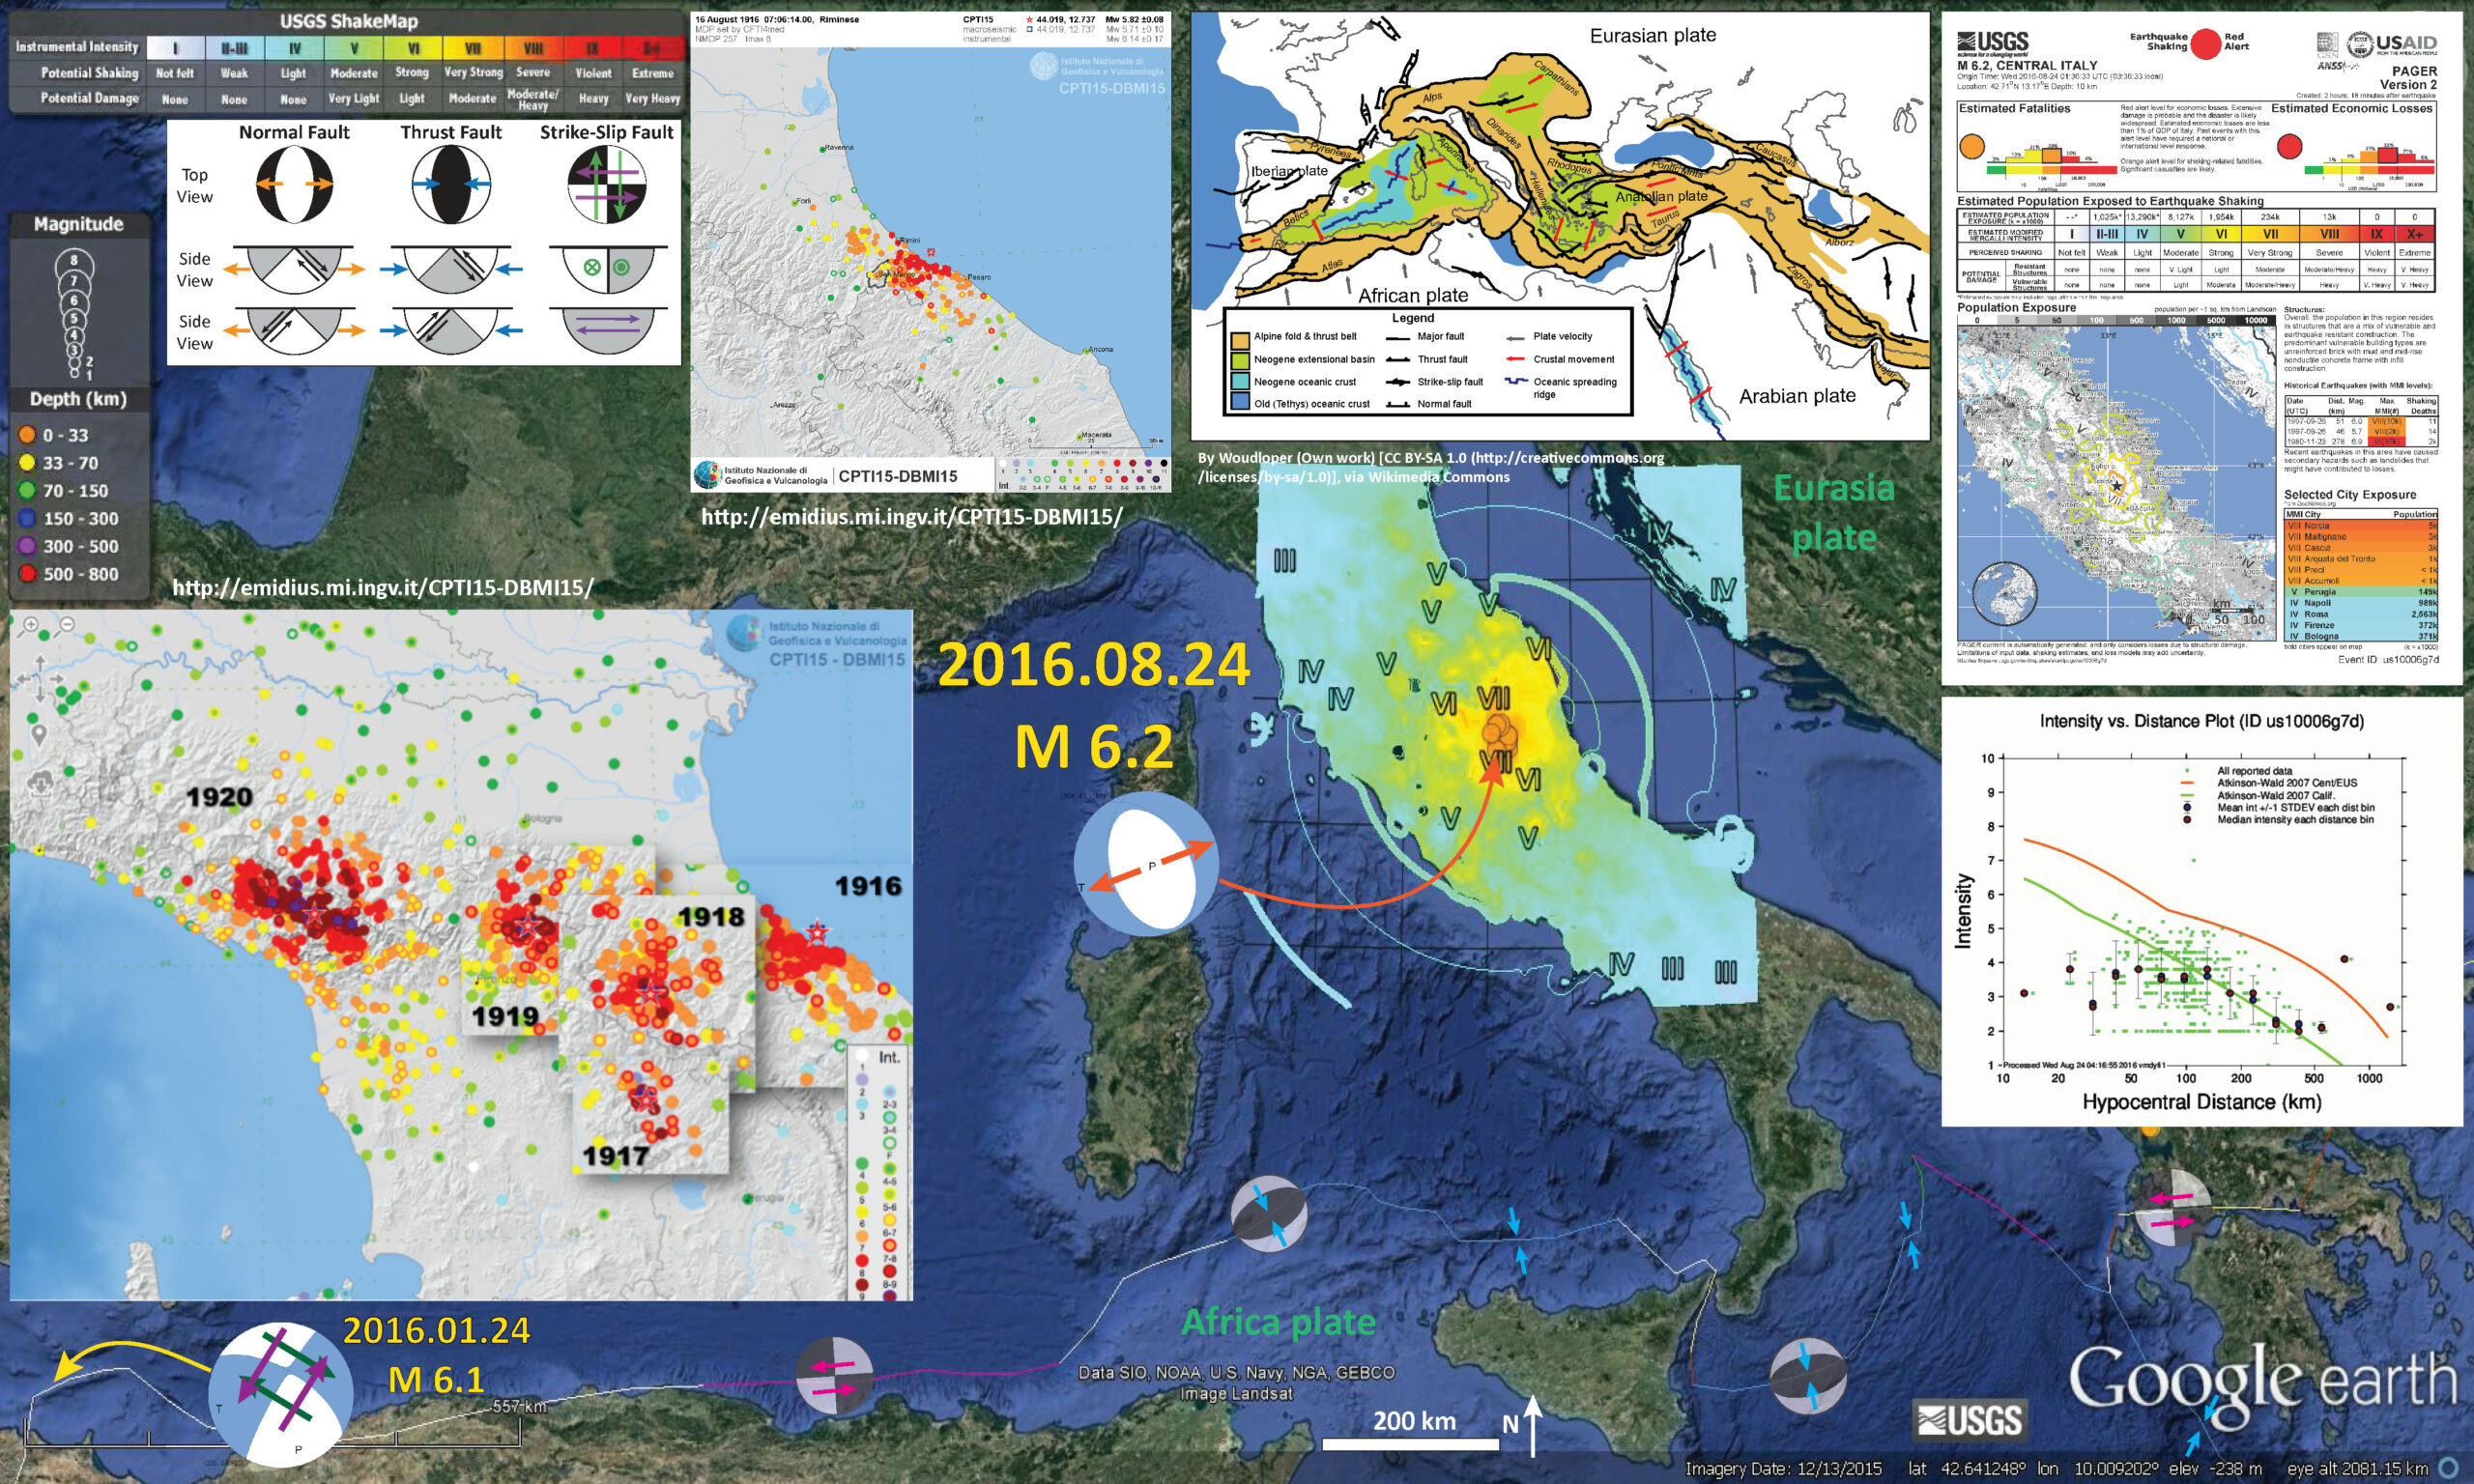
Below is my interpretive map that shows the epicenter, along with the shaking intensity contours. These contours use the Modified Mercalli Intensity (MMI) scale. The MMI is a qualitative measure of shaking intensity. More on the MMI scale can be found here and here. This is based upon a computer model estimate of ground motions, different from the “Did You Feel It?” estimate of ground motions that is actually based on real observations.
I placed a moment tensor / focal mechanism legend on the poster. There is more material from the USGS web sites about moment tensors and focal mechanisms (the beach ball symbols). Both moment tensors and focal mechanisms are solutions to seismologic data that reveal two possible interpretations for fault orientation and sense of motion. One must use other information, like the regional tectonics, to interpret which of the two possibilities is more likely. The tectonics of this region has many normal (extensional) faults, which explain the extensional moment tensor. However, I do not know enough of this region to interpret is this is an east or west dipping fault that ruptured (depends upon which side of which basin experience this earthquake; see below).
-
I include some inset figures and maps.
- In the upper right corner I include the Rapid Assessment of an Earthquake’s Impact (PAGER) report. More on the PAGER program can be found here. An explanation of a PAGER report can be found here. PAGER reports are modeled estimates of damage. On the top is a histogram showing estimated casualties and on the right is an estimate of possible economic losses. This PAGER report suggests that there will be quite a bit of damage from this earthquake (and casualties).
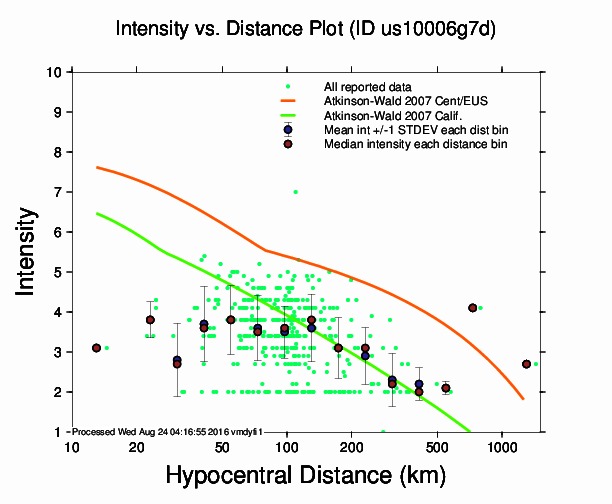
- Below that I show the USGS plot of “Did You Feel It?” reports compared to the estimates of ground shaking from Ground Motion Prediction Equation (GMPE) estimates. The relations between ground shaking and distance to an earthquake are also known as attenuation relations as the ground motions diminish (get attenuated) with distance from the earthquake.
- To the left of the PAGER report I include a basic tectonic map of this region. Maps with local (larger) scale have much more detailed views of the faulting.
- In the lower left corner is a map showing a series of earthquake swarms that occurred between 1916 and 1920, rupturing across the Apennines in northern Italy. This is just to the north of tonight’s M 6.2 earthquake. It is interesting as Baize posted on twitter some accounts of this earthquake series on twitter yesterday. There is another map showing greater detail of the 1916 swarm.
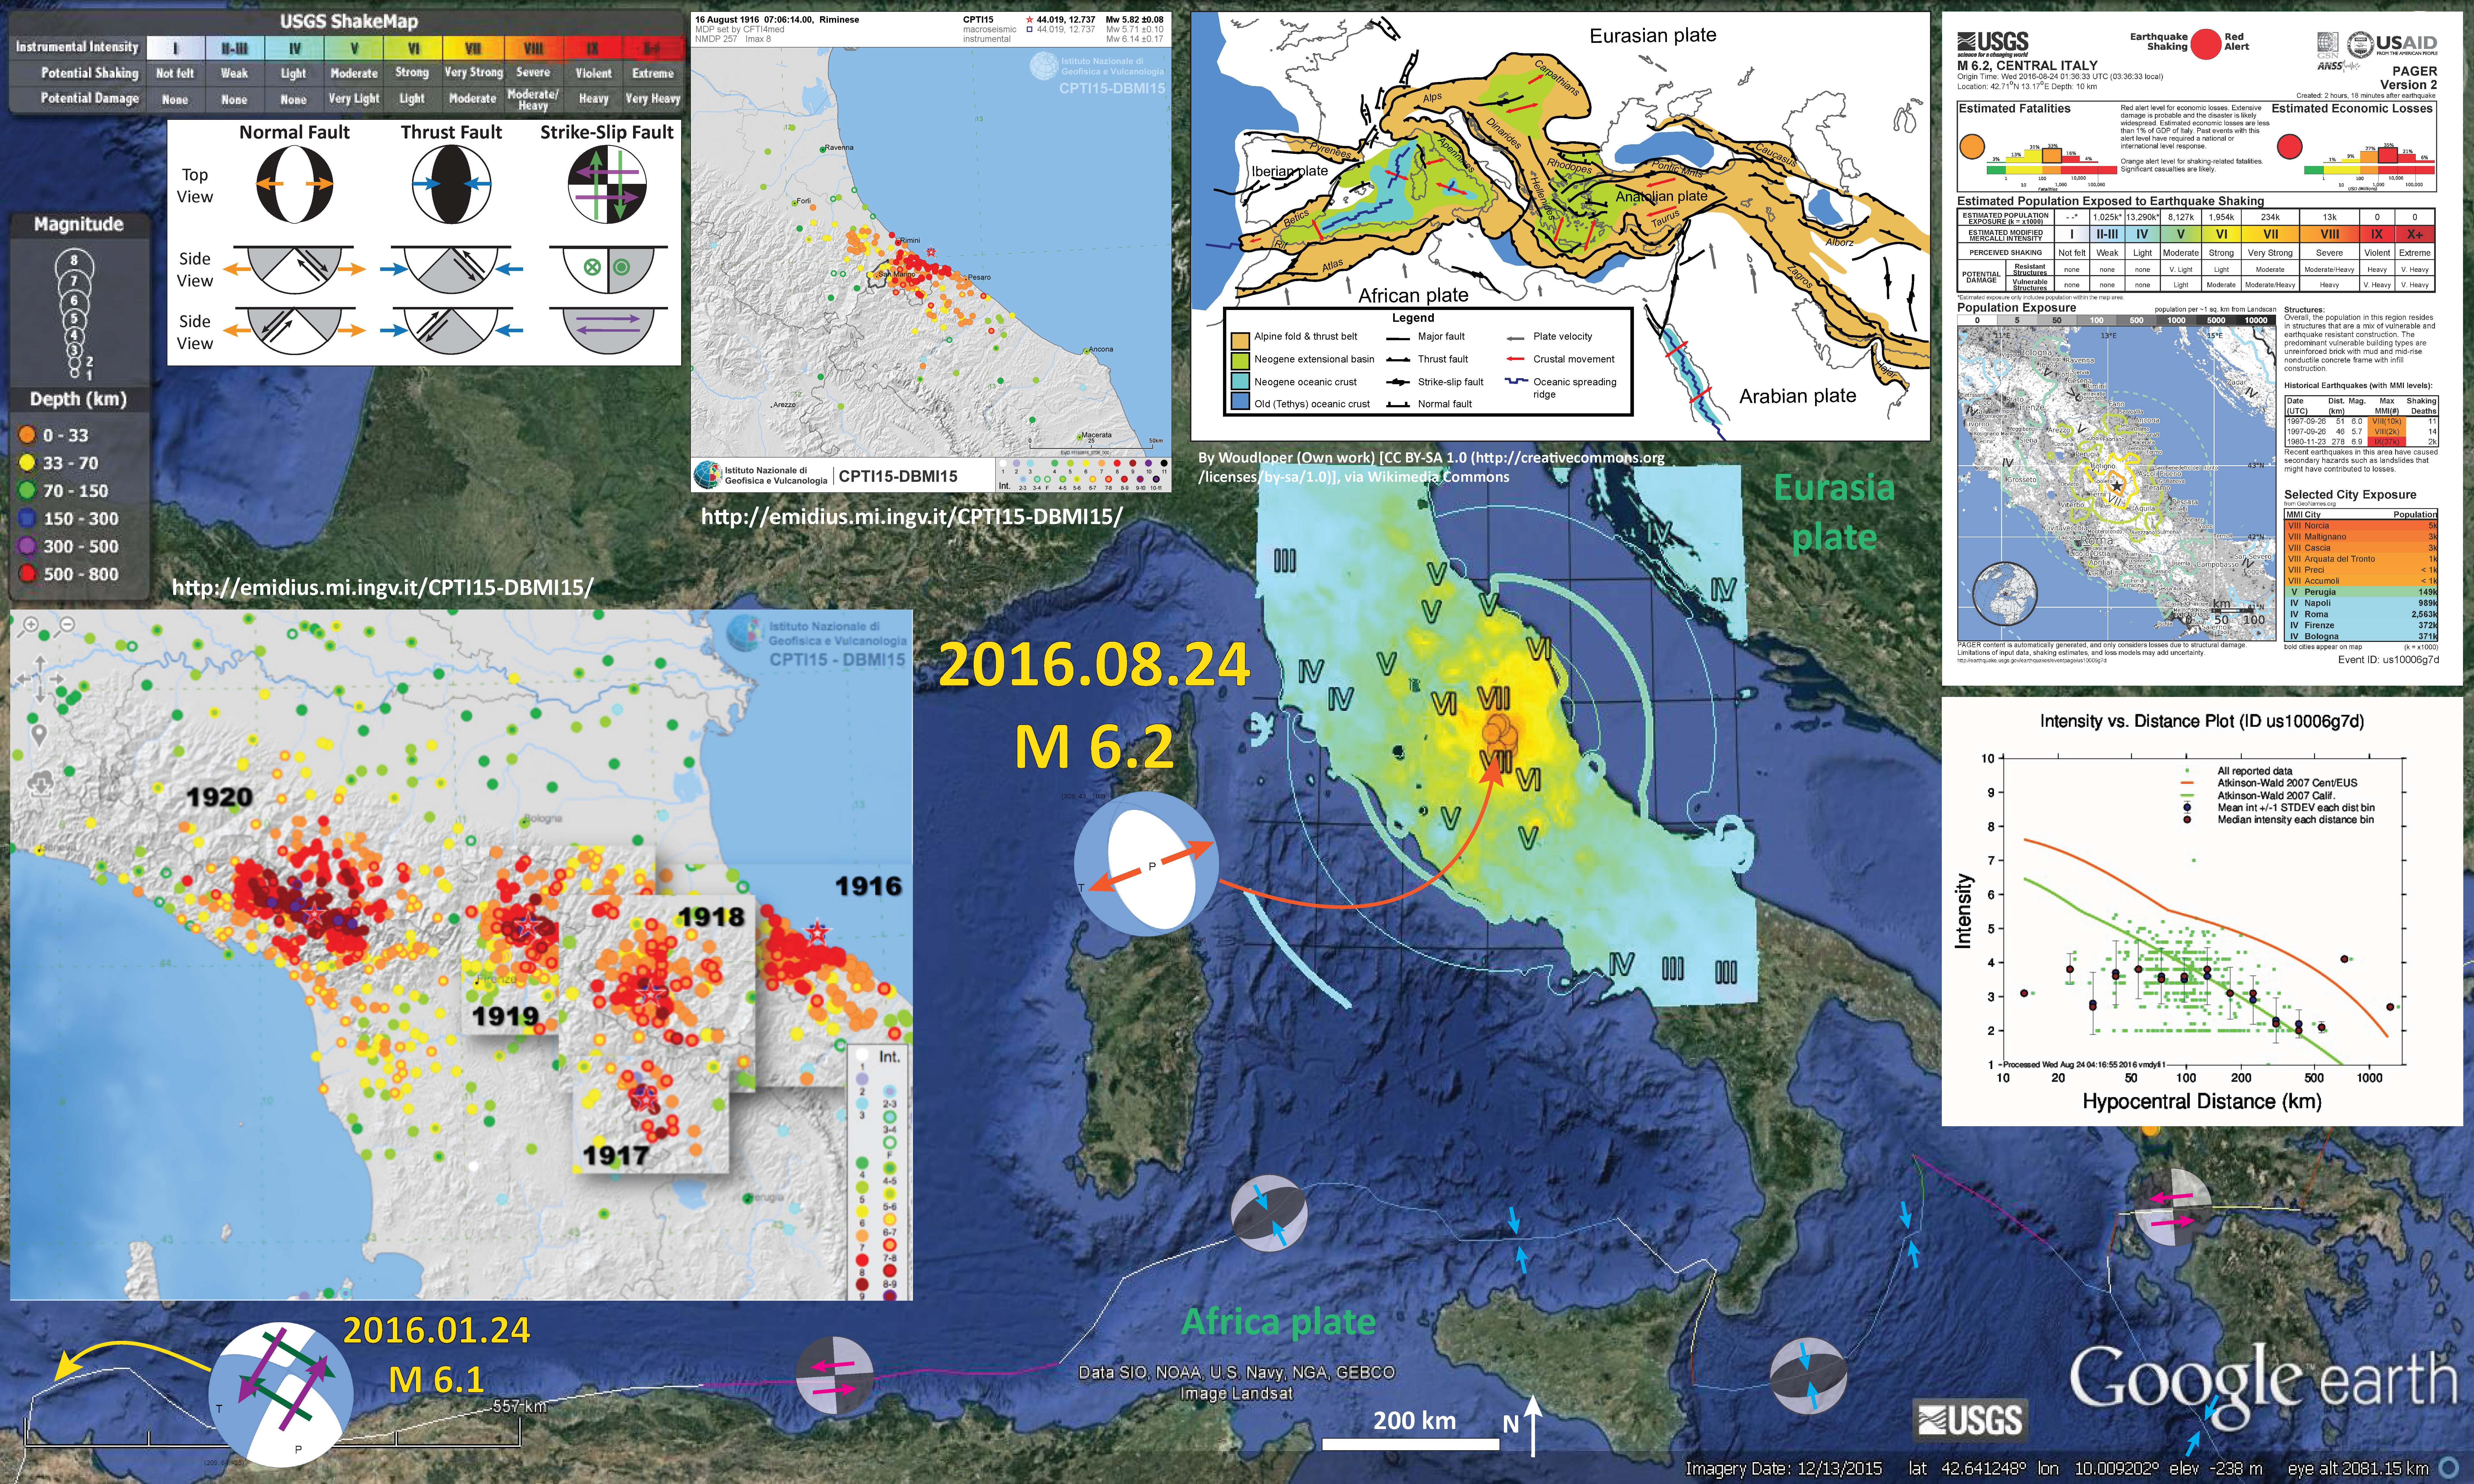
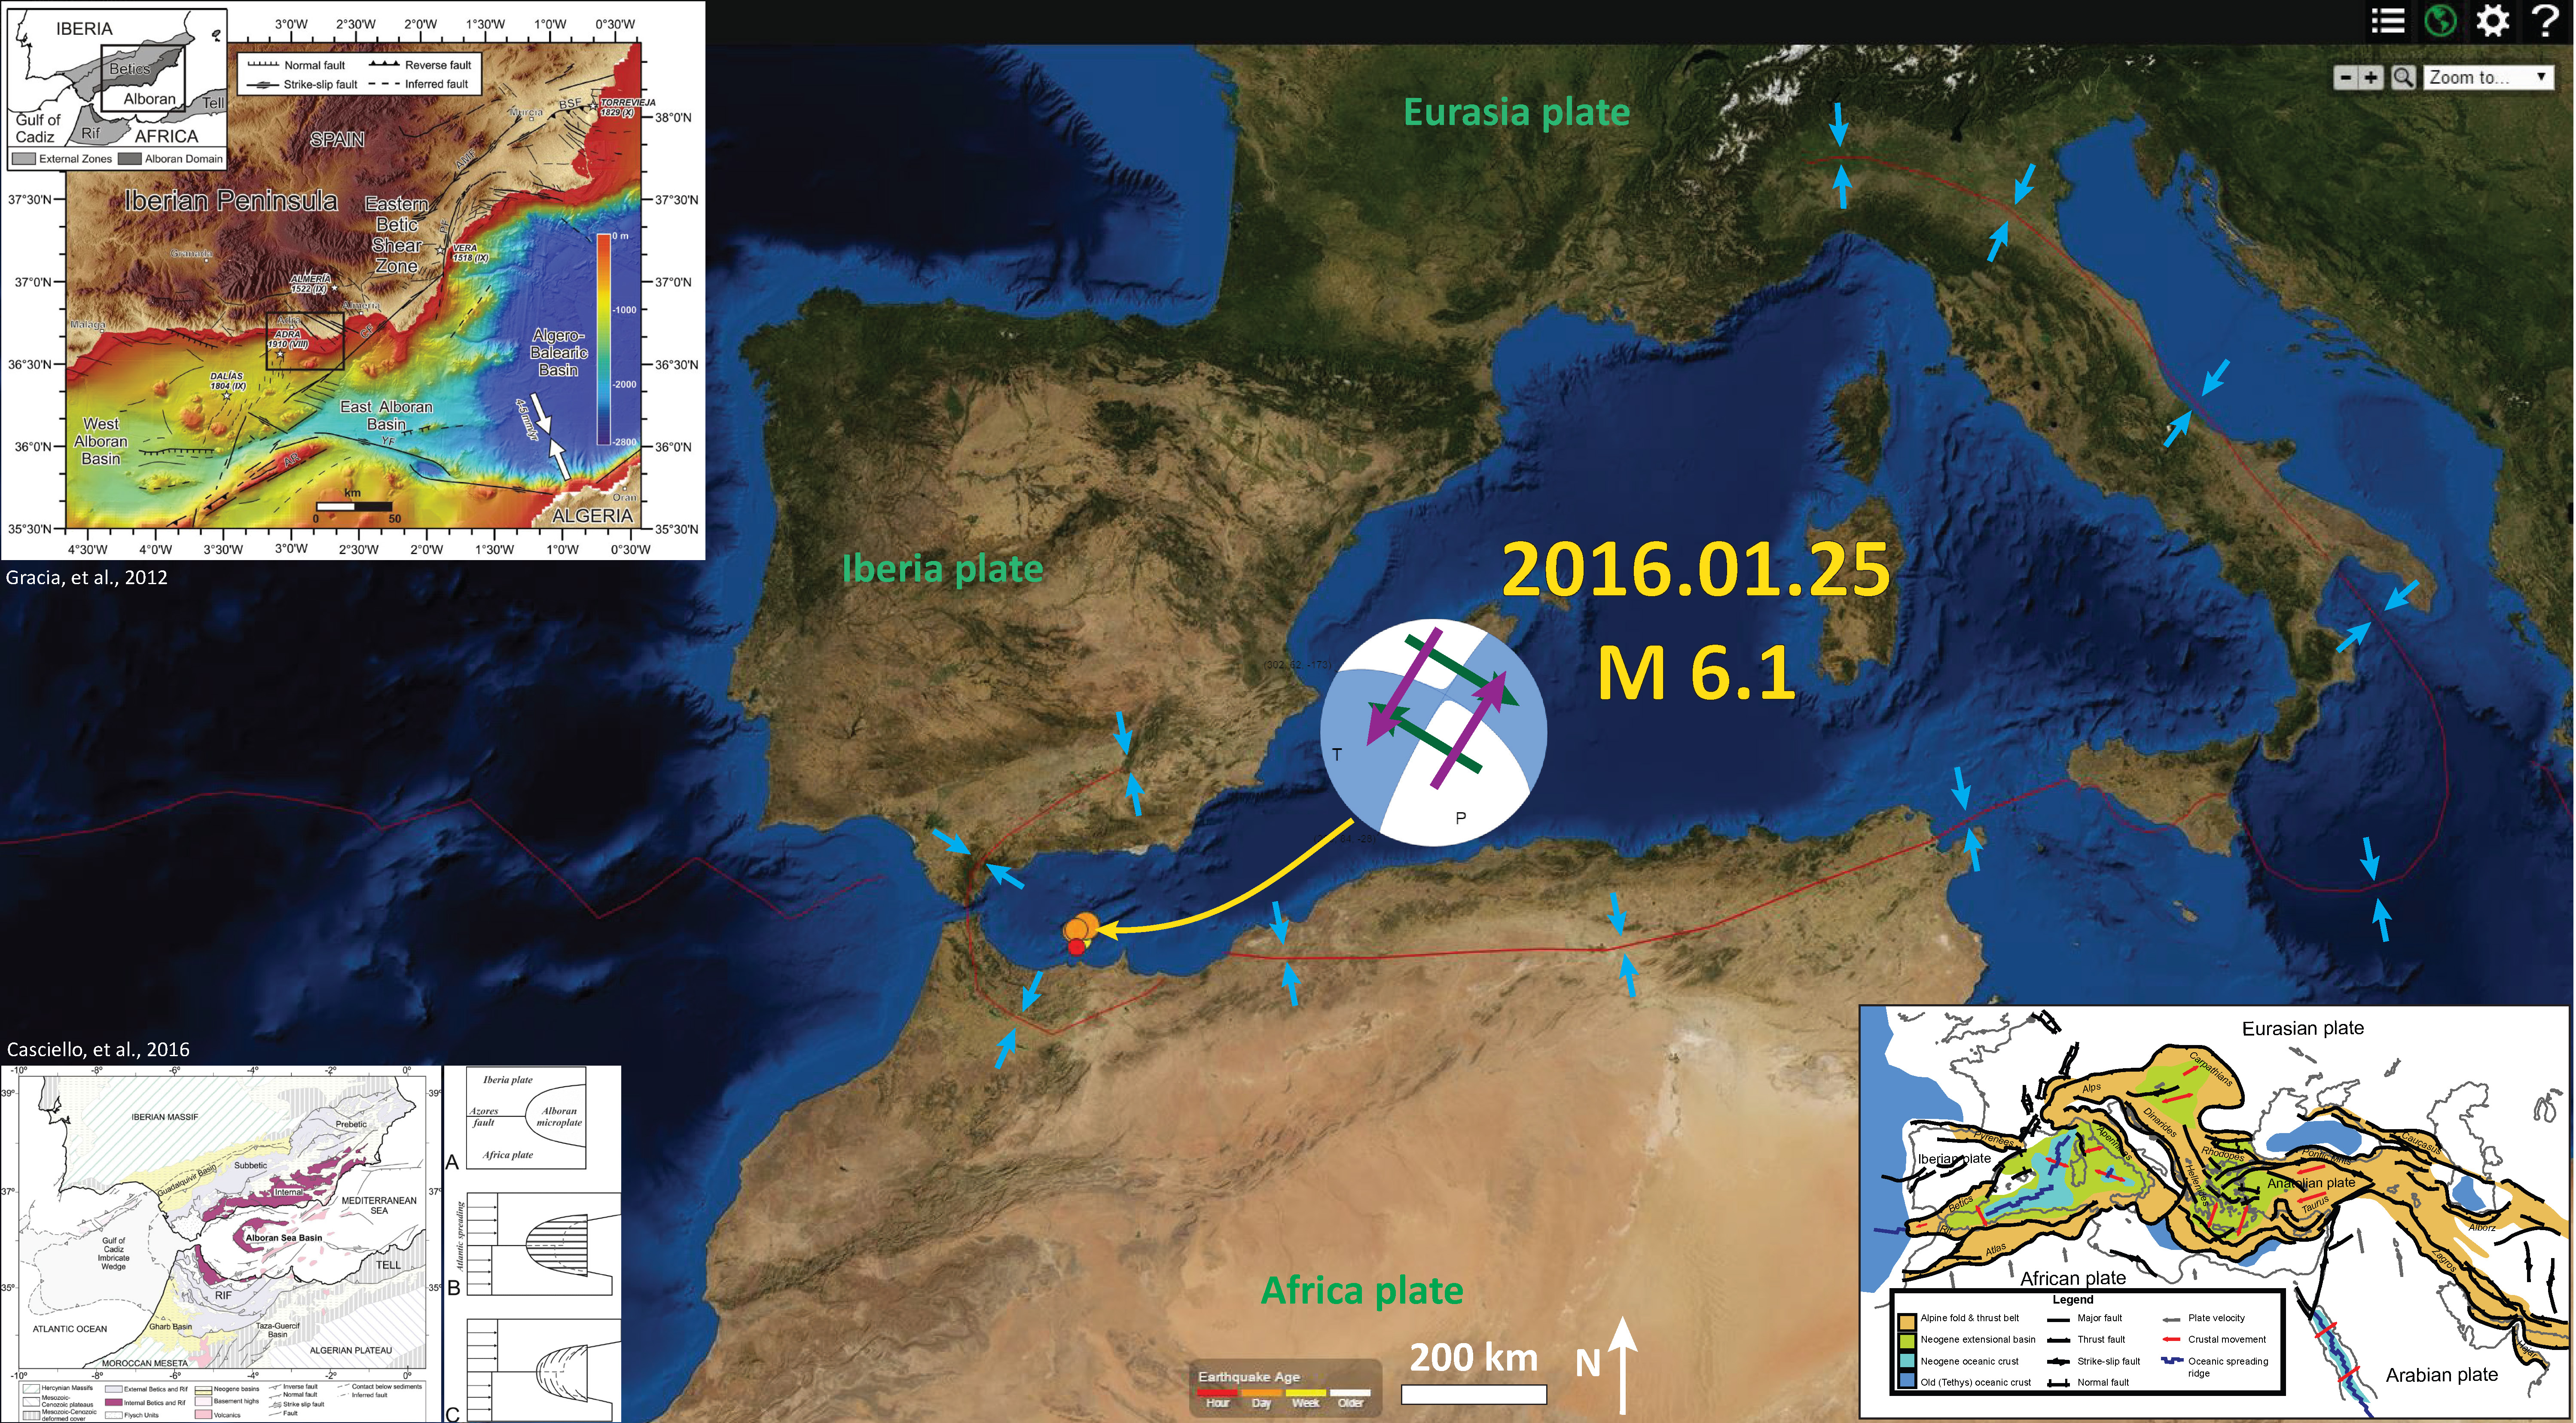
I also plot a moment tensor from an earthquake in the western Mediterranean from 2016.01.24 in the above map. Here is my Earthquake Report for that seismicity and below is the map from that report.
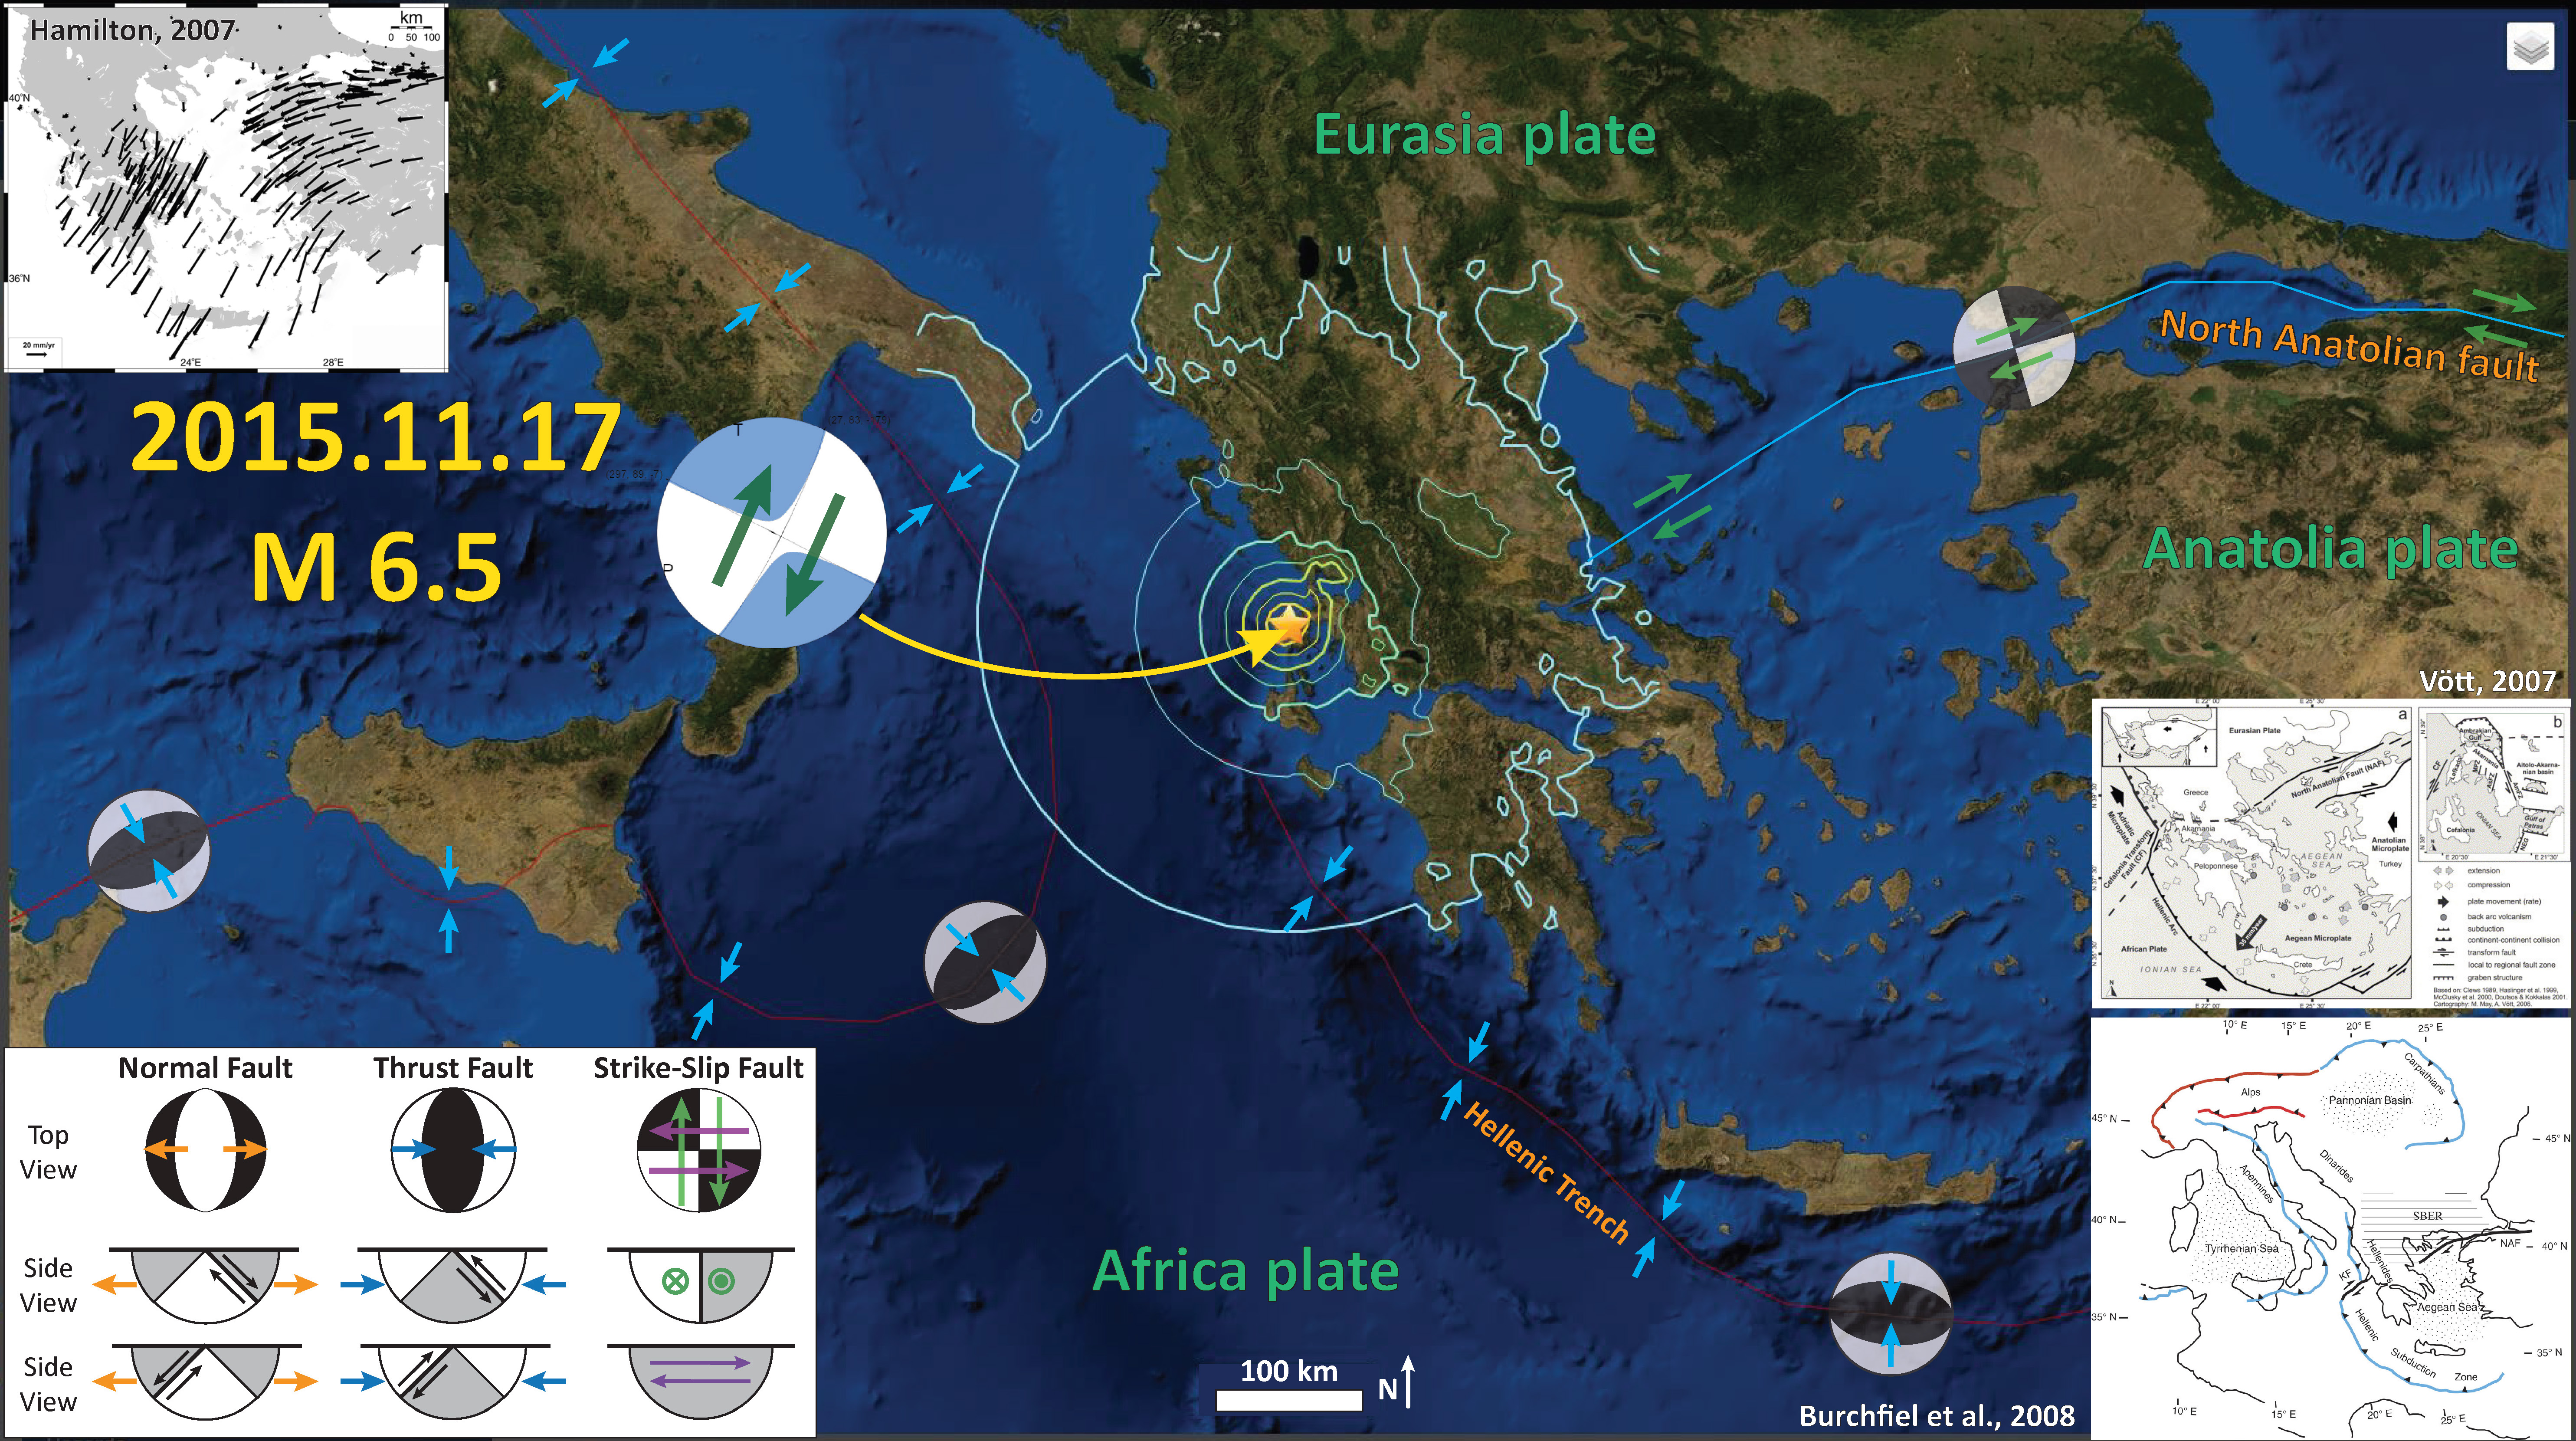
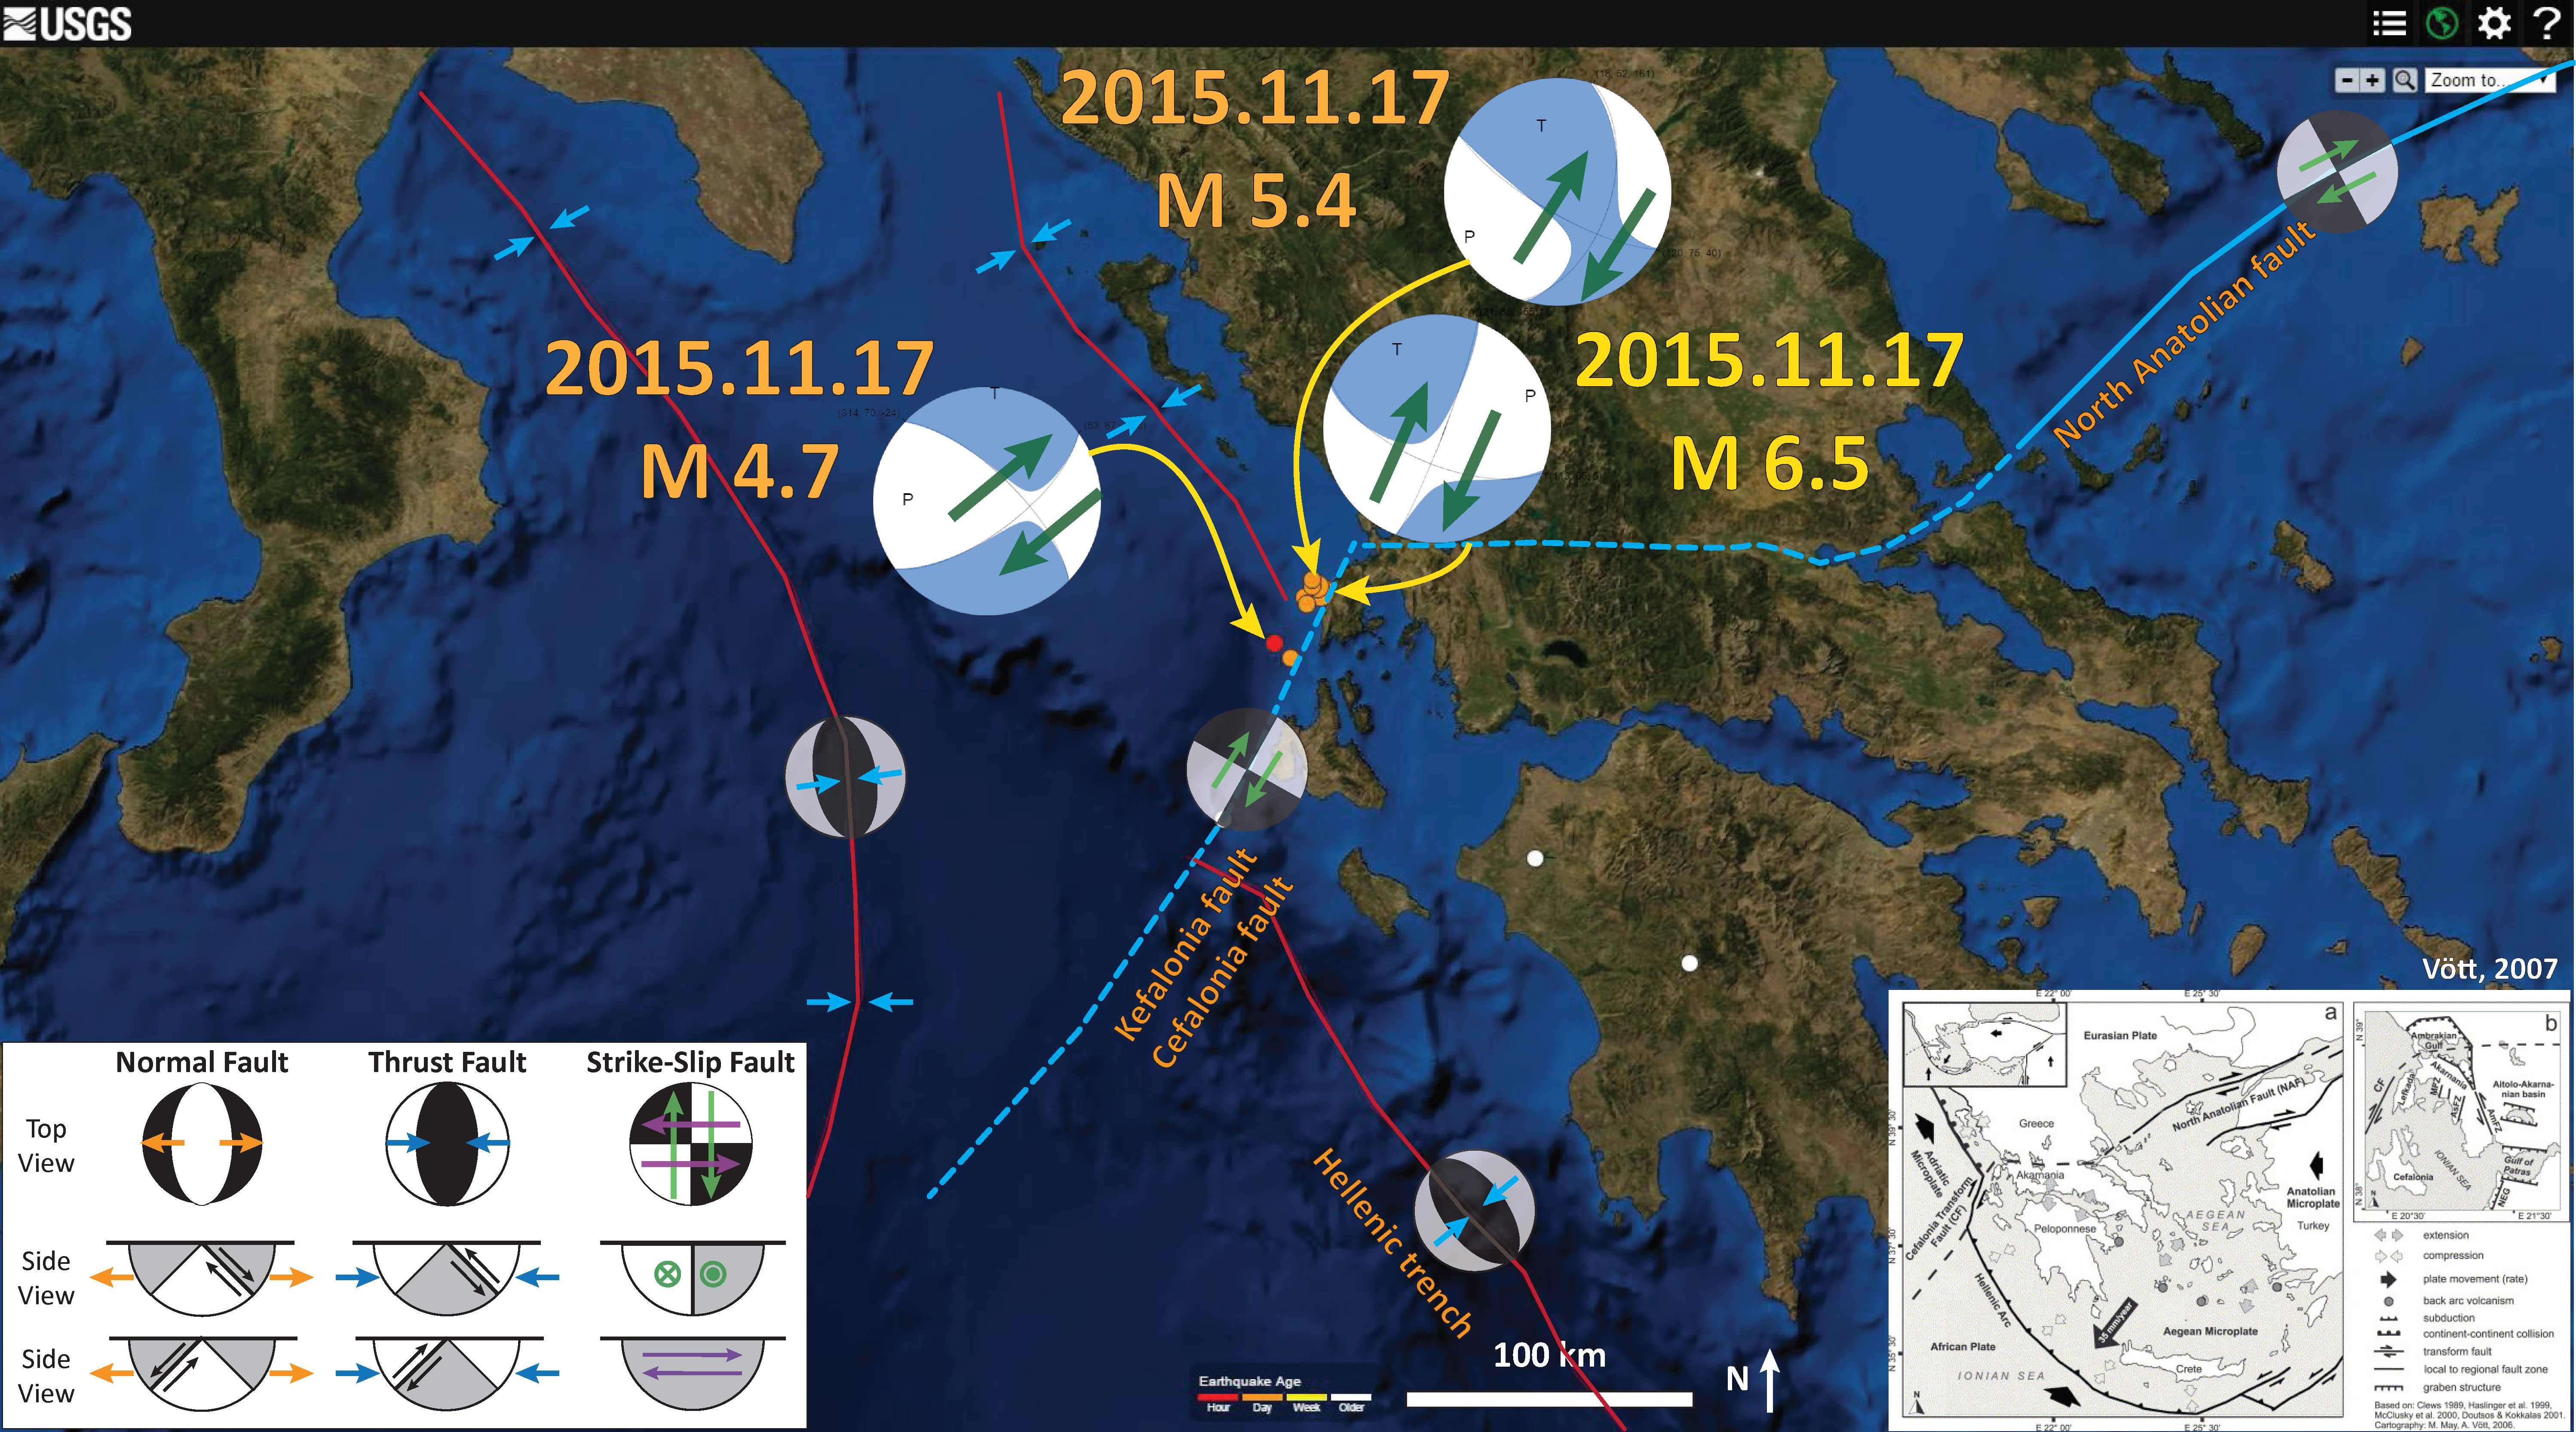
In late 2015 (2015.11.17) there was a M 6.5 earthquake along a fault related to the terminus of the North Anatolian fault system in western Greece. Here is my earthquake report for that seismicity and below is my map from that report. Below this first map is another map that shows some aftershocks.
Here is an updated map that shows a couple more aftershocks, at a large (local) scale. I have included the moment tensors for the two largest aftershocks.
For more on the graphical representation of moment tensors and focal mechanisms, check this IRIS video out:
-
Here are some observations made by others.
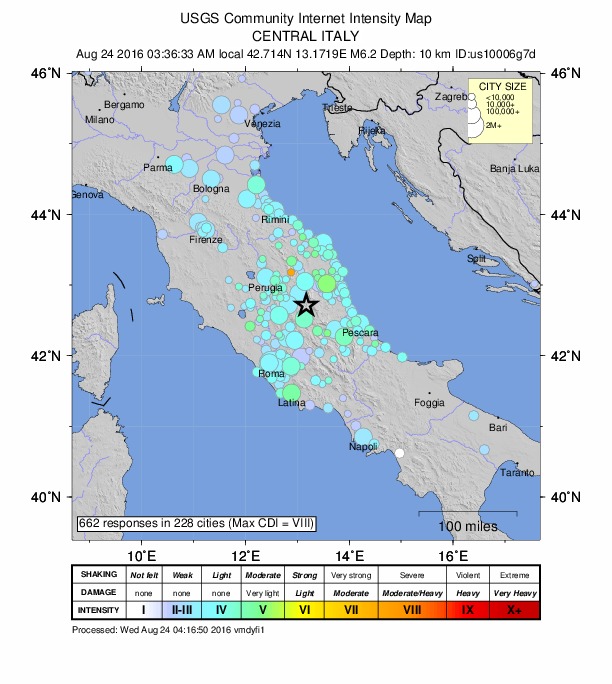
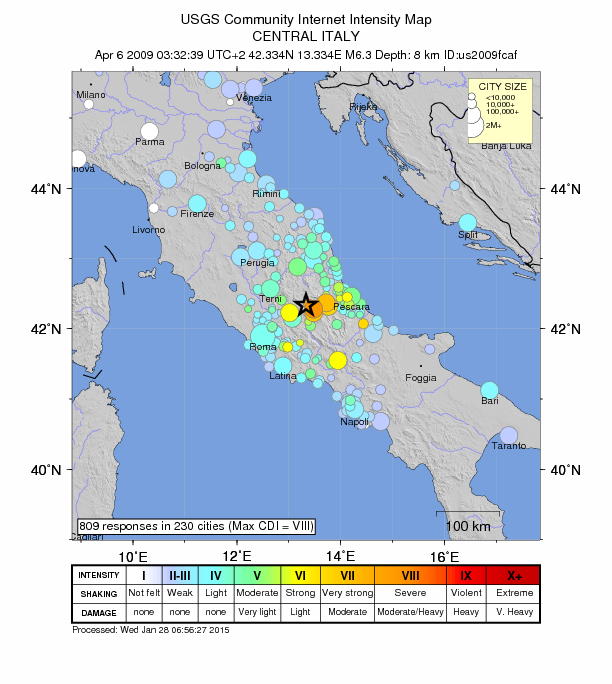
- Susan Hough (USGS) asked people tonight what they thought about explaining why the “DYFI” reports seemed too small compared to the GMPE model predictions. So far, I am unsatisfied with the answers. Looking at the plot from the 2009 M 6.3 earthquake, the region’s low population density would not appear to explain this discrepancy. Perhaps it is because today’s earthquake happened at night time, so maybe people have not yet reported yet. Below I include these GMPE/DYFI plots for both 2016.08.24 M 6.2 and 2009.04.06 M 6.3 earthquakes. Interesting that the DYFI reports for the 2009 earthquake also have higher MMI values, in general, than the 2016 earthquake. The difference between a M 6.2 and > 6.3 earthquake is about 3 times (a M 6.3 releases about 3 times as much energy as a M 6.2 earthquake), but these maps seem much more different than that. I plot the DYFI maps below the attenuation plots.
- 2016.08.24
- 2009.04.06
- 2016.08.24
- 2009.04.06
- David Schwartz (USGS) noted that tonight’s earthquake is “between the 1997 Assisi aftershock zone and the north end of the 2009 l’aquila rupture” and may be a “foreshock to a 1915-like Fucino rupture.” So we need to look at these two earthquakes to learn more about what Schwartz is talking about. Here is a web post about an INQUA workshop held in “Pescina, to commemorate the centenary of the 13/1/1915 M7 Fucino Earthquake.” This was posted by Stephanie Baize who is also on twitter. Follow him to learn more about tonight’s earthquake. There is a great paper that discusses the 1915 earthquake sequence that Schwartz was talking about here (Galadini and Galli, 1999). A more recent paper also discusses the faulting in this region (Palumbo et al., 2004).
-
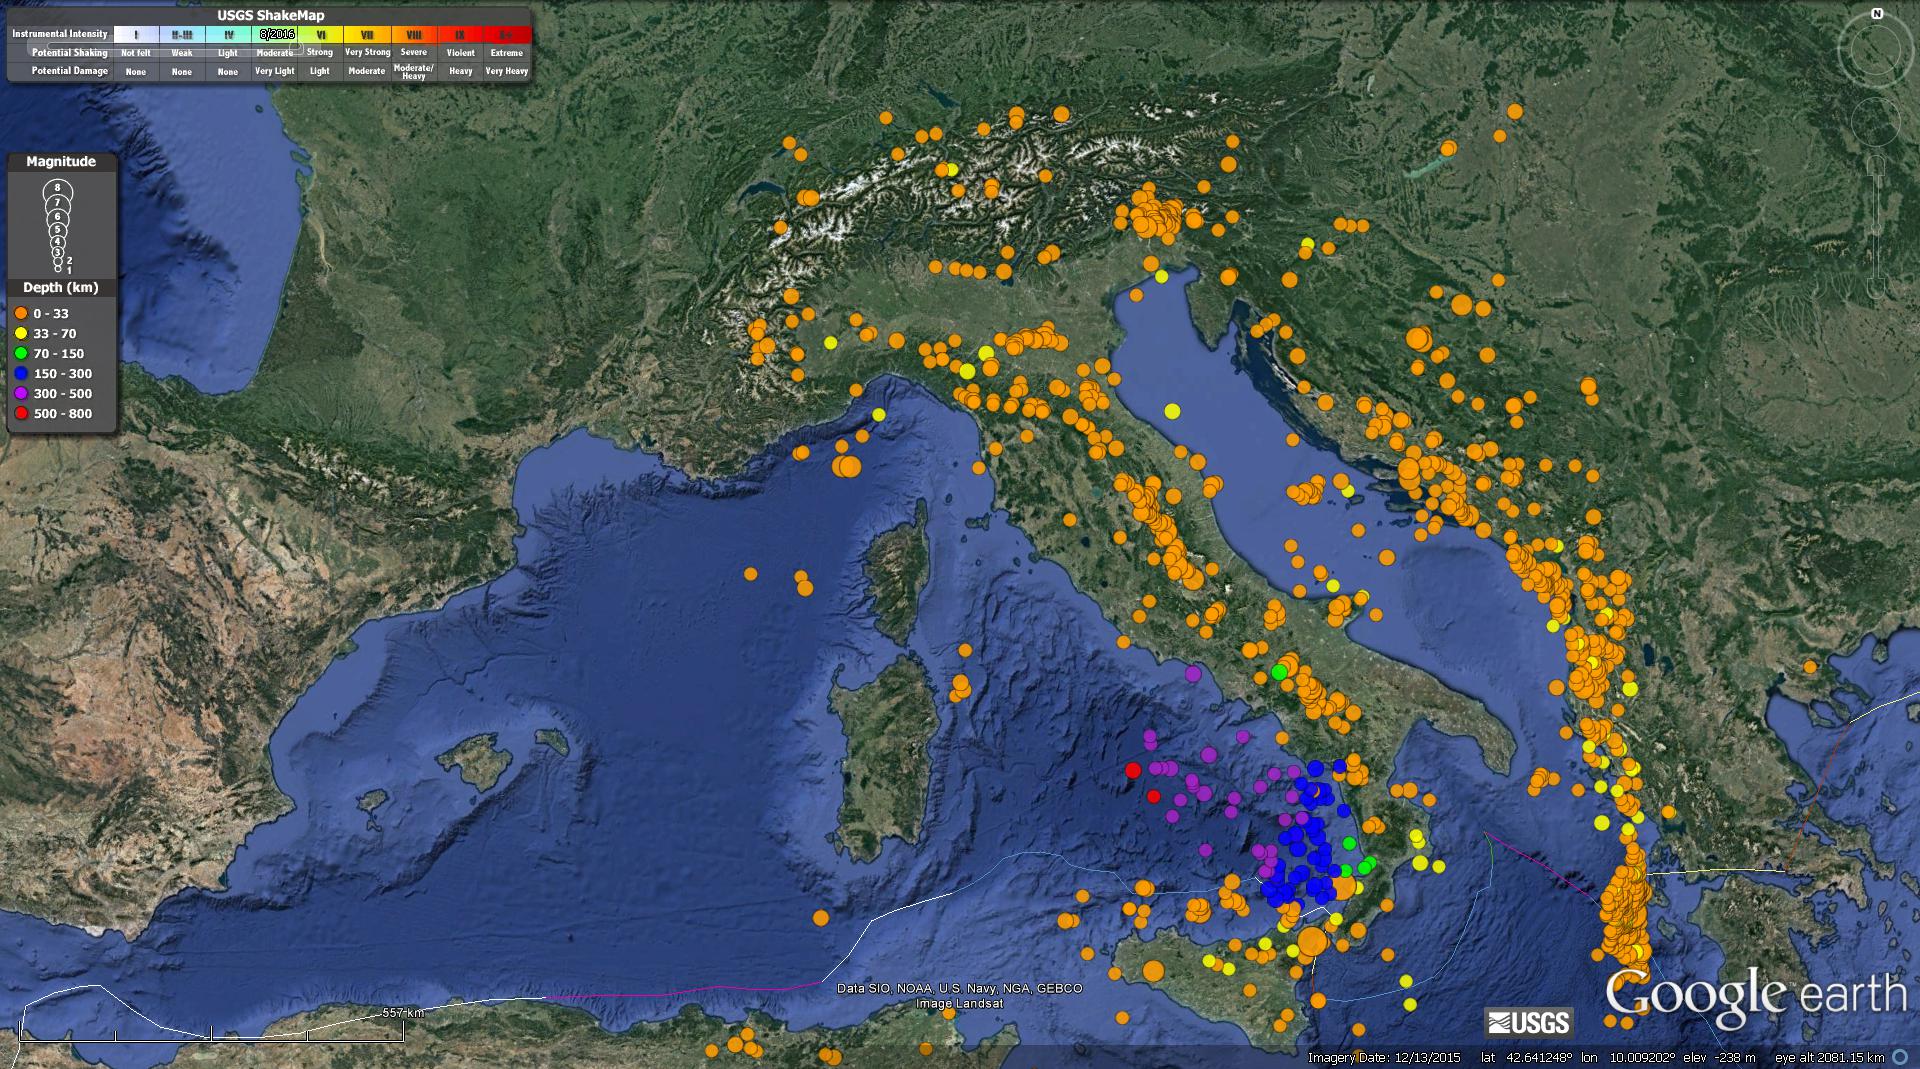
Here is a video of the historic seismicity of this region.
- First a static map showing all seismicity, plotted with color representing depth, for magnitudes greater than or equal to M 4.5.
- Here is a link to the embedded video below (5 MB mp4). Here is the query I used to make this map and video. Here is the kml file.
-
Here are some other maps that might help. (well, one so far)
- This Billi et al. (2006) map shows some of these west dipping normal faults in central Italy, just south of the Apennines.
- There are some excellent maps and figures from a study from 2004 (Boncio et al, 2004). This material was posted on twitter here.
-
References:
- Billi et al., 2006.
- Boncio et al., 2004. Defining a model of 3D seismogenic sources for Seismic Hazard Assessment applications: The case of central Apennines (Italy) in Journal of Seismology, v. 8, p. 417-125.
- Galadini, F. and Galli, P., 1999. The Holocene paleoearthquakes on the 1915 Avezzano earthquake faults (central Italy): implications for active tectonics in the central Apennines in Tectonophysics, v. 308, p. 143-170.
- Palumbo et al., 2004. Slip history of the Magnola fault (Apennines, Central Italy) from 36Cl surface exposure dating: evidence for strong earthquakes over the Holocene in Earth and Planetary Science Letters, v. 225, p. 163–176.


8 thoughts on “Earthquake Report: Italy”