I hope not too many bottles of Sierra Nevada broke from this small earthquake. Based on the “Did You Feel It?” reports, I suspect that this did not happen. Here is the USGS website for this M = 3.5 earthquake.
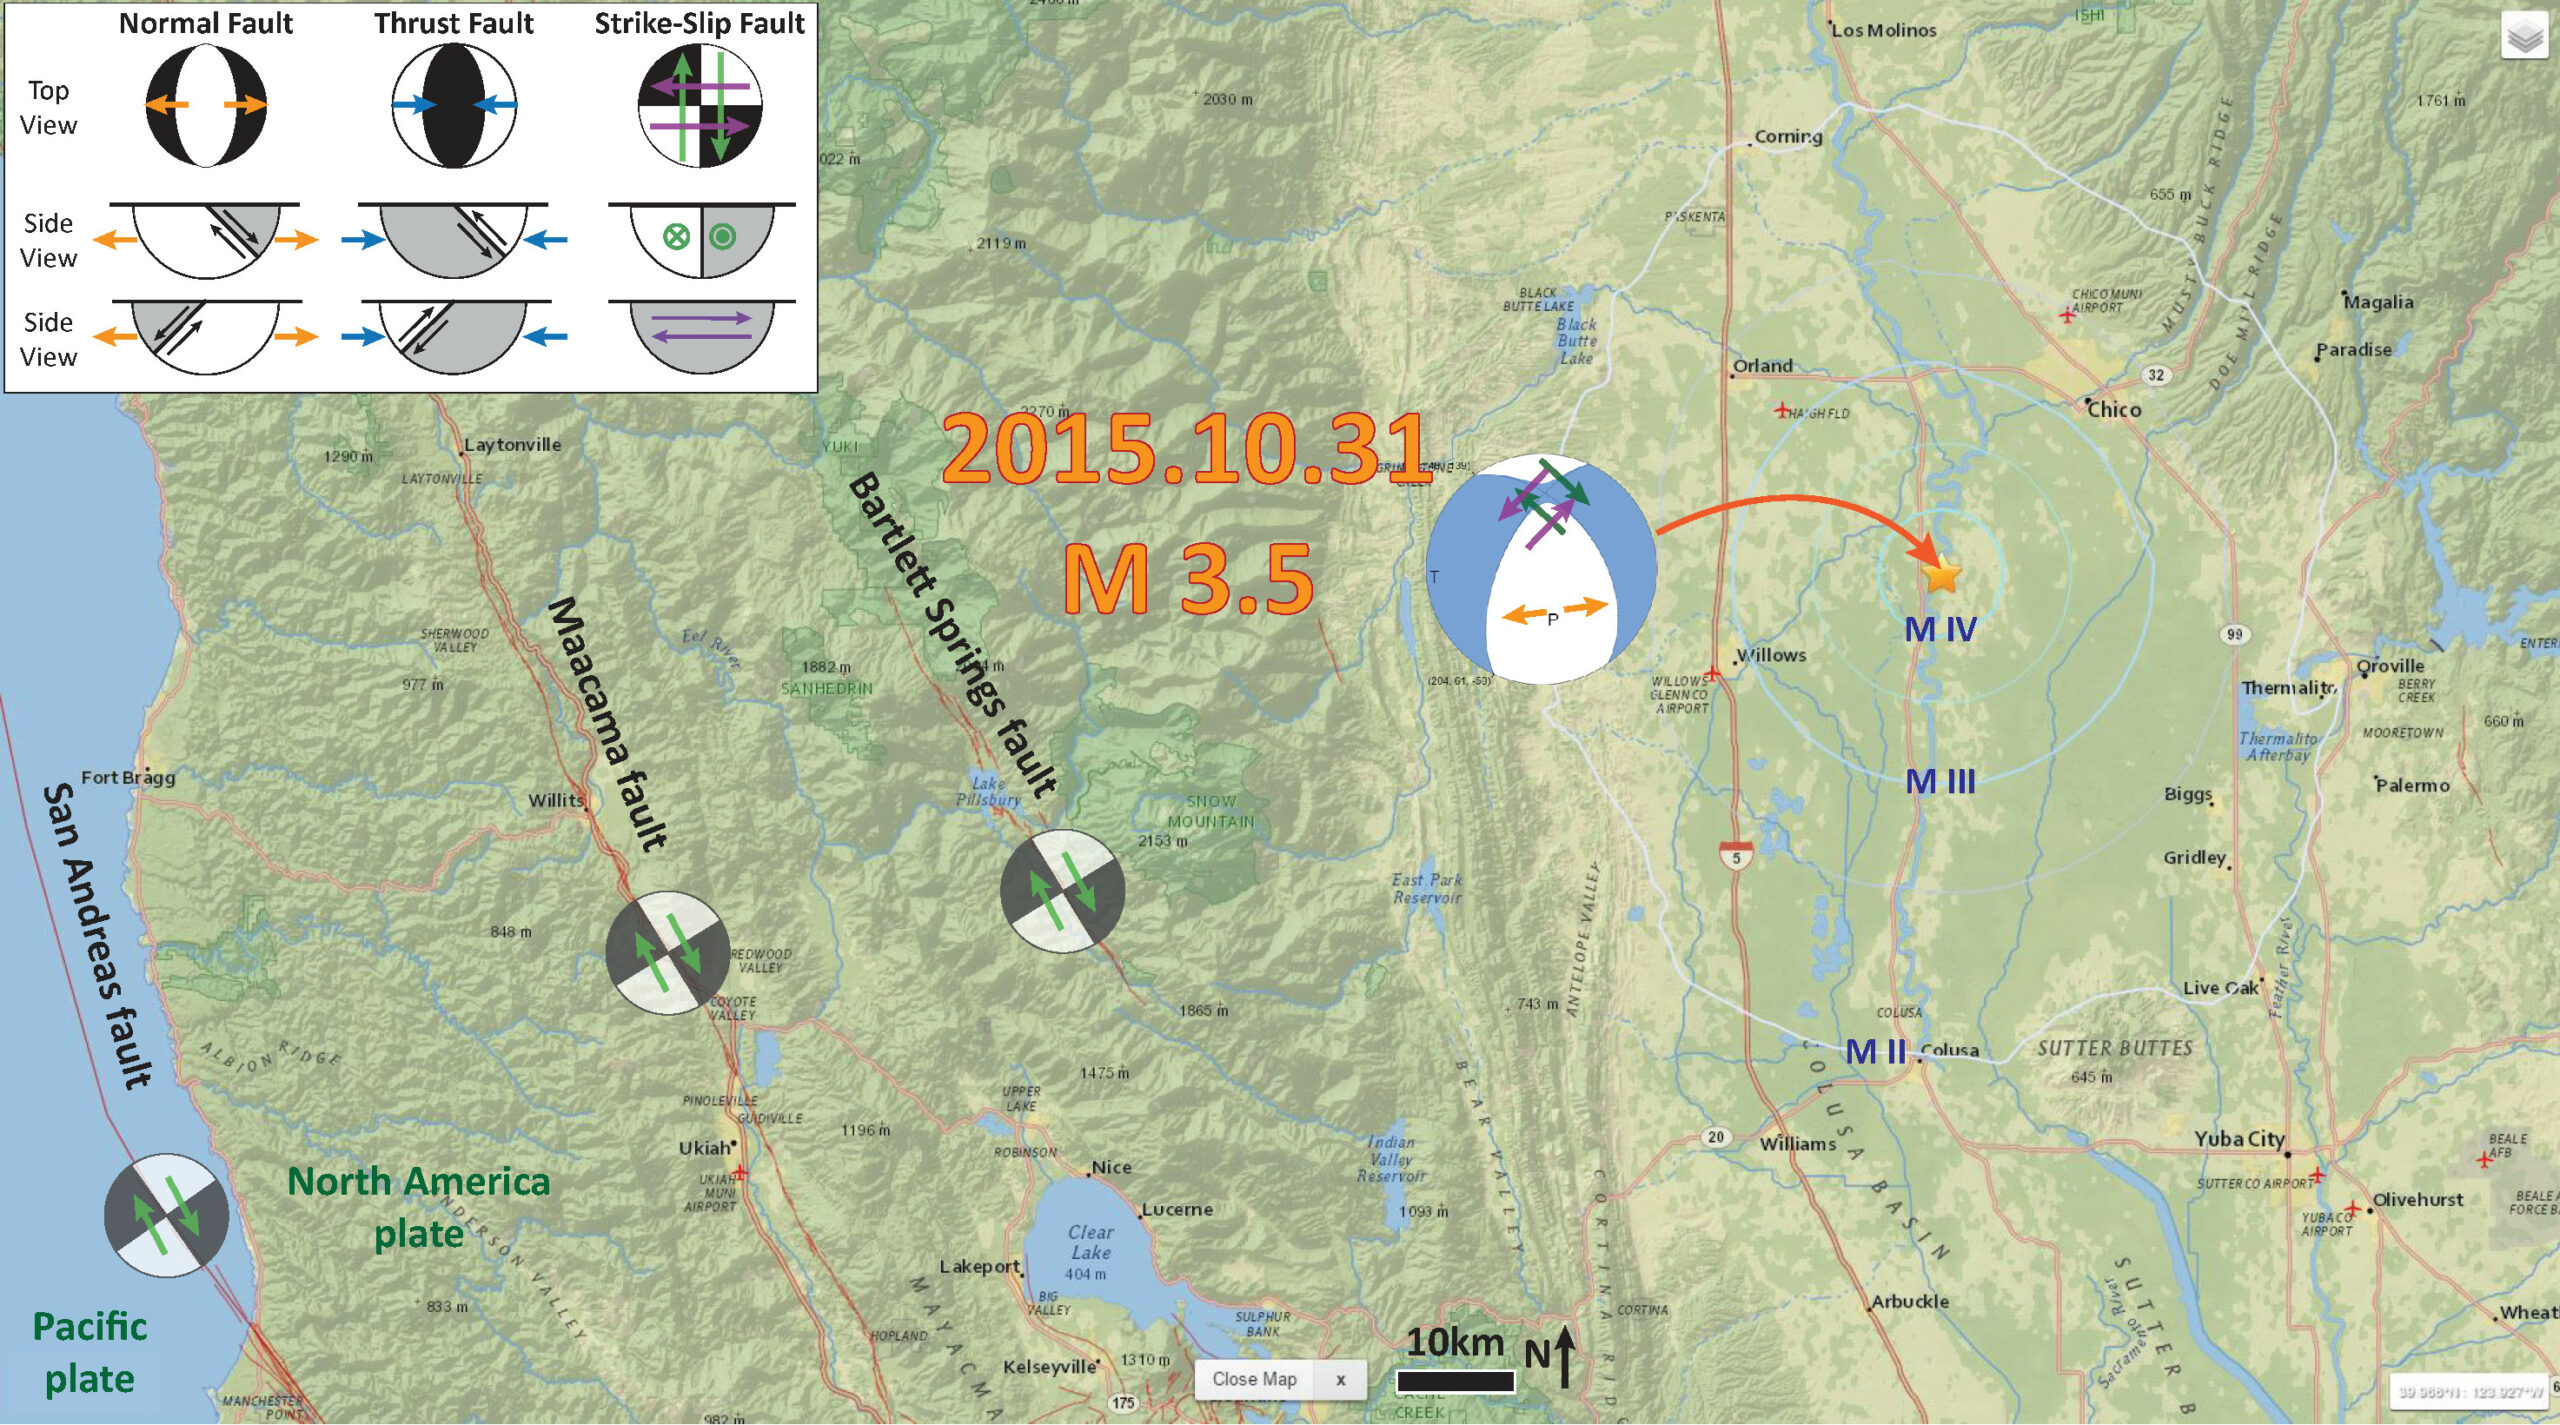
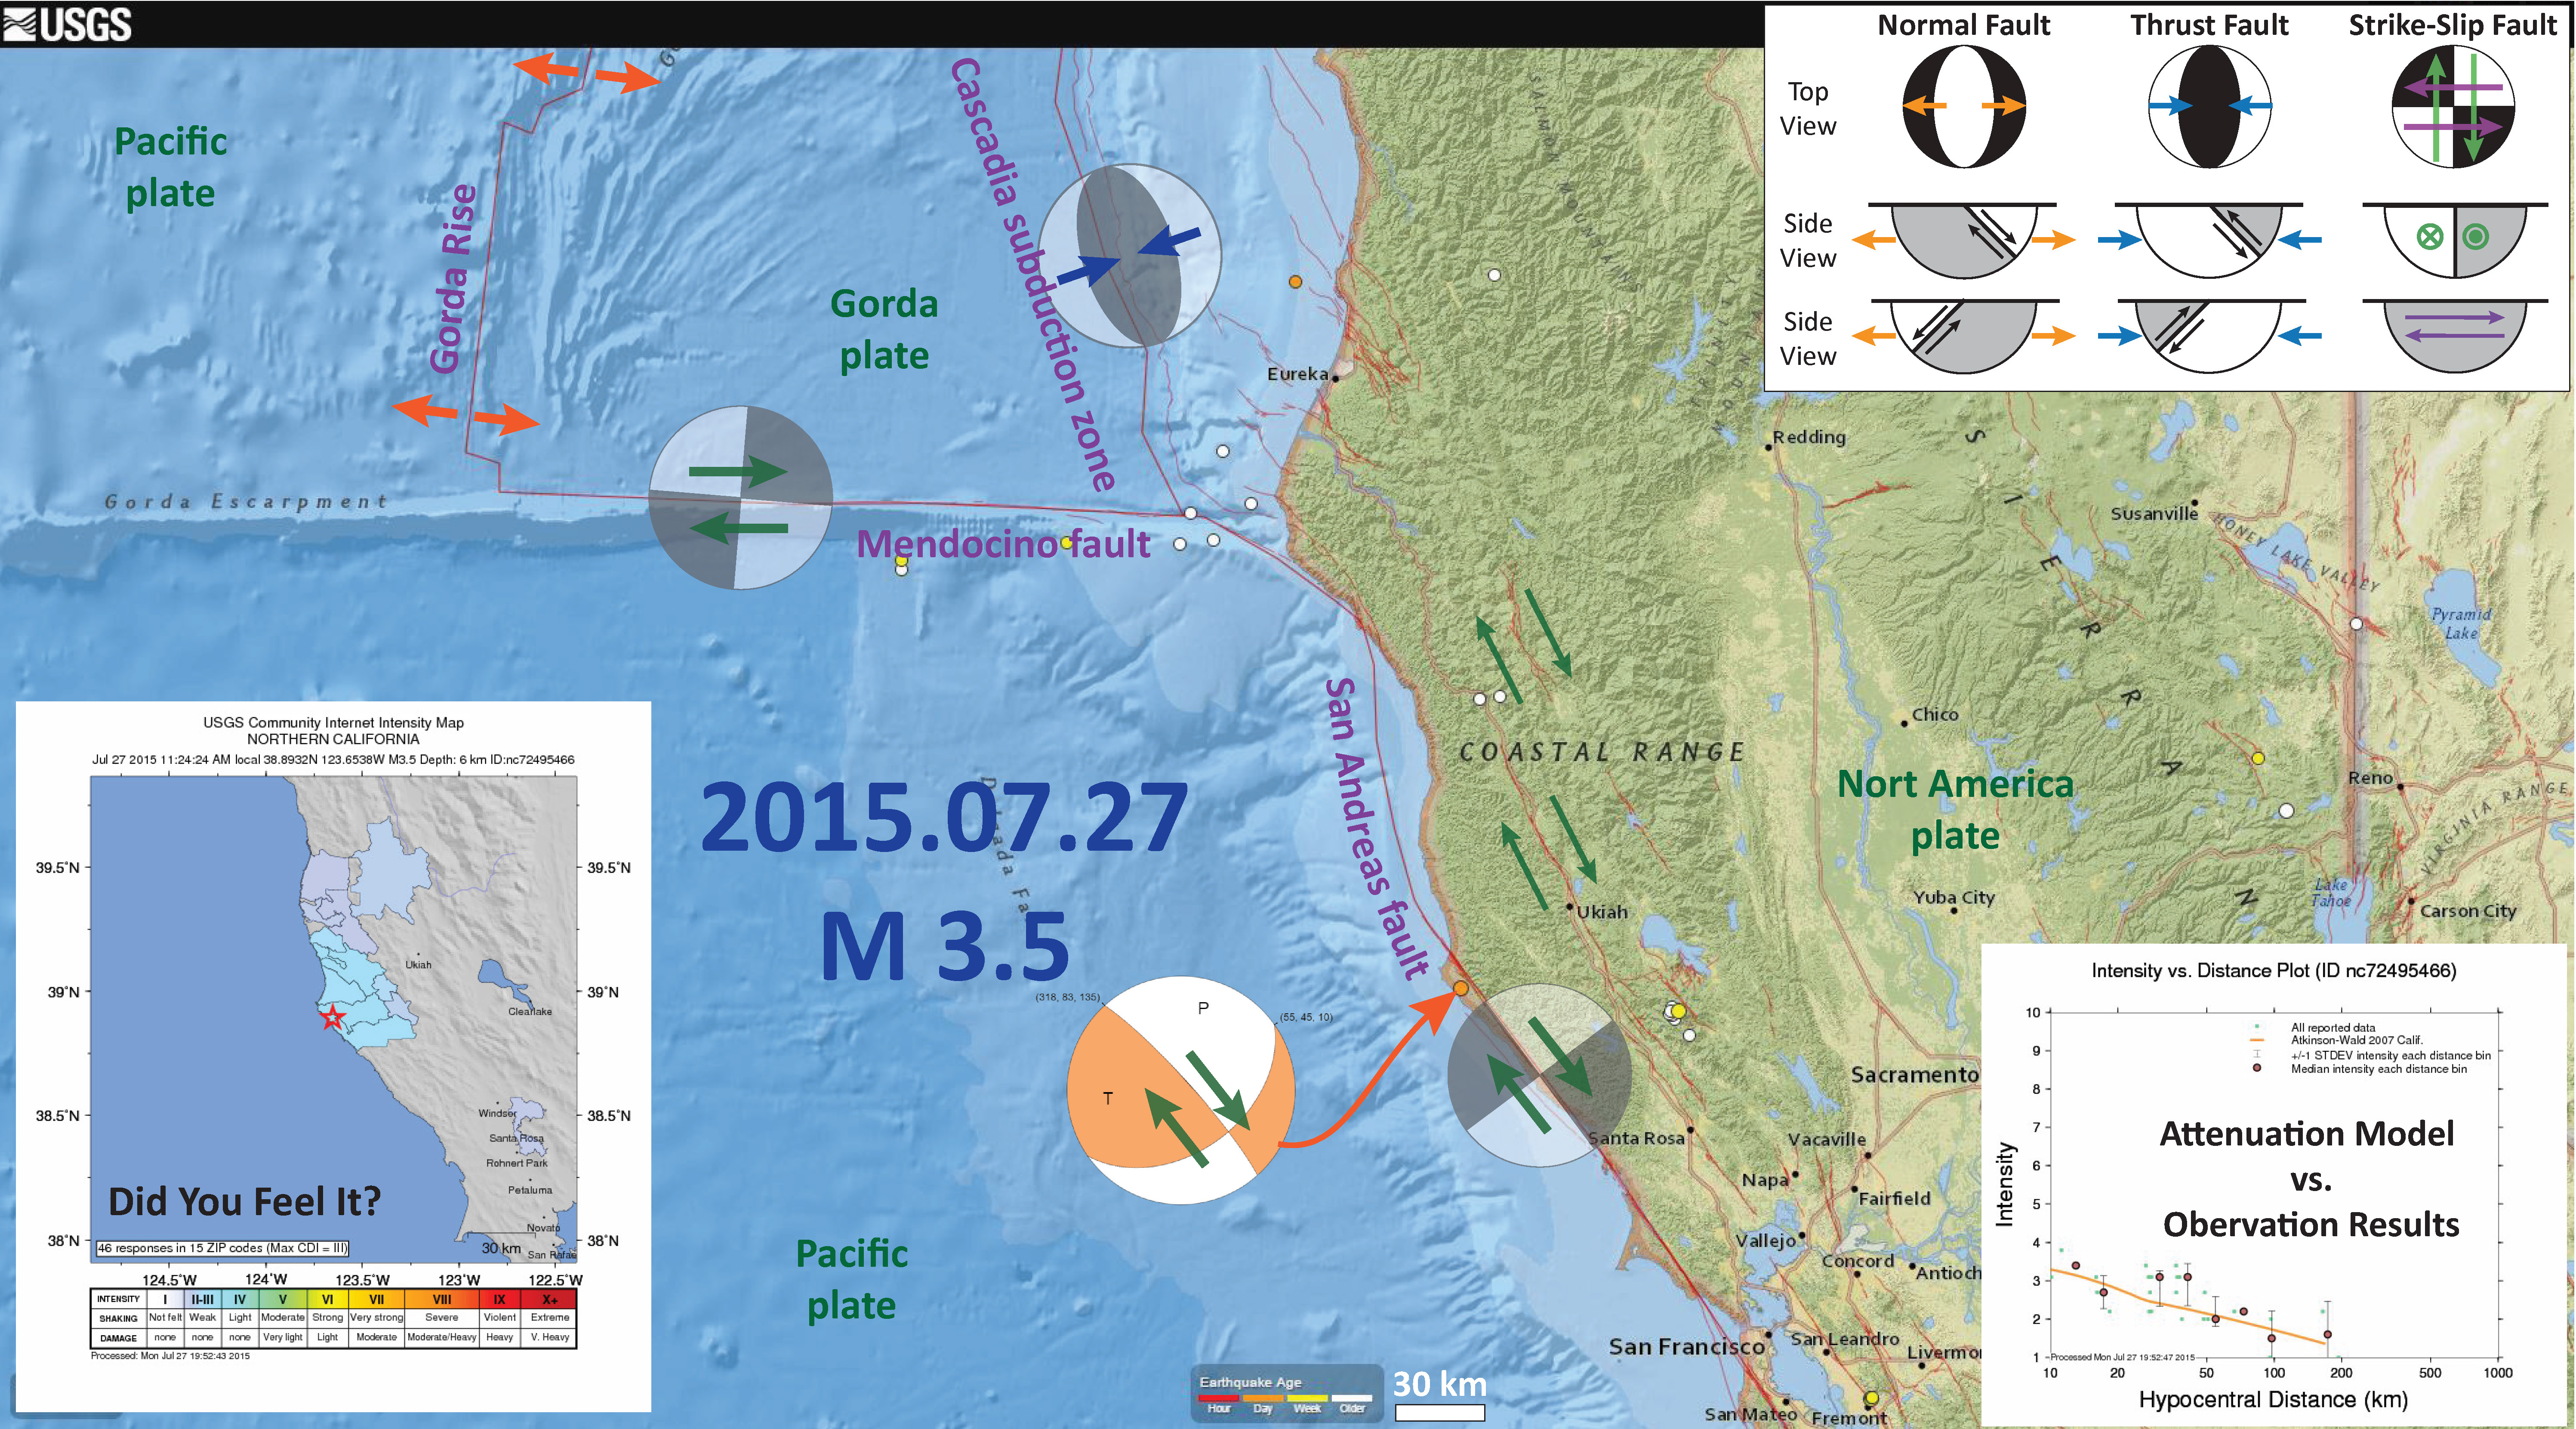
Here is a map that shows the epicenter as a golden star (makes me think of Willy Wonka). I also include the shaking intensity contours on the map. These use the Modified Mercalli Intensity Scale (see the legend on the map). This is based upon a computer model estimate of ground motions, different from the “Did You Feel It?” estimate of ground motions that is actually based on real observations. The Modified Mercalli Intensity contours are plotted, with a max MMI = MIV. See the attenuation plot versus distance below to compare the difference between this model estimate and the real observations. The fit is pretty good.
I placed a moment tensor / focal mechanism legend in the upper left corner of the map. There is more material from the USGS web sites about moment tensors and focal mechanisms (the beach ball symbols). Both moment tensors and focal mechanisms are solutions to seismologic data that reveal two possible interpretations for fault orientation and sense of motion. One must use other information, like the regional tectonics, to interpret which of the two possibilities is more likely.
I plot the USGS moment tensor for this earthquake. This M = 3.5 earthquake shows an extensional earthquake, with oblique slip (partly strike-slip). I place orange arrows showing the extensional direction. It is difficult to know which is the correct nodal plane (which of the two possibilities are correct), so I plot both potential senses of strike-slip motion. Others may have stronger opinions about how to interpret this earthquake moment tensor.

Here is the plot showing how the shaking intensity attenuates with distance from the earthquake. The orange line is a model based estimate (Ground Motion Prediction Equation), which is based on empirical relations between earthquake magnitude and observations of ground motion recorded by seismometers (for hundreds of earthquakes in California). The blue dots are actual observations from the USGS “Did You Feel It?” web form.

The San Andreas fault is a right-lateral strike-slip transform plate boundary between the Pacific and North America plates. The plate boundary is composed of faults that are parallel to sub-parallel to the SAF and extend from the west coast of CA to the Wasatch fault (WF) system in central Utah (the WF runs through Salt Lake City and is expressed by the mountain range on the east side of the basin that Salt Lake City is built within). The map above shows the three major regional players along the transform plate boundary between the Pacific plate to the west and the North America plate to the east. The SAF, MF, and BSF are all right lateral strike-slip fault systems, which accommodate decreasing amounts of plate boundary motion from west to east.
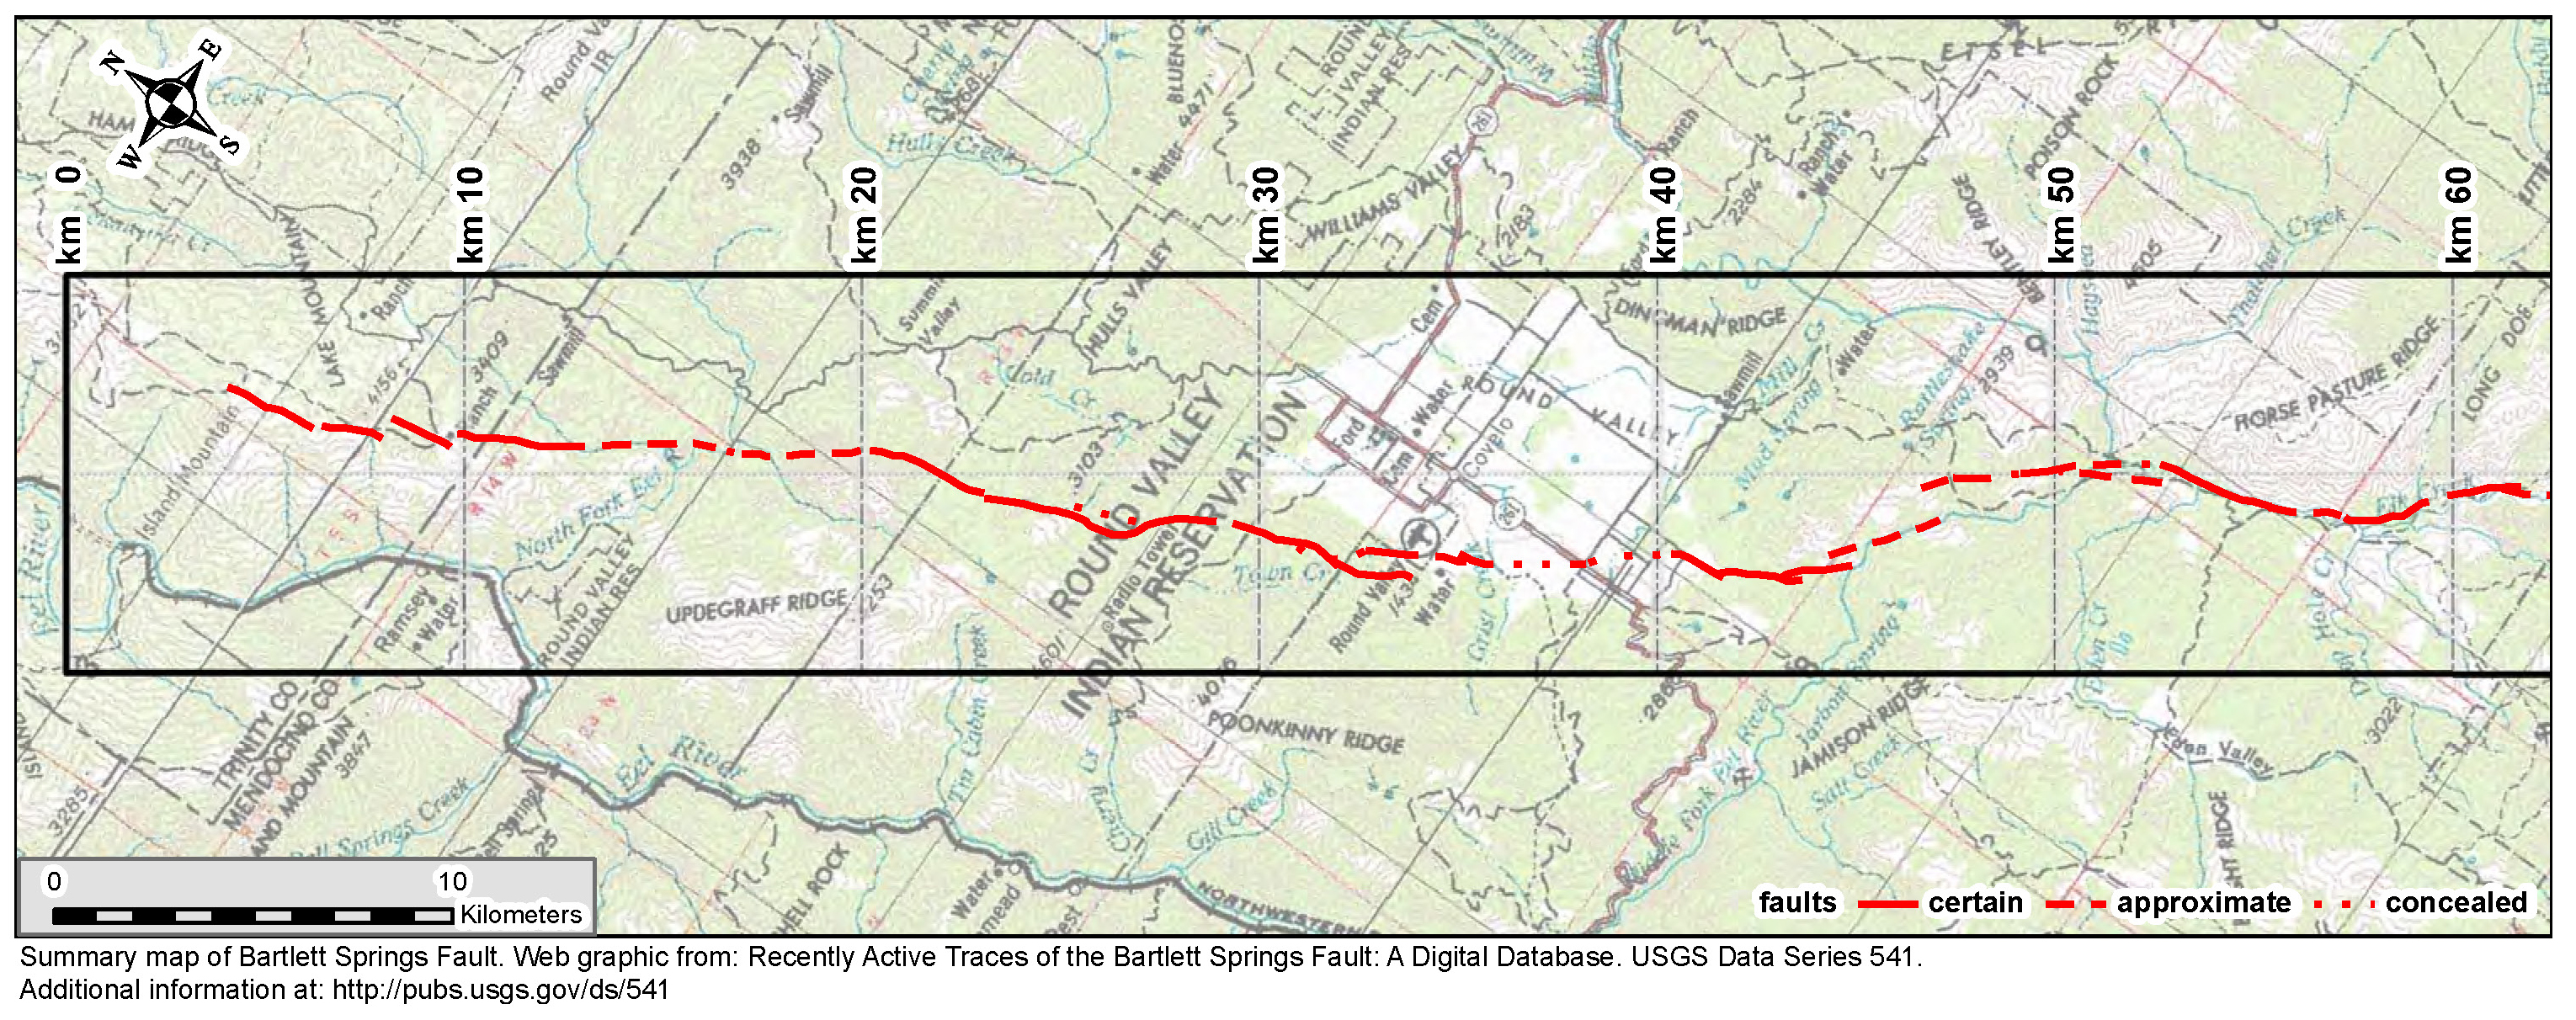
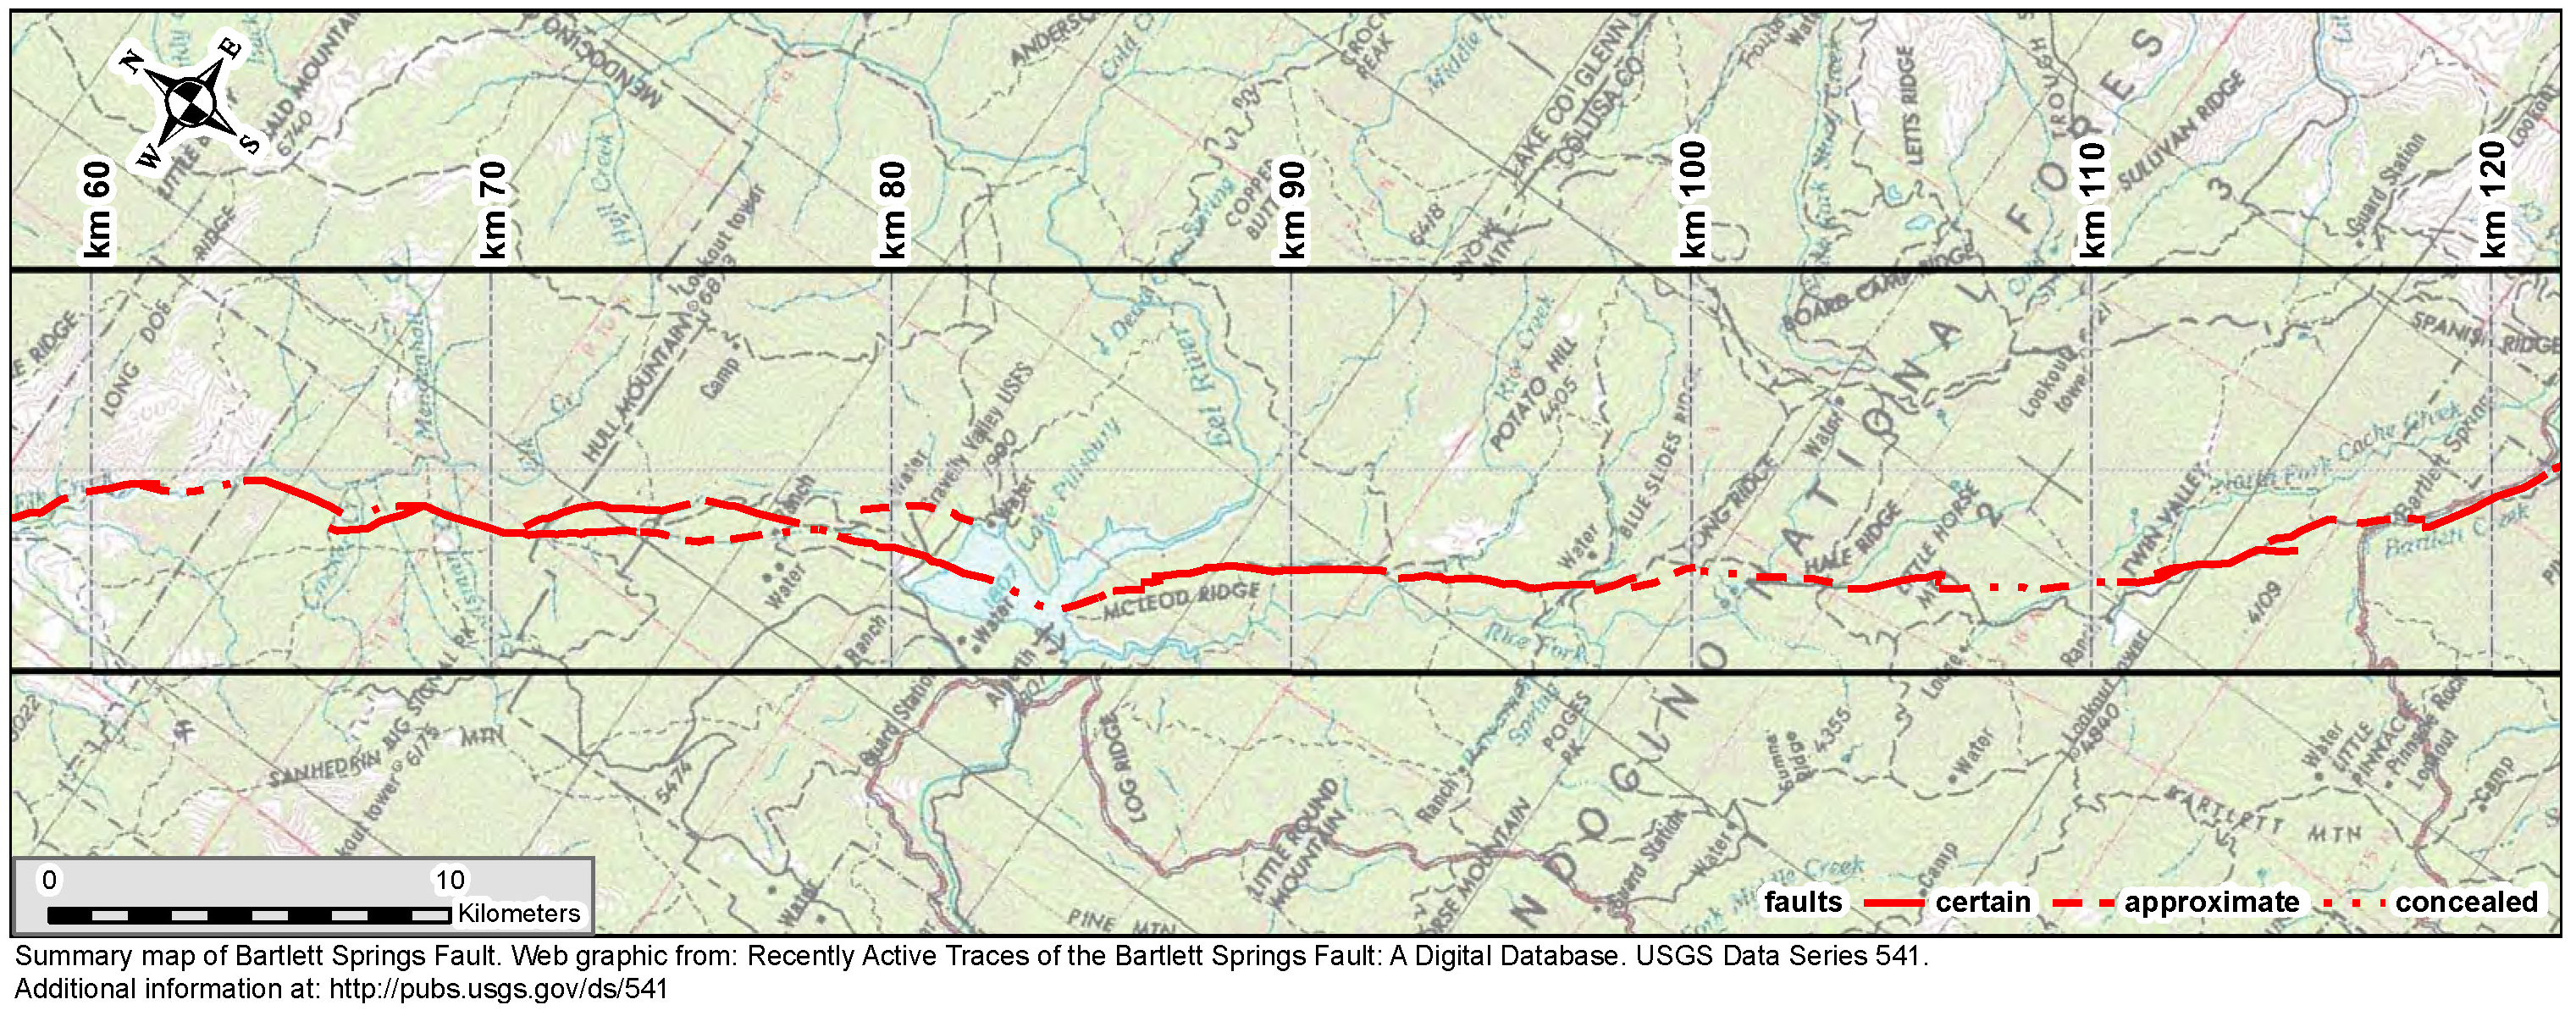
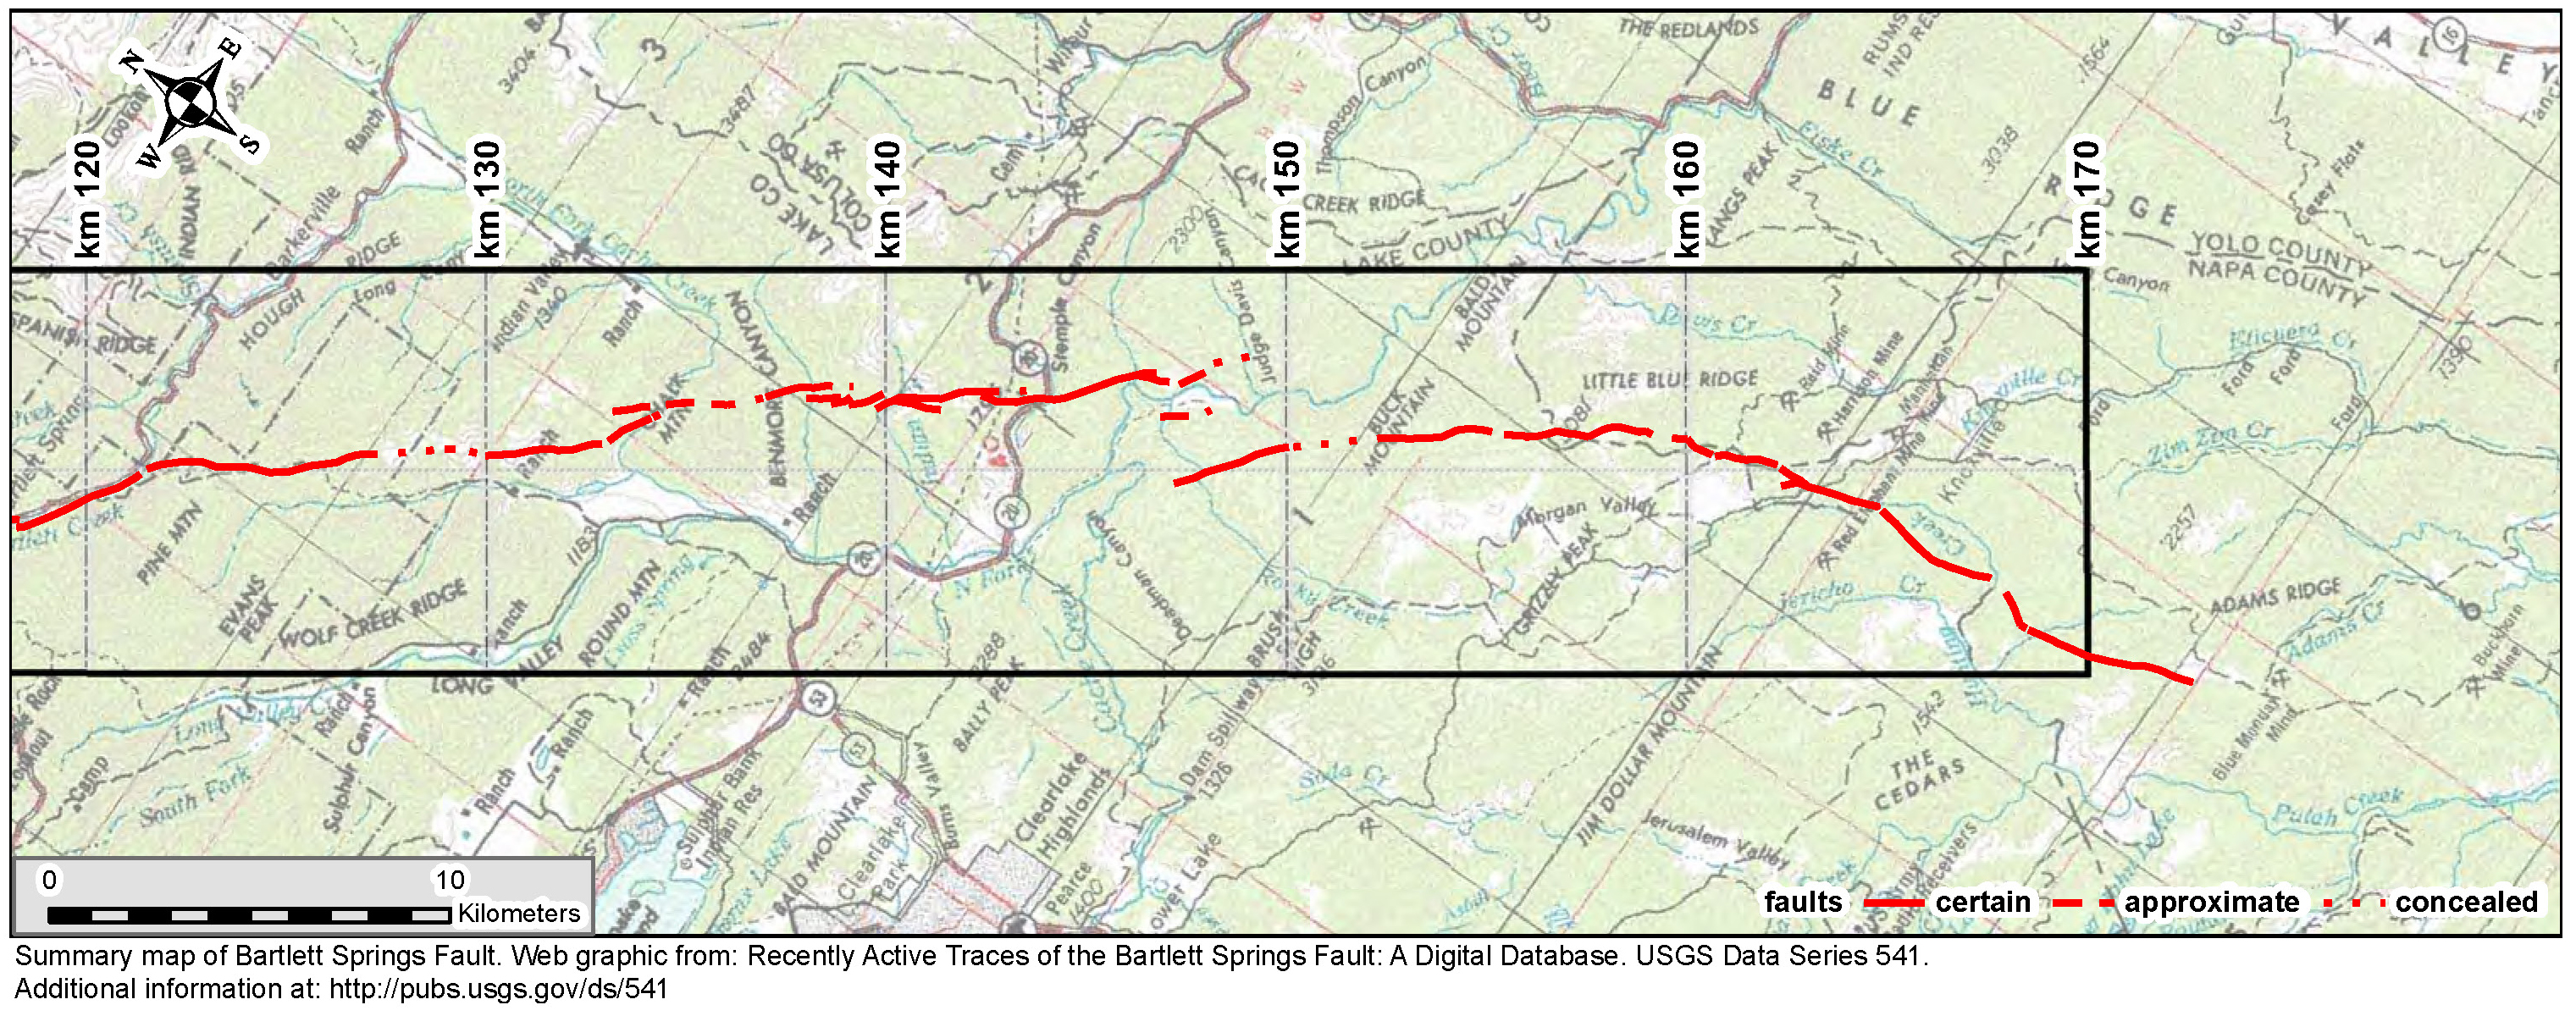
The BSF is currently being investigated by Bob McPherson (Humboldt State University, Dept. of Geology). Please contact Bob (Robert.McPherson at humboldt.edu) for more information. Other work on the BSF has been presented in various USGS reports. James Lienkaemper published a report on the BSF as the USGS Data Series 541. Below is a map series from this report.
Also published in 2010 is a geologic map of the region (Ohlin et al., 2010). Here is the report. They also published the GIS data presented in their report.

There was recently an earthquake in the block separating the SAF and the MF. Below is a map from my report on that earthquake. I present more about the SAF plate boundary on that earthquake report page.
I place a map shows the configuration of faults in central (San Francisco) and northern (Point Delgada – Punta Gorda) CA (Wallace, 1990). Here is the caption for this map, that is on the lower left corner of my map. Below the citation is this map presented on its own.
Geologic sketch map of the northern Coast Ranges, central California, showing faults with Quaternary activity and basin deposits in northern section of the San Andreas fault system. Fault patterns are generalized, and only major faults are shown. Several Quaternary basins are fault bounded and aligned parallel to strike-slip faults, a relation most apparent along the Hayward-Rodgers Creek-Maacama fault trend.

Moving further west, there was an earthquake probably along the SAF near Point Arena in July of 2015. Here is my earthquake report for this M = 3.5 earthquake. Below is a map that I prepared for that earthquake. There is more about the SAF in this region on that earthquake report page.
-
References:
- Lienkaemper, James J., 2010. Recently active traces of the Bartlett Springs Fault, California; a digital
database: U.S. Geological Survey Data Series 541, 10 p. and data [http://pubs.usgs.gov/ds/541/]. - Ohlin, H.N., McLaughlin, R.J., Moring, B.C., and Sawyer, T.L., 2010. Geologic map of the Bartlett Springs Fault Zone in the vicinity of Lake Pillsbury and adjacent areas of Mendocino, Lake, and Glenn Counties, California: U.S. Geological Survey Open-File Report 2010–1301, scale 1:30,000. (Available at http://pubs.usgs.gov/sim/3125/.)
- Wallace, Robert E., ed., 1990. The San Andreas fault system, California: U.S. Geological Survey Professional Paper 1515, 283 p. [http://pubs.usgs.gov/pp/1988/1434/].
When we had the earthquake last week, my first response (after duck, cover, hold) was that I’d look on your FB page to get the best and quickest update, USGS was 2nd… Awesome information as always!
thanks Lauren!
I took care of it.
Russell Shapiro. Thank you Russell.