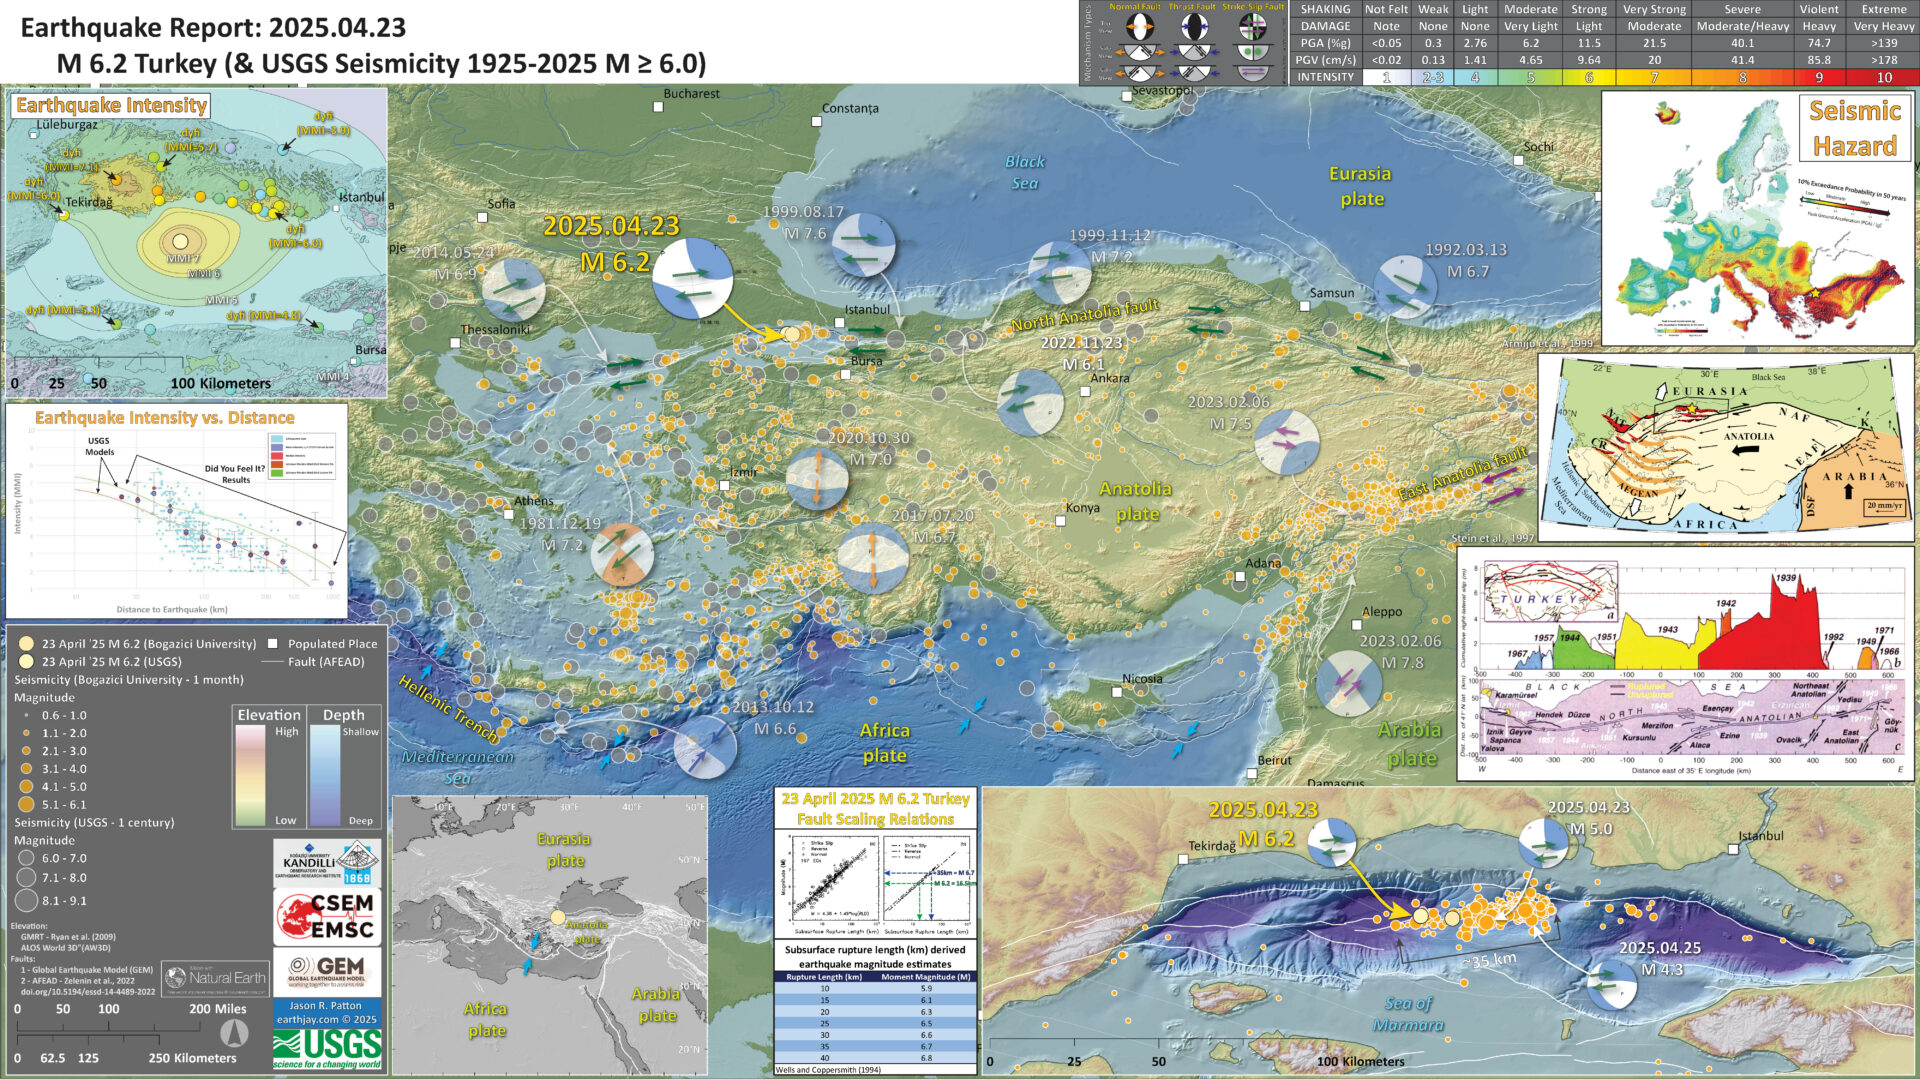
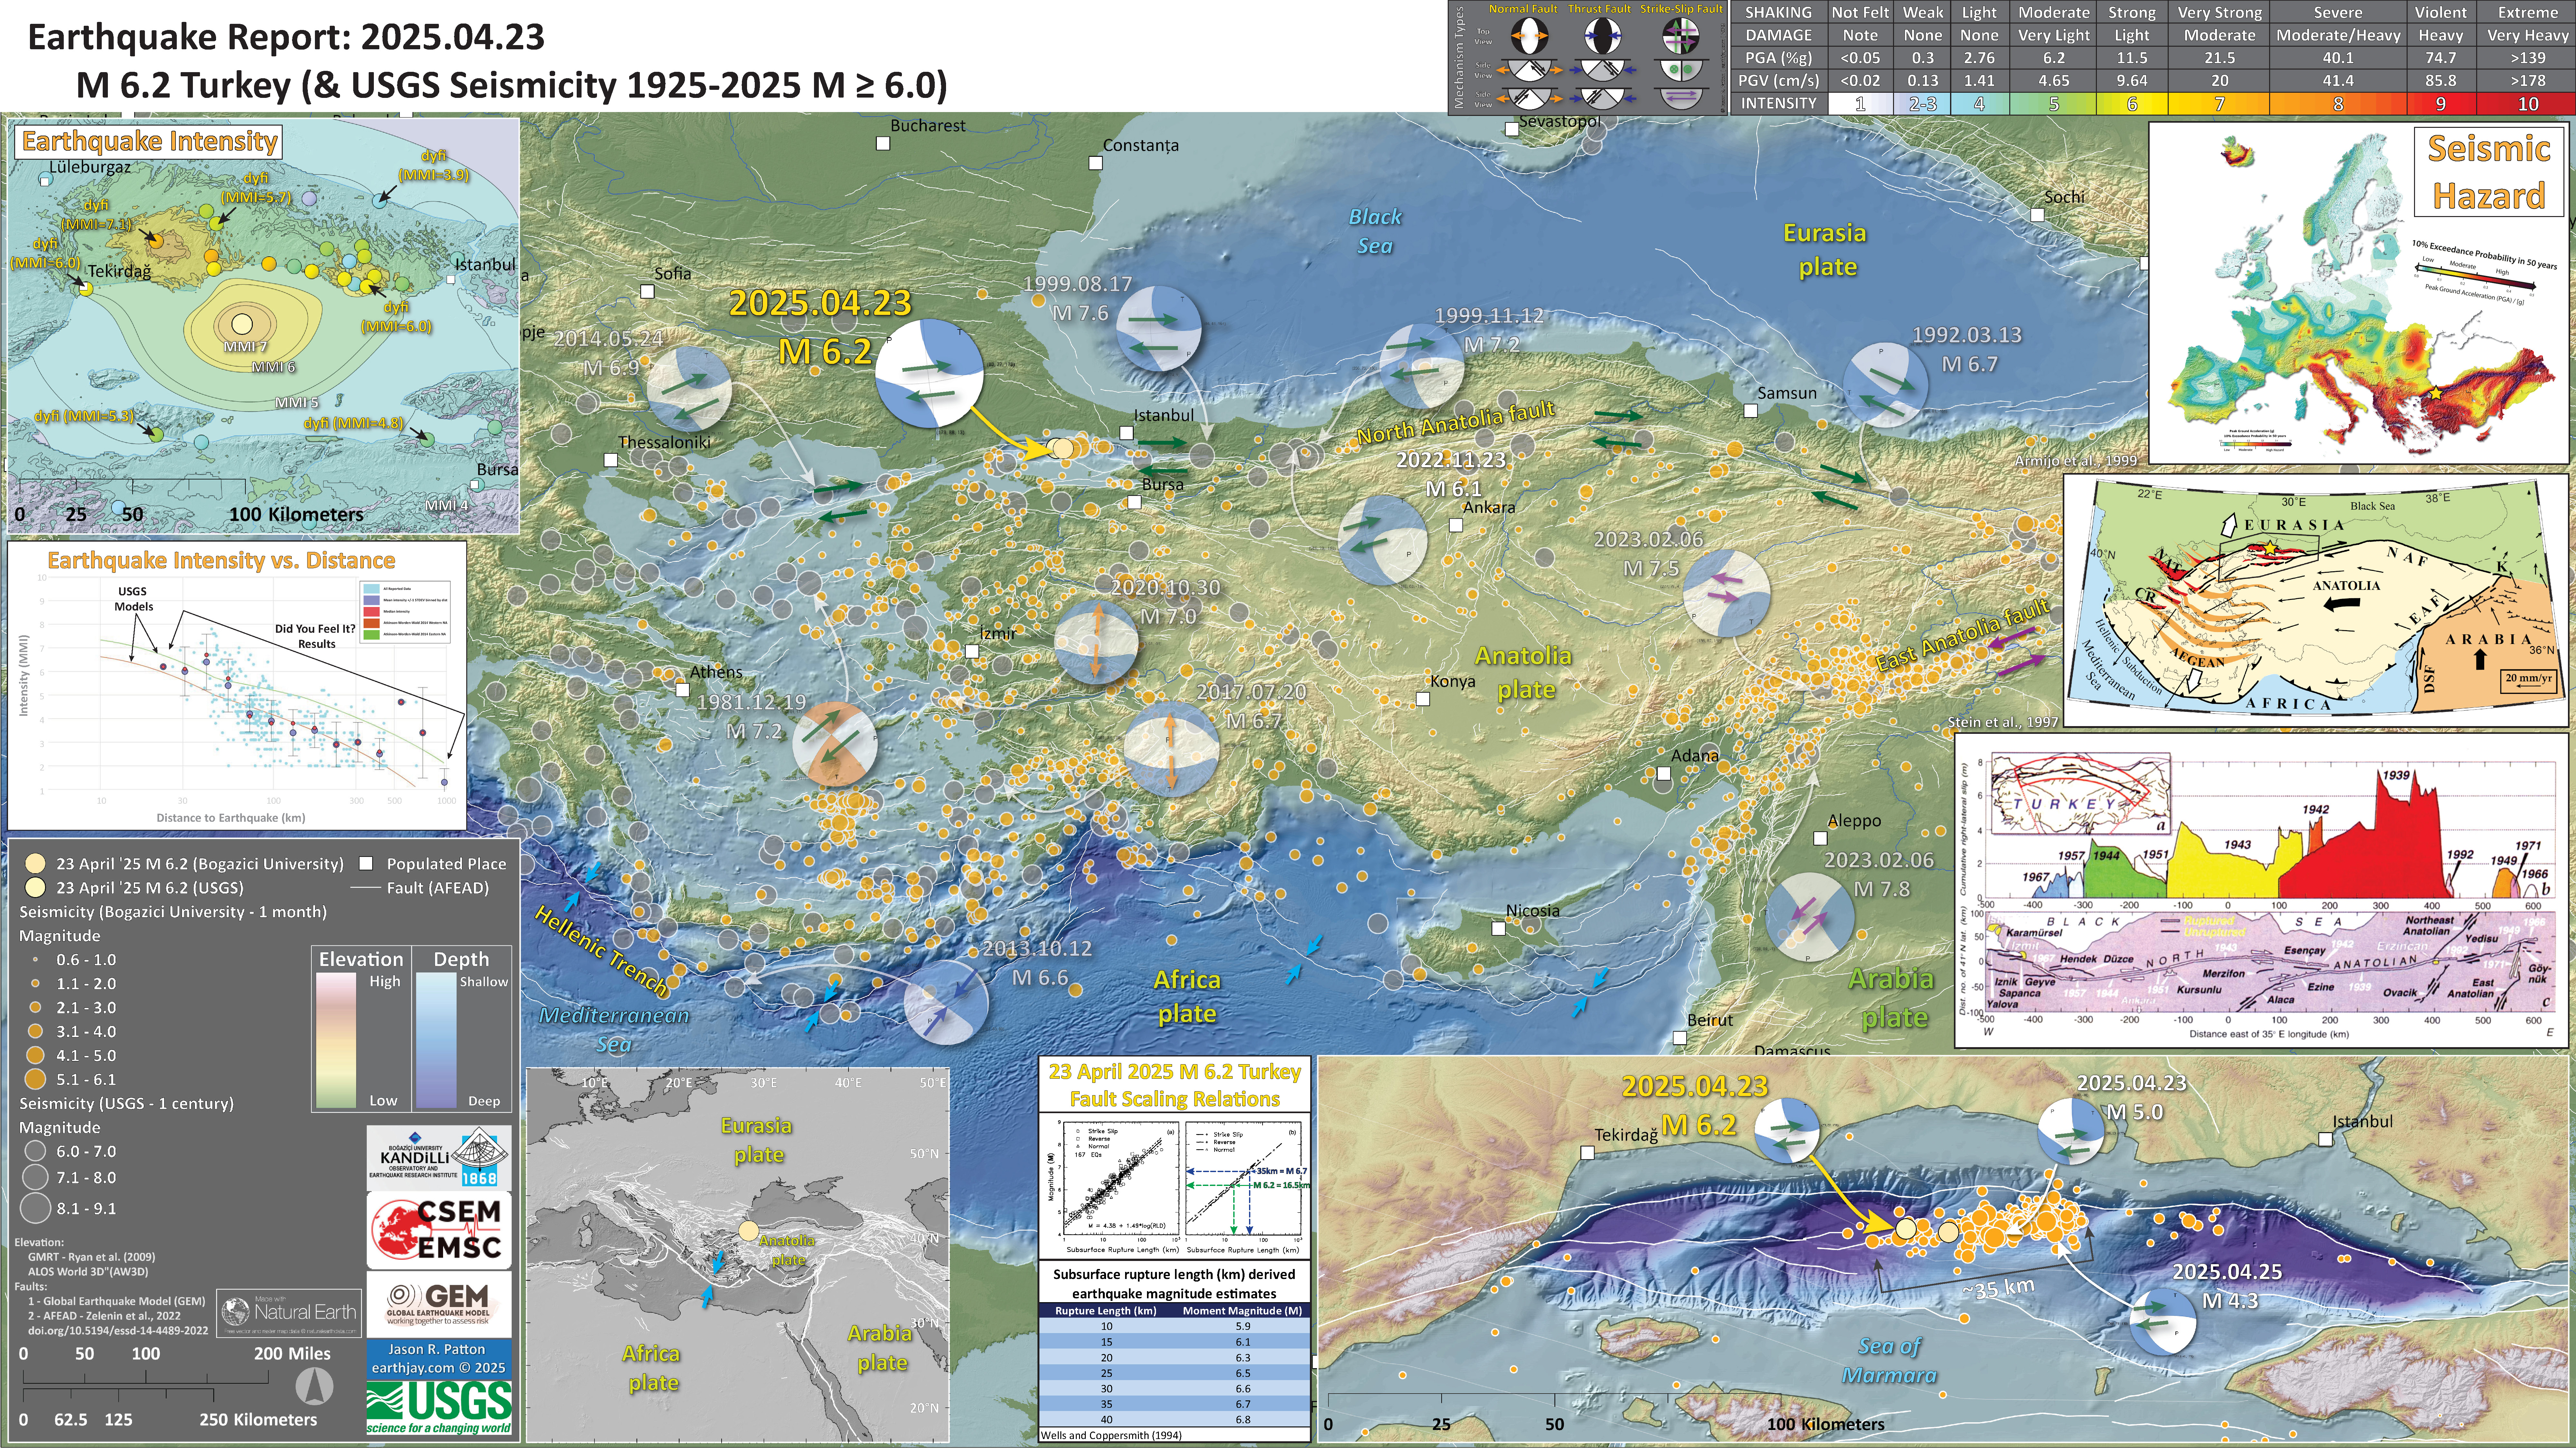
Here I present a poster for the M 6.2 earthquake in the Marmara Sea, northwest of Turkey.
https://earthquake.usgs.gov/earthquakes/eventpage/us7000pufs/executive
This earthquake slipped along the North Anatolia fault (NAF), a right-lateral strike-slip fault that trends along the northern part of Turkey.
Most of the NAF has ruptured in the past century and people think that the segment to the west is the next segment that will rupture. This may generate a tsunami in the Marmara Sea and cause lots of damage in Istanbul, Turkey.
I don’t always have the time to write a proper Earthquake Report. However, I prepare interpretive posters for these events.
Because of this, I present Earthquake Report Lite. (but it is more than just water, like the adult beverage that claims otherwise). I will try to describe the figures included in the poster, but sometimes I will simply post the poster here.
Below is my interpretive poster for this earthquake
- I plot the seismicity from the past month, with diameter representing magnitude (see legend). I include earthquake epicenters from 1923-2023 with magnitudes M ≥ 3.0 in one version.
- I plot the USGS fault plane solutions (moment tensors in blue and focal mechanisms in orange), possibly in addition to some relevant historic earthquakes.
- A review of the basic base map variations and data that I use for the interpretive posters can be found on the Earthquake Reports page. I have improved these posters over time and some of this background information applies to the older posters.
- Some basic fundamentals of earthquake geology and plate tectonics can be found on the Earthquake Plate Tectonic Fundamentals page.
- In the lower left is a map showing the plate tectonic boundaries (from the GEM).
- In the upper right corner is a map that shows the seismic hazard for Europe (the color scale shows the 10% chance that ground shaking will exceed a certain level in the next 50-years).
- Below the seismic hazard map is a map from Armijo et al. (1999) that shows the plate tectonic boundaries of the region.
- Below the tectonic map is a figure from Stein et al. (1997) that shows the parts of the NAF that have ruptured in the past century.
- In the upper left corner is a map that shows the M 6.2 earthquake intensity using the modified Mercalli intensity scale. Earthquake intensity is a measure of how strongly the Earth shakes during an earthquake, so gets smaller the further away one is from the earthquake epicenter. The map colors represent a model of what the intensity may be. The USGS has a system called “Did You Feel It?” (DYFI) where people enter their observations from the earthquake and the USGS calculates what the intensity was for that person. The dots with yellow labels show what people actually felt in those different locations.
- Below the intensity map is a plot that shows the same intensity (both modeled and reported) data as displayed on the map. Note how the intensity gets smaller with distance from the earthquake.
- In the lower right corner is a larger scale map showing the aftershocks from this earthquake sequence. The aftershocks span about 35 km.
- In the center is a figure showing the fault scaling relations from Wells and Coppersmith (1994). These relations are based on empirical earthquake data that show the relation between subsurface rupture length and earthquake magnitude. A subsurface rupture of 35 km should generate a M M 6.7. Likewise, a M 6.2 earthquake should generate 16.5 km of subsurface fault slip.
I include some inset figures.
- Here is the map with a month’s seismicity plotted.
- 2025.04.23 M 6.2 Turkey POSTER
- 2022.02.06 M 7.8 Turkey/Syria
- 2022.11.23 M 6.1 Turkey
- 2020.12.30 M 6.4 Croatia
- 2020.10.30 M 7.0 Turkey
- 2020.05.02 M 6.6 Crete, Greece
- 2020.01.24 M 6.7 Turkey
- 2019.11.26 M 6.4 Albania
- 2018.10.25 M 6.8 Greece
- 2017.07.20 M 6.7 Turkey
- 2017.06.12 M 6.3 Turkey/Greece
- 2016.10.30 M 6.6 Italy
- 2016.10.30 M 6.6 Italy Update #1
- 2016.10.28 M 5.8 Tyrrhenian Sea
- 2016.10.26 M 6.1 Italy
- 2016.10.16 M 5.3 Greece/Albania
- 2016.08.23 M 6.2 Italy
- 2016.01.24 M 6.1 Mediterranean
- 2015.11.17 M 6.5 Greece
- 2015.04.16 M 6.0 Crete
Europe
General Overview
Earthquake Reports
- Frisch, W., Meschede, M., Blakey, R., 2011. Plate Tectonics, Springer-Verlag, London, 213 pp.
- Hayes, G., 2018, Slab2 – A Comprehensive Subduction Zone Geometry Model: U.S. Geological Survey data release, https://doi.org/10.5066/F7PV6JNV.
- Holt, W. E., C. Kreemer, A. J. Haines, L. Estey, C. Meertens, G. Blewitt, and D. Lavallee (2005), Project helps constrain continental dynamics and seismic hazards, Eos Trans. AGU, 86(41), 383–387, , https://doi.org/10.1029/2005EO410002. /li>
- Jessee, M.A.N., Hamburger, M. W., Allstadt, K., Wald, D. J., Robeson, S. M., Tanyas, H., et al. (2018). A global empirical model for near-real-time assessment of seismically induced landslides. Journal of Geophysical Research: Earth Surface, 123, 1835–1859. https://doi.org/10.1029/2017JF004494
- Kreemer, C., J. Haines, W. Holt, G. Blewitt, and D. Lavallee (2000), On the determination of a global strain rate model, Geophys. J. Int., 52(10), 765–770.
- Kreemer, C., W. E. Holt, and A. J. Haines (2003), An integrated global model of present-day plate motions and plate boundary deformation, Geophys. J. Int., 154(1), 8–34, , https://doi.org/10.1046/j.1365-246X.2003.01917.x.
- Kreemer, C., G. Blewitt, E.C. Klein, 2014. A geodetic plate motion and Global Strain Rate Model in Geochemistry, Geophysics, Geosystems, v. 15, p. 3849-3889, https://doi.org/10.1002/2014GC005407.
- Meyer, B., Saltus, R., Chulliat, a., 2017. EMAG2: Earth Magnetic Anomaly Grid (2-arc-minute resolution) Version 3. National Centers for Environmental Information, NOAA. Model. https://doi.org/10.7289/V5H70CVX
- Müller, R.D., Sdrolias, M., Gaina, C. and Roest, W.R., 2008, Age spreading rates and spreading asymmetry of the world’s ocean crust in Geochemistry, Geophysics, Geosystems, 9, Q04006, https://doi.org/10.1029/2007GC001743
- Pagani,M. , J. Garcia-Pelaez, R. Gee, K. Johnson, V. Poggi, R. Styron, G. Weatherill, M. Simionato, D. Viganò, L. Danciu, D. Monelli (2018). Global Earthquake Model (GEM) Seismic Hazard Map (version 2018.1 – December 2018), DOI: 10.13117/GEM-GLOBAL-SEISMIC-HAZARD-MAP-2018.1
- Silva, V ., D Amo-Oduro, A Calderon, J Dabbeek, V Despotaki, L Martins, A Rao, M Simionato, D Viganò, C Yepes, A Acevedo, N Horspool, H Crowley, K Jaiswal, M Journeay, M Pittore, 2018. Global Earthquake Model (GEM) Seismic Risk Map (version 2018.1). https://doi.org/10.13117/GEM-GLOBAL-SEISMIC-RISK-MAP-2018.1
- Zhu, J., Baise, L. G., Thompson, E. M., 2017, An Updated Geospatial Liquefaction Model for Global Application, Bulletin of the Seismological Society of America, 107, p 1365-1385, https://doi.org/0.1785/0120160198
References:
Basic & General References
Specific References
Return to the Earthquake Reports page.
- Sorted by Magnitude
- Sorted by Year
- Sorted by Day of the Year
- Sorted By Region