Good Morning Humboldt County!
This earthquake awakened me early today after just a couple hours sleep. Very exciting and another wake up call to make sure I am prepared for a Cascadia subduction zone earthquake. The Cascadia subduction zone is formed where the Gorda and Juan de Fuca plates subduct northeastward beneath the North America plate.
This is most likely an earthquake in the underlying Gorda plate. The Gorda is losing the battle between the JdF plate to the north and the Pacific plate to the south, both of which are colder, older, and more dense (basically, they form a vise that is squeezing Gorda so much that it deforms internally). This internal deformation results in the formation of left lateral strike slip faults that form on preexisting faults (originally formed at the Gorda rise, where the Gorda plate crust is created). We recently had an earthquake (just ~2 months ago) that also was in the Gorda plate. There are some good maps that show the different tectonic models used to explain this internal deformation.
The moment tensor suggests a slightly compressional earthquake (probably on a northeast striking fault). The focal mechanism supports this in that it shows oblique slip (combination of strike slip and compression). These are interesting in that they are rotated slightly clockwise compared to other earthquakes in this region. This may be due to the deep hypocenter, where the Gorda would be compressing due to the bending (where it would be extensional in the shallow part of the plate, extending due to the bending).
Here is the USGS page for this earthquake.
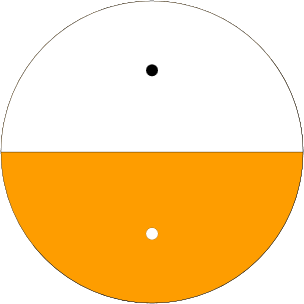
Here is the updated moment tensor:
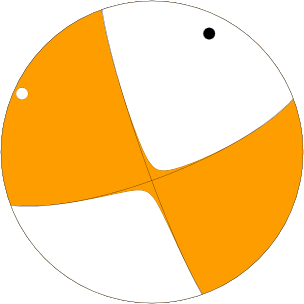
Here is one focal mechanism:
Here is another focal mechanism: 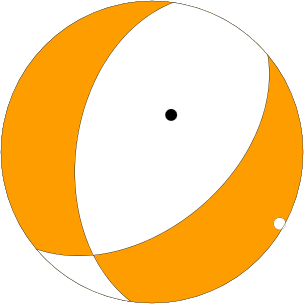
Here is the USGS page that describes what a moment tensor is.
Here is a USGS web page that discusses what a focal mechanism is and what it can tell us about the earthquake it was constructed from.
Here is their graphic that illustrates how to interpret focal mechanisms.
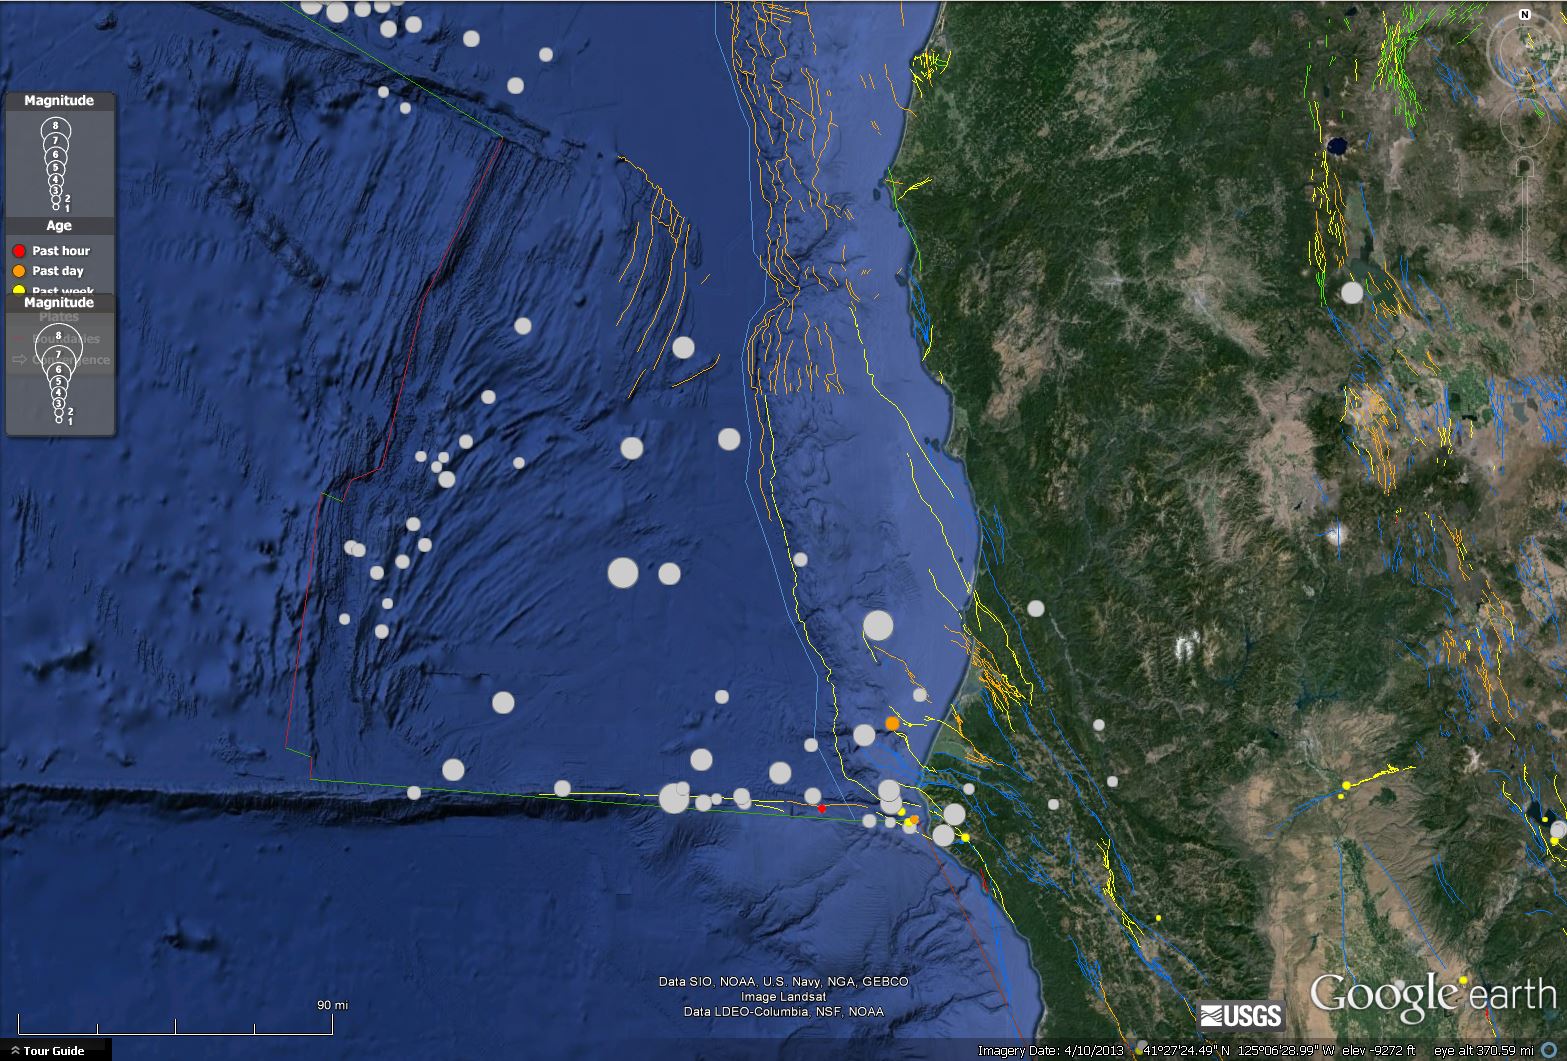
This is a map of the region with historic earthquakes plotted as gray circles. The epicenter of today’s earthquake is orange:
This is a map showing the “did you feel it” plotted on top. Today’s epicenter is the red star in the center of the map. 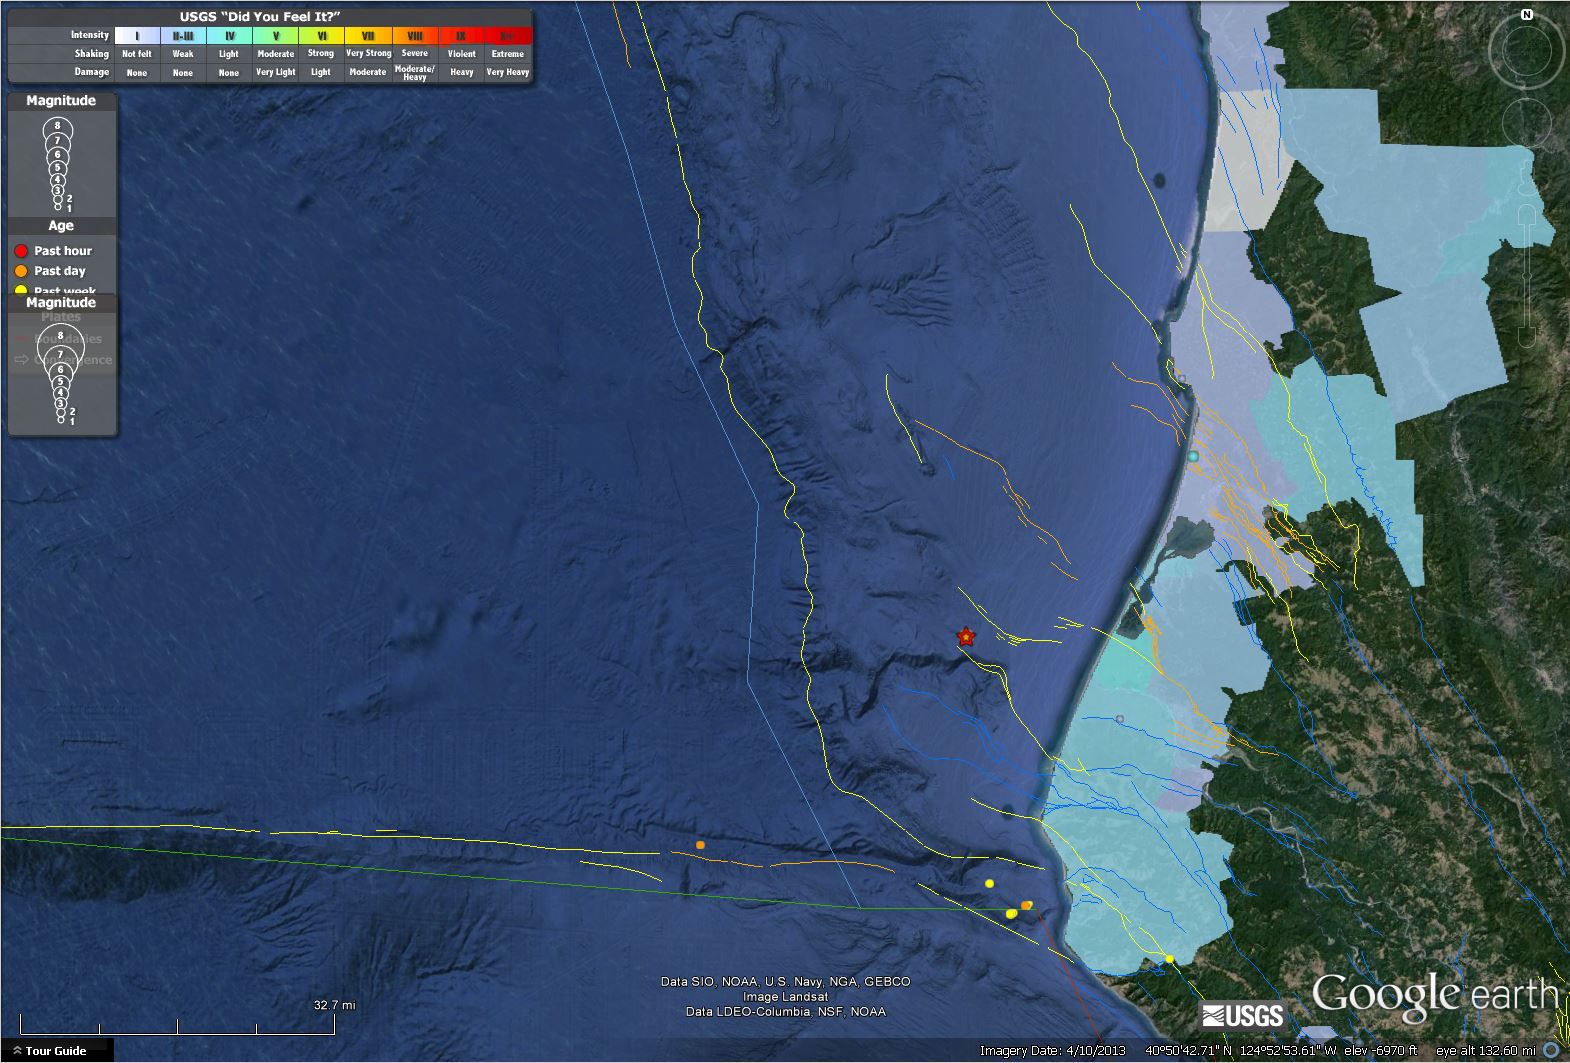
Here is a map with PGA (peak ground acceleration, in units of %g, where g = gravity, or 9.8 m/s^2): 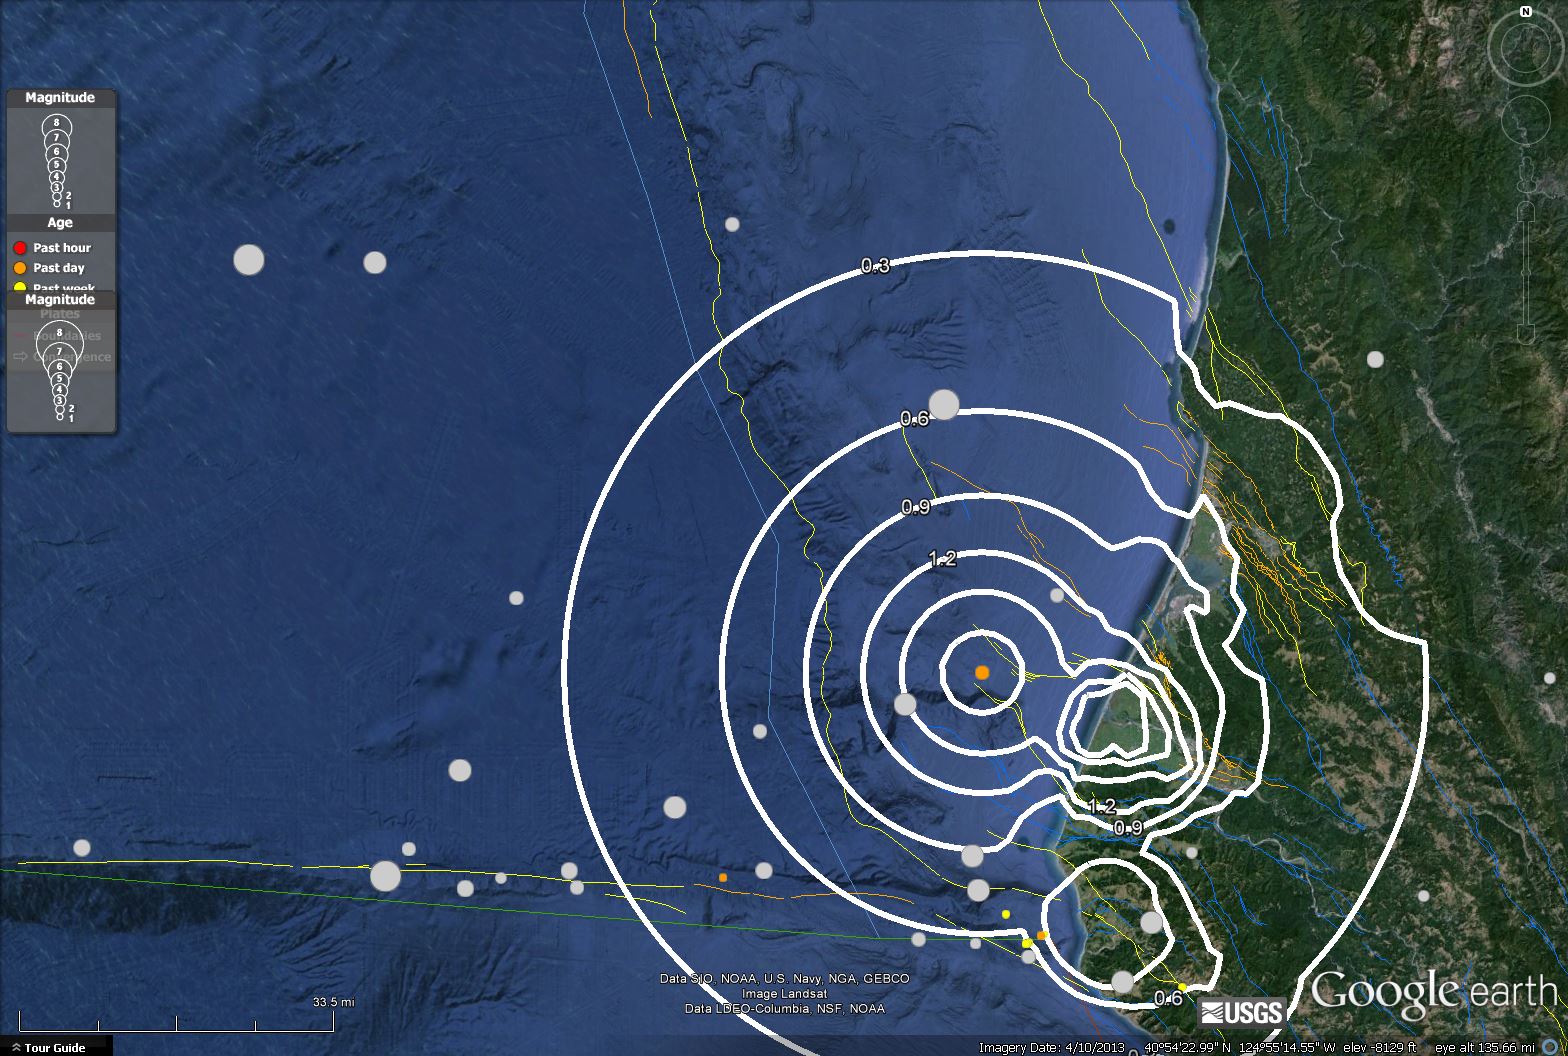
Here is the record from the HSU benioff seismometer, taken by Vanessa Crandell and posted by the HSU Dept. of Geology: 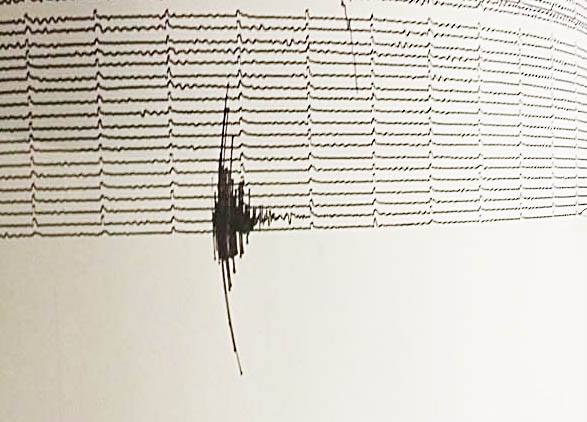
Here is the record from Jamie Schutmutt’s garage seismometer: 
Here is the seismogram from Berkeley’s Jacoby Creek Seismometer (as plotted by Lori Dengler from HSU Dept. of Geology): 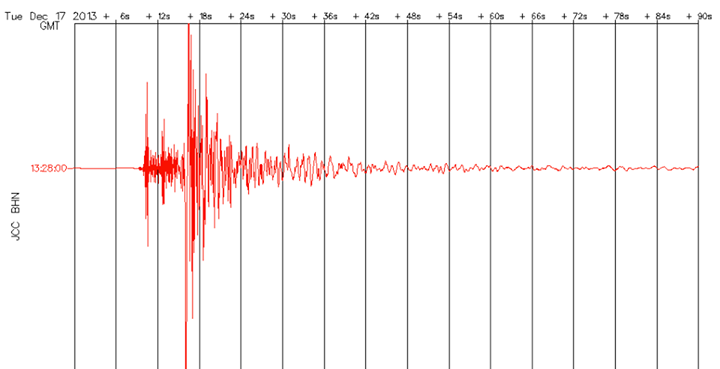
1 thought on “M 4.1 Gorda plate 2013/12/17”