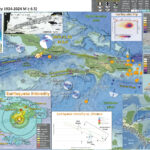
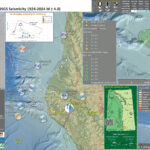
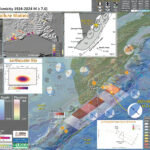
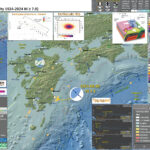
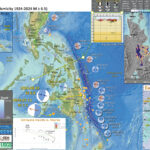
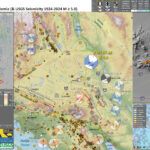
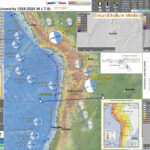
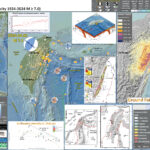
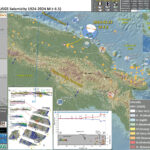
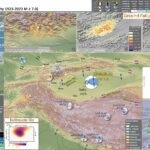
I don’t always have the time to write a proper Earthquake Report. However, I prepare interpretive posters for these events.
Because of this, I present Earthquake Report Lite. (but it is more than just water, like the adult beverage that claims otherwise). I will try to describe the figures included in the poster, but sometimes I will simply post the poster here.
https://earthquake.usgs.gov/earthquakes/eventpage/us7000ilwt/executive
This is possibly one of the most mysterious earthquakes of the year. I forgot to write this up at the time so need to fill in more details after I am done working up my annual summary.
Below is my interpretive poster for this earthquake
- I plot the seismicity from the past month, with diameter representing magnitude (see legend). I include earthquake epicenters from 1921-2021 with magnitudes M ≥ 3.0 in one version.
- I plot the USGS fault plane solutions (moment tensors in blue and focal mechanisms in orange), possibly in addition to some relevant historic earthquakes.
- A review of the basic base map variations and data that I use for the interpretive posters can be found on the Earthquake Reports page. I have improved these posters over time and some of this background information applies to the older posters.
- Some basic fundamentals of earthquake geology and plate tectonics can be found on the Earthquake Plate Tectonic Fundamentals page.
- In the upper left corner I include a large scale view of the magnetic anomaly data. These anomalies are formed at mid-ocean ridges, so are parallel to the ridges. When transform faults offset these anomalies, the anomalies get offset.
- In the lower right corner is a map showing the USGS modeled intensity that uses the Modified Mercalli Intensity (MMI) data.
- In the upper left center and the lower right center I include maps from two papers that show the magnetic anomaly data for the Pacific Ocean.
I include some inset figures.
- 2022.11.02 M 6.0 Pacific Ocean POSTER
- 2018.05.04 M 6.9 Hawai’i
Pacific Ocean | Hawai’i’ Earthquake Reports
- Frisch, W., Meschede, M., Blakey, R., 2011. Plate Tectonics, Springer-Verlag, London, 213 pp.
- Hayes, G., 2018, Slab2 – A Comprehensive Subduction Zone Geometry Model: U.S. Geological Survey data release, https://doi.org/10.5066/F7PV6JNV.
- Holt, W. E., C. Kreemer, A. J. Haines, L. Estey, C. Meertens, G. Blewitt, and D. Lavallee (2005), Project helps constrain continental dynamics and seismic hazards, Eos Trans. AGU, 86(41), 383–387, , https://doi.org/10.1029/2005EO410002. /li>
- Jessee, M.A.N., Hamburger, M. W., Allstadt, K., Wald, D. J., Robeson, S. M., Tanyas, H., et al. (2018). A global empirical model for near-real-time assessment of seismically induced landslides. Journal of Geophysical Research: Earth Surface, 123, 1835–1859. https://doi.org/10.1029/2017JF004494
- Kreemer, C., J. Haines, W. Holt, G. Blewitt, and D. Lavallee (2000), On the determination of a global strain rate model, Geophys. J. Int., 52(10), 765–770.
- Kreemer, C., W. E. Holt, and A. J. Haines (2003), An integrated global model of present-day plate motions and plate boundary deformation, Geophys. J. Int., 154(1), 8–34, , https://doi.org/10.1046/j.1365-246X.2003.01917.x.
- Kreemer, C., G. Blewitt, E.C. Klein, 2014. A geodetic plate motion and Global Strain Rate Model in Geochemistry, Geophysics, Geosystems, v. 15, p. 3849-3889, https://doi.org/10.1002/2014GC005407.
- Meyer, B., Saltus, R., Chulliat, a., 2017. EMAG2: Earth Magnetic Anomaly Grid (2-arc-minute resolution) Version 3. National Centers for Environmental Information, NOAA. Model. https://doi.org/10.7289/V5H70CVX
- Müller, R.D., Sdrolias, M., Gaina, C. and Roest, W.R., 2008, Age spreading rates and spreading asymmetry of the world’s ocean crust in Geochemistry, Geophysics, Geosystems, 9, Q04006, https://doi.org/10.1029/2007GC001743
- Pagani,M. , J. Garcia-Pelaez, R. Gee, K. Johnson, V. Poggi, R. Styron, G. Weatherill, M. Simionato, D. Viganò, L. Danciu, D. Monelli (2018). Global Earthquake Model (GEM) Seismic Hazard Map (version 2018.1 – December 2018), DOI: 10.13117/GEM-GLOBAL-SEISMIC-HAZARD-MAP-2018.1
- Silva, V ., D Amo-Oduro, A Calderon, J Dabbeek, V Despotaki, L Martins, A Rao, M Simionato, D Viganò, C Yepes, A Acevedo, N Horspool, H Crowley, K Jaiswal, M Journeay, M Pittore, 2018. Global Earthquake Model (GEM) Seismic Risk Map (version 2018.1). https://doi.org/10.13117/GEM-GLOBAL-SEISMIC-RISK-MAP-2018.1
- Zhu, J., Baise, L. G., Thompson, E. M., 2017, An Updated Geospatial Liquefaction Model for Global Application, Bulletin of the Seismological Society of America, 107, p 1365-1385, https://doi.org/0.1785/0120160198
References:
Basic & General References
Specific References
Return to the Earthquake Reports page.
- Sorted by Magnitude
- Sorted by Year
- Sorted by Day of the Year
- Sorted By Region
I don’t always have the time to write a proper Earthquake Report. However, I prepare interpretive posters for these events. There was a magnitude M 6.9 earthquake in Taiwan on 18 September 2022. https://earthquake.usgs.gov/earthquakes/eventpage/us7000i90q/executive Taiwan is an interesting place, from a tectonic perspective. There is an intersection of several plate boundary fault systems here. Along the western boundary of Taiwan the Eurasia plate subducts (dives beneath) the Philippine Sea plate forming the Manila trench. This megathrust subduction zone fault system terminates somewhere in central-northern Taiwan. Intersecting central Taiwan from the east is another subduction zone where the Philippine Sea plate subducts beneath the Eurasia plate, forming the Ryukyu trench. There was an earthquake in Taiwan in 1999 that has been commemorated by creating a park and museum that preserves some of the evidence of the earthquake. This Chi-Chi earthquake cause lots of damage and, sadly, lots of suffering. In addition, because of the dominance of the computer chip manufacturing industry in Taiwan at the time, the price of computer chips was greatly inflated. The global economy suffered following this earthquake. This 18 September 2022 M 6.9 earthquake occurred on a crustal fault that strikes (trends) parallel to the coast. Because of the mapped faults, I interpret this to have been a left-lateral strike slip earthquake. There was a foreshock, a mag M 6.5 earthquake, nearby, the day before.
Geologic map of the Coastal Range on shaded relief (after Wang and Chen, 1993). The Longitudinal Valley Fault (LVF) can be subdivided into the Linding and Juisui locked Fault and the Chihshang and Lichi creeping Fault. Vertical cross-sections of VS perturbation tomography along the AeA0 and BeB0 profiles denote the Central Range, the Coastal Range, and the LVF. EU: Eurasian Plate; PH: Philippine Sea Plate.
A neotectonic snapshot of Taiwan and adjacent regions. (a) Taiwan is currently experiencing a double suturing. In the south the Luzon volcanic arc is colliding with the Hengchun forearc ridge, which is, in turn, colliding with the Eurasian continental margin. In the north both sutures are unstitching. Their disengagement is forming both the Okinawa Trough and the forearc basins of the Ryukyu arc. Thus, in the course of passing through the island, the roles of the volcanic arc and forearc ridge flip along with the flipping of the polarity of subduction. The three gray strips represent the three lithospheric pieces of Taiwan’s tandem suturing and disarticulation: the Eurasian continental margin, the continental sliver, and the Luzon arc. Black arrows indicate the suturing and disarticulation. This concept is discussed in detail by Shyu et al. [2005]. Current velocity vector of the Philippine Sea plate relative to the Eurasian plate is adapted from Yu et al. [1997, 1999]. Current velocity vector of the Ryukyu arc is adapted from Lallemand and Liu [1998]. Black dashed lines are the northern and western limits of the Wadati-Benioff zone of the two subducting systems, taken from the seismicity database of the Central Weather Bureau, Taiwan. DF, deformation front; LCS, Lishan-Chaochou suture; LVS, Longitudinal Valley suture; WF, Western Foothills; CeR, Central Range; CoR, Coastal Range; HP, Hengchun Peninsula. (b) Major tectonic elements around Taiwan. Active structures identified in this study are shown in red. Major inactive faults that form the boundaries of tectonic elements are shown in black: 1, Chiuchih fault; 2, Lishan fault; 3, Laonung fault; 4, Chukou fault. Selected GPS vectors relative to the stable Eurasian continental shelf are adapted from Yu et al. [1997]. A,Western Foothills; B, Hsueshan Range; C, Central Range and Hengchun Peninsula; D, Coastal Range; E, westernmost Ryukyu arc; F, Yaeyama forearc ridge; G, northernmost Luzon arc; H, western Taiwan coastal plains; I, Lanyang Plain; J, Pingtung Plain; K, Longitudinal Valley; L, submarine Hengchun Ridge; M, Ryukyu forearc basins.
Map of major active faults and folds of Taiwan (in red) showing that the two sutures are producing separate western and eastern neotectonic belts. Each collision belt matures and then decays progressively from south to north. This occurs in discrete steps, manifested as seven distinct neotectonic domains along the western belt and four along the eastern. A distinctive assemblage of active structures defines each domain. For example, two principal structures dominate the Taichung Domain. Rupture in 1999 of one of these, the Chelungpu fault, caused the disastrous Chi-Chi earthquake. The Lishan fault (dashed black line) is the suture between forearc ridge and continental margin. Thick light green and pink lines are boundaries of domains.
Proposed major sources for future large earthquakes in and around Taiwan. Thick red lines are proposed future ruptures, and the white patches are rupture planes projected to the surface. Here we have selected only a few representative scenarios from Table 1. Earthquake magnitude of each scenario is predicted value from our calculation.
#EarthquakeReport for M 6.9 #Earthquake in Taiwan on 18 September 2022 there was lots of damage and some casualties :-( landslides and liquefaction models show that there was a high likelihood for these.https://t.co/3tzXgvQl26 damage informationhttps://t.co/I95RUCSWkh pic.twitter.com/TPKL95vqHI — Jason "Jay" R. Patton (@patton_cascadia) November 9, 2022
I was travelling to southern California to attend the annual meeting for the Southern California Earthquake Center. This was the first in person meeting since 2019, my first SCEC meeting. I had landed and was waiting for the luggage to arrive when I saw the CSEM earthquake app notification that there was a large earthquake in Papua New Guinea (PNG). I put together a quick tweet before anything was posted on the USGS earthquake page other than the location and depth. When I got to my hotel room later, more information was up. However, due to some problems with Dreamhost (my website hosting company), I am migrating to a different company. For a little while, parts of this website (like the links and the images) will be non-functional. I will not be using Dreamhost again. I don’t have any more to say about this since they have not returned any of my emails in over a week, basically abandoning my website in the middle of the night without any warning. https://earthquake.usgs.gov/earthquakes/eventpage/us6000iitd/executive The depth increased to about 90 km and has a normal-oblique sense of motion. This means that the earthquake was the result of a combination of extension (stretching) and strike-slip. This area is a complicated region from a tectonic perspective. There are old faults and old plate boundaries that may no longer be active and there are known active faults that juxtapose these older structures. For example, there is a convergent (moving together) plate boundary fault system on the north side of Papua New Guinea. This ‘subduction zone’ formed a deep sea trench called the New Guinea trench, where the Caroline plate subducted south beneath Papua New Guinea. This plate boundary fault system is thought to be inactive on the west side of the island and active, but with a slow convergence rate, on the eastern side of the island. Then, to the southeast of PNG, there is a deep sea trench formed by the subduction of the Australia plate diving to the north beneath the island. This fault is inactive offshore and turns into the Papua fold and thrust belt (PFTB) onshore. The PFTB onshore is inactive in the western part of the island and has a slow convergence rate on the eastern side of the island. On 25 February 2018 there was a M 7.5 earthquake associated with the PFTB. Here is the earthquake report for that earthquake. Between these two subduction zones, that dip in opposite directions, are several large strike-slip fault systems, which also have varying levels of activity. “Yesterday’s” M 7.6 occurred in one of the plates that is/was being subducted. It was probably in the Australia plate that dives beneath PNG (which is responsible for the PFTB). I updated this page a bit on 13 March 2023 and make some corrections. I note these changes below.
Topography, bathymetry and regional tectonic setting of New Guinea and Solomon Islands. Arrows indicate rate and direction of plate motion of the Australian and Pacific plates (MORVEL, DeMets et al., 2010); Mamberamo thrust belt, Indonesia (MTB); North Fiji Basin (NFB)
Tectonic map of New Guinea, adapted from Hamilton (1979), Cooper and Taylor (1987), Dow et al. (1988), and Sapiie et al. (1999). AFTB—Aure fold and thrust belt, FTB—fold-and-thrust belt, IOB—Irian Ophiolite Belt, TFB—thrust-and-fold belt, POB—Papuan Ophiolite Belt, BTFZ—Bewani-Torricelli fault zone, MDZ—Mamberamo deformation zone, YFZ—Yapen fault zone, SFZ—Sorong fault zone, WO—Weyland overthrust. Continental basement exposures are concentrated along the southern fl ank of the Central Range: BD—Baupo Dome, MA—Mapenduma anticline, DM—Digul monocline, IDI—Idenberg Inlier, MUA—Mueller anticline, KA—Kubor anticline, LFTB—Legguru fold-and-thrust belt, RMFZ—Ramu-Markham fault zone, TAFZ—Tarera-Aiduna fault zone. The Tasman line separates continental crust that is Paleozoic and younger to the east from Precambrian to the west.
Lithospheric-scale cross section at 2 Ma. Plate motion is now focused along the Yapen fault zone in the center of the recently extinct arc. This probably occurred because this zone of weakness had a trend that could accommodate the imposed movements as the corner of the Caroline microplate ruptured, forming the Bismarck plate, and the corner of the Australian plate ruptured, forming the Solomon microplate. The collisional delamination-generated magmatic event ends in the highlands as the lower crustal magma chamber solidifies. Upwelled asthenosphere cools and transforms into lithospheric mantle. This drives a slow regional subsidence of the highlands that will continue for tens of millions of years or until other plate-tectonic movements are initiated. Deep erosion is still concentrated on the fl anks of the mountain belt. RMB—Ruffaer Metamorphic Belt, AUS—Australian plate, PAC—Pacific plate.
Seismotectonic interpretation of New Guinea. Tectonic features: PTFB—Papuan thrust-and-fold belt; RMFZ—Ramu-Markham fault zone; BTFZ—Bewani-Torricelli fault zone; MTFB—Mamberamo thrust-and-fold belt; SFZ—Sorong fault zone; YFZ—Yapen fault zone; RFZ—Ransiki fault zone; TAFZ—Tarera-Aiduna fault zone; WT—Waipona Trough. After Sapiie et al. (1999).
Topography, bathymetry and major tectonic elements of the study area. (a) Major tectonic boundaries of Papua New Guinea and the western Solomon Islands; CP, Caroline plate; MB, Manus Basin; NBP, North Bismarck plate; NBT, New Britain trench; NGT, New Guinea trench; NST, North Solomon trench; PFTB, Papuan Fold and Thrust Belt; PT, Pocklington trough; RMF, Ramu-Markham Fault; SBP, South Bismarck plate; SCT, San Cristobal trench; SS, Solomon Sea plate; TT, Trobriand trough; WB,Woodlark Basin; WMT,West Melanesian trench. Study area is indicated by rectangle labelled Figure 1b; the other inset rectangle highlights location for subsequent figures. Present day GPS motions of plates are indicated relative to the Australian plate (from Tregoning et al. 1998, 1999; Tregoning 2002; Wallace et al. 2004). (b) Detailed topography, bathymetry and structural elements significant to the South Bismarck region (terms not in common use are referenced); AFB, Aure Fold Belt (Davies 2012); AT, Adelbert Terrane (e.g. Wallace et al. 2004); BFZ, Bundi Fault Zone (Abbott 1995); BSSL, Bismarck Sea Seismic Lineation; CG, Cape Gloucester; FT, Finisterre Terrane; GF, Gogol Fault (Abbott 1995); GP, Gazelle Peninsula; HP, Huon Peninsula; MB, Manus Basin; NB, New Britain; NI, New Ireland; OSF, Owen Stanley Fault; RMF, Ramu-Markham Fault; SS, Solomon Sea; WMR, Willaumez-Manus Rise (Johnson et al. 1979); WT, Wonga Thrust (Abbott et al. 1994); minor strike-slip faults are shown adjacent to Huon Peninsula (Abers & McCaffrey 1994) and in east New Britain, the Gazelle Peninsula (e.g. Madsen & Lindley 1994). Circles indicate centres of Quaternary volcanism of the Bismarck arc. Filled triangles indicate active thrusting or subduction, empty triangles indicate extinct or negligible thrusting or subduction.
3-D model of the Solomon slab comprising the subducted Solomon Sea plate, and associated crust of the Woodlark Basin and Australian plate subducted at the New Britain and San Cristobal trenches. Depth is in kilometres; the top surface of the slab is contoured at 20 km intervals from the Earth’s surface (black) to termination of slabrelated seismicity at approximately 550 km depth (light brown). Red line indicates the locations of the Ramu-Markham Fault (RMF)–New Britain trench (NBT)–San Cristobal trench (SCT); other major structures are removed for clarity; NB, New Britain; NI, New Ireland; SI, Solomon Islands; SS, Solomon Sea; TLTF, Tabar–Lihir–Tanga–Feni arc. See text for details.
Forward tectonic reconstruction of progressive arc collision and accretion of New Britain to the Papua New Guinea margin. (a) Schematic forward reconstruction of New Britain relative to Papua New Guinea assuming continued northward motion of the Australian plate and clockwise rotation of the South Bismarck plate. (b) Cross-sections illustrate a conceptual interpretation of collision between New Britain and Papua New Guinea.
UPDATE: 2023.03.13
Panel A: Distribution of mapped magmatic rock units (from Australian Bureau of Mineral Resources (1972)) and major tectonic boundaries of central Papua New Guinea. Published K/Ar (white boxes) and U–Pb ages (grey boxes) for Late Cenozoic magmatic rocks are from Page and McDougall (1972), Grant and Nielsen (1975), Page (1976), Whalen et al. (1982), Rogerson and Williamson (1985), Richards and McDougall (1990), and van Dongen et al. (2010). Panel B: Major tectonic elements of Papua New Guinea; Adelbert Terrane (AT); Aure trough (AuT); Bundi fault zone (BFZ); Bismarck Sea seismic lineation (BSSL); Fly Platform (FP); Finisterre Terrane (FT); Lagaip fault zone (LFZ); Manus Basin (MB); New Britain (NB); New Britain trench (NBT); New Guinea trench (NGT); North Sepik arc (NSA); Owen Stanley fault zone (OSFZ); Papuan Fold and Thrust Belt (PFTB); Papuan Peninsula (PP); Pocklington trough (PT); Ramu–Markham fault zone (RMFZ); South Bismarck plate (SBP); Solomon Sea (SS); Trobriand trough (TT);Woodlark Basin (WB). Panel C: Regional geology of the eastern Papuan Highlands (modified from Australian Bureau of Mineral Resources (1989)).
Simplified geodynamic evolution of the Maramuni arc. Time steps represent: a) north-dipping subduction of the Pocklington Sea slab at the Pocklington trough and associated magmatism of the Maramuni arc intruding the New Guinea Mobile Belt (NGMB); b) onset of continental collision and growth of the New Guinea Orogen from ca. 12 Ma as the Australian continent enters the Pocklington trough. Collision between the Australian continent and the New Guinea Mobile Belt leads to cessation of subduction at the Pocklington trough and associated foundering and steepening of the Pocklington Sea slab in the mantle; c) continued orogenesis results from convergence between the Australian continent and New Guinea Mobile Belt, associated with under thrusting of the leading Australian continental margin at the Pocklington trough. Northward motion of the Australian plate relative to the foundering Pocklington Sea slab leads to buckling and overturning of the slab. A reduction in convergence at the Pocklington trough is accommodated by initiation of north-dipping subduction of the Solomon Sea plate beneath the Finisterre Terrane; d) lithospheric delamination of the Pocklington Sea slab some 6 m.y. after continental collision results in renewed orogenesis in the New Guinea Orogen, and HREE-depleted magmatism at Kokofimpa. Subduction of the Solomon Sea plate continues at the New Britain trench but also begins to underthrust the New Guinea Mobile Belt at the Trobriand trough (Holmet al., unpublished data); e) Maramuni arc magmatism migrates southward into the Papuan Fold and Thrust Belt. Subduction of the Solomon Sea plate at the New Britain and Trobriand subduction systems results in closure of the Solomon Sea and collision and overthrusting of the Finisterre Terrane above the New Guinea Mobile Belt. Magmatism of the West Bismarck arc begins northward of the Finisterre Terrane; and f) convergence between the Finisterre Terrane and New Guinea Mobile Belt continues at the Ramu–Markham fault. Underthrusting of the New Guinea Mobile Belt beneath the Finisterre Terrane results in crustal-derived magmatism in theWest Bismarck arc. The foundered Solomon Sea slab is laterally continuous with the present day Solomon Sea plate to the east (see Fig. 1). Present day cross-section is modified from Holm and Richards (2013).
Luckily I updated this page because I noticed that the interpretive figure below was incorrect (it was for a different earthquake). Luckily I updated this page because I noticed that the interpretive figure below was incorrect (it was for a different earthquake). FOS = Resisting Force / Driving Force #EarthquakeReport for M7.6 #Gempa #Earthquake in #PapuaNewGuinea Strong shaking, hi chance for damage, casualties, landslides, and liquefaction Hopefully there is not much suffering https://t.co/qv9dci3yu0 pic.twitter.com/Mc3HjtGgQS — Jason "Jay" R. Patton (@patton_cascadia) September 11, 2022 #EarthquakeReport for M 7.6 #Gempa #Sismo #Earthquake in #PapuaNewGuinea possibly in Australia plate slab analogous events earthjay website is down as i migrate to aws away from dreamhosthttps://t.co/M8yFwXgiI2 pic.twitter.com/EFSqVdTKKM — Jason "Jay" R. Patton (@patton_cascadia) September 11, 2022 — Jason "Jay" R. Patton (@patton_cascadia) September 11, 2022 Hoping Kainantu is OK. Scenes from Madang #earthquake pic.twitter.com/NH5oTsabHI — Chakriya Bowman (@CIPRD) September 11, 2022 🏚FUERTE #SISMO Mw7.7 con epicentro a #Morobe, #PapuaNuevaGuinea 🇵🇬 (ocurrió el 10-septiembre-2022 18:46 hrs EST) fue registrado por mi estación AM.#R69E9 ubicada en #Veraguas, #Panamá 🇵🇦 — Monitoreo Sísmico JP 🇵🇦 (@monitoreojp) September 11, 2022 About ~15 mins ago, a M7.5 near Lae, Papua New Guinea, as recorded by the @AusQuake seismograph network in southeast Australia. Reportedly at a depth of ~100 km. pic.twitter.com/SnY8WbXNeI — Dr. Dee Ninis (@DeeNinis) September 11, 2022 The waves from the M7.6 Papua New Guinea earthquake are rolling under the east coast of the US right now. (The timing makes the trace kind of hard to see.) Images from @IRIS_EPO Station Monitor. https://t.co/UGVApJ6xpu pic.twitter.com/QSMxw4mpmz — Wendy Bohon, PhD 🌏 (@DrWendyRocks) September 11, 2022 Mw=7.7, EASTERN NEW GUINEA REG., P.N.G. (Depth: 39 km), 2022/09/10 23:46:55 UTC – Full details here: https://t.co/b2drScMokg pic.twitter.com/t1empyuII5 — Earthquakes (@geoscope_ipgp) September 11, 2022 The IRIS Earthquake Browser shows the distribution of earthquakes that have occurred near this Magnitude 7.6 earthquake in Papau New Guinea ➡️https://t.co/fhm2uyCHNW pic.twitter.com/d0eVSgZUQq — IRIS Earthquake Sci (@IRIS_EPO) September 11, 2022 A dormitory building at the University of Goroka suffered moderate damage to what appears to be decorative awnings & some wall spalling & parapet collapse. Overall building seems intact, but LOTS of falling debris that could hurt or kill someone below. #PNG #earthquake pic.twitter.com/0tZCN3qA36 — Brian Olson (@mrbrianolson) September 11, 2022 🇵🇬| Papua New Guinea – Registro desde una camara de seguridad del evento sismico Mw7.7 — Seba Sismos CL (@Seba_Sismos_CL) September 11, 2022 — Elior Cohen (@Elior_C_E) September 11, 2022 #Helicopter in an #Earthquake near #Lae PNG this morning. 7.6 Magnitude pic.twitter.com/MYyi9tDetu — David Bennet (@bennetdg5454) September 11, 2022 Watch the waves from the M7.6 earthquake in Papua New Guinea roll across seismic stations in North America. 🎥 https://t.co/yHxbrJ92kh pic.twitter.com/P4mS7M1N4k — IRIS Earthquake Sci (@IRIS_EPO) September 11, 2022 View a visual explainer and more videos like this on our TikTok, Terra Explore https://t.co/tSbAKZfjif pic.twitter.com/B7pJGCRdwZ — IRIS Earthquake Sci (@IRIS_EPO) September 11, 2022 ..
There have not been that many large earthquakes this year. This is good for one main reason, there is a lower potential for human suffering. Therefore, there are fewer Earthquake Reports for this year. This morning (my time) there was a magnitude M 6.9 earthquake along the Romanche transform fault, a right-lateral strike-slip fault system that offsets the Mid Atlantic Ridge in the equatorial Atlantic Ocean. The fault is part of the Romanche fracture zone. https://earthquake.usgs.gov/earthquakes/eventpage/us7000i53f/executive The transform faults in this part of the Mid Atlantic Ridge plate boundary have a pattern of earthquakes that seem to max out in the lower 7 magnitudes. This may be (at least partly) due to the maximum length of these faults (?). The Romanche fault is about 900 kilometers long. The Chain fault is about 250 km long. The St. Paul fault is about 350 km long. Using empirical (data) based relations between earthquake subsurface rupture length and earthquake magnitude (Wells and Coppersmith, 1994), I calculate the maximum earthquake magnitude we may get on these three faults listed above. Here are the data that Wells and Coppersmith use to establish these relations.
(a) Regression of subsurface rupture length on magnitude (M). Regression line shown for all-slip-type relationship. Short dashed line indicates 95% confidence interval. (b) Regression lines for strike-slip relationships. See Table 2 for regression coefficients. Length of regression lines shows the range of data for each relationship.
Here are the magnitude estimates for each of these fault systems. Looking at the interpretive poster, we can see that there have not been any temblors that approach the sizes listed in this table. The largest historic earthquake was M 7.1 (there were several). So, we may ask ourselves one of the most common questions people ask regarding earthquakes. Was this M 6.9 a foreshock to a larger earthquake? Obviously, we cannot yet know this. Nobody can predict the future (at least not yet). However, based on the incredibly short historic record of earthquakes, we may answer this question: “no, probably not.” This answer is tempered by the very short seismic record. If magnitude 8 earthquakes occur, on average, every 1000 years, then our ~100 year record might be too short to “notice” one of these M 8 events. So, given the historic record, it sure seems likely that there may be another M6-7 earthquakes in the region of the fault sometime in the next couple of months. And, given our lack of knowledge about the long term behavior of these faults, it is also possible that there could be a larger M 8 event.
A: Multibeam topography of Romanche region, showing north-south profiles where sampling was carried out. Black dots and red numbers indicate estimated age (in million years) of lithosphere south of Romanche Transform, assuming spreading half-rate of 17 mm/yr within present-day ridge and transform geometry. White dots indicate epicenters of teleseismically recorded 1970–1995 events (magnitude . 4). FZ is fracture zone. B: Topography and petrology at eastern intersection of Romanche Fracture Zone with Mid-Atlantic Ridge. Data were obtained during expeditions S-16, S-19, and G-96 (Bonatti et al., 1994, 1996). C: Location of A along Mid-Atlantic Ridge.
Seismotectonic context. The map location is given by the red rectangle on the inset globe. Focal mechanisms are shown for events with Mw > 6 (ref. 30). Mw > 7.0 events are labelled. Stations of the PI-LAB ocean bottom seismometer network are indicated by triangles. Our relocated hypocentre and low-frequency RMT of the 2016 earthquake are shown by the red star and red beach ball, respectively. The orange beach ball is a colocated Mw 5.8 used for the Mach cone analysis. The black rectangle shows the location of the map in Fig. 2. ISC Bulletin, Bulletin of the International Seismological Centre.
Interpretation of rupture dynamics for the 2016 Romanche earthquake. Top: perspective view of bathymetry along the Romanche FZ. Bottom: interpretive cross-section along the ruptured fault plane. Colours show a thermal profile based on half-space cooling. The green line denotes the predicted transition between velocity-strengthening and velocity-weakening frictional regimes (as expressed by the a – b friction rate parameter) from Gabbro data35. The numbers show the key stages of rupture evolution: (1) rupture initiation (star) in the oceanic mantle, (2) initiation phase has sufficient fracture energy to propagate upwards to the locked section of fault, (3) weak subshear rupture front travels east in the lower crust and/or upper mantle, (4) rupture reaches the locked, thinner crustal segment close to the weaker RTI (SE1), (5) sufficient fracture energy for a westward supershear rupture in the crust along the strongly coupled fault segment (SE2) and (6) rupture possibly terminated by a serpentinized and hydrothermally altered fault segment.
#EarthquakeReport for M 6.9 #Earthquake along the equatorial Mid Atlantic Ridge plate boundary a right-lateral strike-slip earthquake along the Romanche transform faulthttps://t.co/LkglWJgBvD read the report herehttps://t.co/8ZGxTJEU9v pic.twitter.com/axcwlSPDSI — Jason "Jay" R. Patton (@patton_cascadia) September 5, 2022 Mw=7.0, CENTRAL MID-ATLANTIC RIDGE (Depth: 25 km), 2022/09/04 09:42:18 UTC – Full details here: https://t.co/MaNnp6eDAU pic.twitter.com/Gv39KoU3KQ — Earthquakes (@geoscope_ipgp) September 4, 2022 Magnitude 6.9 #earthquake on the mid-Atlantic ridge a couple of hours ago (2022-09-04Z09:42) https://t.co/GwKH4H1yON Predominantly strike-slip (as expected there). Amazing T-phases on the Ascension island hydrophones (data via @IRIS_EPO) coming after the weaker converted P-wave. pic.twitter.com/rCwawAet0W — Dr. Steven J. Gibbons (@stevenjgibbons) September 4, 2022 Major M6.9 right lateral fault #eartquake in oceanic Romanche fracture zone, offsetting central Mid-Atlantic Ridge (3cm/y). Large one for geologic setting, but no surface impact; no tsunami. Textbook behavior. #geohazards https://t.co/F3hXqtkikg pic.twitter.com/KcHL6p1nca — 🌎 Prof Ben van der Pluijm ⚒️ (@vdpluijm) September 4, 2022 Magnitude 6.9 earthquake on the Mid-Atlantic ridge, recorded in New England – detected in Maine, Massachusetts and the Westport Observatory's seismic equipment 4,340 miles from the epicenter in the middle of the Atlantic ocean. @Weston_Quakes https://t.co/dS9MJOU3ow pic.twitter.com/wUJwQ8XBqh — WestportAstroSociety (@westportskyguys) September 4, 2022 2022-09-04 strong M6.9 Central Mid-#Atlantic Ridge #earthquake recorded by online high quality data #RaspberryShakes + 3D trace from Canindé de São Francisco, #Brazil (2031.6km away) + area historical seismicity.#Python @raspishake @matplotlib #CitizenScienc pic.twitter.com/QYqq7lJPaW — Giuseppe Petricca (@gmrpetricca) September 4, 2022
I don’t always have the time to write a proper Earthquake Report. However, I prepare interpretive posters for these events. https://earthquake.usgs.gov/earthquakes/eventpage/us6000i5rd/executive 20220727_philippines_interpretation.pdf 16 MB pdf #EarthquakeReport for M7.1 #Lindol #Earthquake in the #Philippines Shaking reported up to MMI 9! See more abt regional tectonics herehttps://t.co/kZy1TFpDgN USGS page herehttps://t.co/GI4mzfeu0Y pic.twitter.com/pzMzWJDmxm — Jason "Jay" R. Patton (@patton_cascadia) July 27, 2022 I don’t always have the time to write a proper Earthquake Report. However, I prepare interpretive posters for these events. Because of this, I present Earthquake Report Lite. (but it is more than just water, like the adult beverage that claims otherwise). I will try to describe the figures included in the poster, but sometimes I will simply post the poster here. https://earthquake.usgs.gov/earthquakes/eventpage/us6000hm9j/executive I will fill in the details later, after I complete the annual summary. I have not even made a poster for this earthquake yet. Woops.
I don’t always have the time to write a proper Earthquake Report. However, I prepare interpretive posters for these events. Because of this, I present Earthquake Report Lite. (but it is more than just water, like the adult beverage that claims otherwise). I will try to describe the figures included in the poster, but sometimes I will simply post the poster here. https://earthquake.usgs.gov/earthquakes/eventpage/us6000h6nr/executive I will fill in these details a bit more after I complete the annual summary.
I don’t always have the time to write a proper Earthquake Report. However, I prepare interpretive posters for these events. Because of this, I present Earthquake Report Lite. (but it is more than just water, like the adult beverage that claims otherwise). I will try to describe the figures included in the poster, but sometimes I will simply post the poster here. https://earthquake.usgs.gov/earthquakes/eventpage/us6000h519/executive I forgot to write this up when the earthquake happened. I will fill in some details after I have completed my annual summary. 16 March 2022 14:36 UT — José R. Ribeiro (@JoseRodRibeiro) March 16, 2023
There was a magnitude M 6.2 Gempa or Earthquake on 25 February 2022. https://earthquake.usgs.gov/earthquakes/eventpage/us6000gzyg/executive The plate boundary fault system that dominates the tectonics of the Island of Sumatera, Indonesia, is the complicated. The oceanic India-Australia plate converges with the Eurasia plate to form the Sunda trench. This convergent plate boundary forms a subduction zone where the oceanic plate subducts beneath the continental plate. However, the direction of plate convergence is not perpendicular to the plate boundary fault (the megathrust subduction zone). Why does this matter? The amount of plate convergence that is perpendicular to the plate boundary is accommodated by earthquake fault slip on the megathrust. The amount of plate convergence that is parallel to the plate boundary is accommodated by earthquake fault slip on a different series of faults that we call sliver faults. The Great Sumatra fault is one of these [forearc] sliver faults. Here is a figure from Lange et al. (2008) that shows how oblique plate convergence forms both a subduction zone and a forearc sliver fault system. The M 6.2 earthquake is a strike-slip earthquake along the Great Sumatra fault, one of these forearc sliver faults. Based on our knowledge of this fault system and the earthquake mechanism, we can easily interpret this to be a right-lateral strike-slip fault. There are numerous historical analogies from the past century. Most of the events in the past few decades have been in the M 6-7 range, though there have been events of larger magnitude in the past centuries.
India-Australia plate subducts northeastwardly beneath the Sunda plate (part of Eurasia) at modern rates (GPS velocities are based on regional modeling of Bock et al, 2003 as plotted in Subarya et al., 2006). Historic earthquake ruptures (Bilham, 2005; Malik et al., 2011) are plotted in orange. 2004 earthquake and 2005 earthquake 5 meter slip contours are plotted in orange and green respectively (Chlieh et al., 2007, 2008). Bengal and Nicobar fans cover structures of the India-Australia plate in the northern part of the map. RR0705 cores are plotted as light blue. SRTM bathymetry and topography is in shaded relief and colored vs. depth/elevation (Smith and Sandwell, 1997).
This movie illustrates simulation of seismic wave propagation generated by Dec. 26 Sumatra earthquake. Colors indicate amplitude of vertical displacement at the surface of the Earth. Red is upward and blue is downward. Total duration of this simulation is 20 minutes. Source model we used is that of Chen Ji of Caltech. Simulation was performed by using the Earth Simulator of JAMSTEC.
Map of Southeast Asia showing recent and selected historical ruptures of the Sunda megathrust. Black lines with sense of motion are major plate-bounding faults, and gray lines are seafloor fracture zones. Motions of Australian and Indian plates relative to Sunda plate are from the MORVEL-1 global model [DeMets et al., 2010]. The fore-arc sliver between the Sunda megathrust and the strike-slip Sumatran Fault becomes the Burma microplate farther north, but this long, thin strip of crust does not necessarily all behave as a rigid block. Sim = Simeulue, Ni = Nias, Bt = Batu Islands, and Eng = Enggano. Brown rectangle centered at 2°S, 99°E delineates the area of Figure 3, highlighting the Mentawai Islands. Figure adapted from Meltzner et al. [2012] with rupture areas and magnitudes from Briggs et al. [2006], Konca et al. [2008], Meltzner et al. [2010], Hill et al. [2012], and references therein.
New revised (simplified) active fault map of the Sumatran Fault Zone (SFZ) according to the PuSGeN Team for Updating Indonesia Seismic Hazard Map (2016) with new slip rates from geological and geodetical (GPS) recent studies.
Map of 20 geometrically defined segments of the Sumatran fault system and their spatial relationships to active volcanoes, major graben, and lakes.
Tectonic modelling based on continuous GPS – SuGAr 9 Sumatran GPS Array) and coral uplift rates,
Comparison of GPS velocity profiles across the Sumatran fore arc inferred from (left) kinematic block models (right) with previously published velocity profiles. Modeling all fore-arc site velocities with a single strike-slip fault results in anomalously high inferred slip-rates (>22mm/yr) and missing the Sumatran Fault trace by up to 40km. Incorporating the effect of oblique locking of the Sunda megathrust results in lower inferred slip – rates for the Sumatran Fault (~15mm/yr) that are more consistent with updated geological slip rates.
A plausible (but nonunique) history of deformation along the obliquely convergent Sumatran plate margin, based upon our work and consistent with GPS results and the timing of deformation in the forearc region. (a) By about 4 Ma, the outer-arc ridge has formed. The former deformation front and the Mentawai homocline provide a set of reference features for assessing later deformations. From 4 to 2 Ma, partitioning of oblique plate convergence occurs only north of the equator. Dextral-slip faults on the northeast flank of the forearc sliver plate parallel the trench in northern Sumatra but swing south and disarticulate the forearc basin and outer-arc ridge north of the equator. (b) Slip partitioning begins south of the equator about 2 Ma, with the creation of the Mentawai and Sumatran faults. Transtension continues in the forearc north of the equator. (c) In perhaps just the past 100 yr, the Mentawai fault has become inactive, and the rate of slip on the Sumatran fault north of 2°N has more than doubled. This difference in slip rate may be accommodated by a new zone of transtension between the Sumatran fault and the deformation front in the forearc and outer-arc regions.
Relocated MJHD epicenters. (a) Northern Sumatra. (b) Central Sumatra. (c) Southern Sumatra. Solid lines with names indicate segments of the Sumatran fault (Sieh and Natawidjaja, 2000). Symbols are as in Figure 2. The thick solid line (see Fig. 4c) indicates the Ranau–Suwoh area, which was severely damaged by the 1933 Liwa earthquake (Berlage, 1934;Widiwijayanti et al., 1996). The slip rates of the Sumatran fault in northern, central, and southern Sumatra are taken from Ito et al. (2012) and Genrich et al. (2000) for Global Positioning System (GPS) and Bellier and Sebrier (1995) for Satellite Pour l’Observation de la Terre (SPOT).
Earthquake history along the Sumatran fault since 1892. Fault planes estimated in this study are shown by thick lines. SG: Seismic gap.
Coulomb stress models resolved on receiver faults of central part of GSF from coseismic slip model of each large interplate earthquakes. The color represents the maximum stress changes at 10 km depth with a scale saturated at 1 bar.
Cumulative ΔCFF of each earthquake listed in Table 1 (a) and cumulative ΔCFF of 1797, 1833, and 1861 earthquakes (b). The cyan ellipses are the damage area of large intraplate earthquakes marked as green star. The ΔCFF is calculated at 10 km depth with a scale saturated at 1 bar.
FOS = Resisting Force / Driving Force
Annual probability of experiencing a tsunami with a height at the coast of (a) 0.5m (a tsunami warning) and (b) 3m (a major tsunami warning).
#EarthquakeReport for M 6.2 #Gempa #Earthquake along the #Sumatra fault just north of #Padang evidence for strong ground shaking and possible surface rupture read more herehttps://t.co/xujTF3MERq pic.twitter.com/tWEhQTCj06 — Jason "Jay" R. Patton (@patton_cascadia) February 27, 2022 A Mw6.2 earthquake just occurred along the Sumatran Fault in Indonesia. This fault extends for >1700 km, slicing Sumatra in two. The fault aligns closely with the volcanoes generated by the subduction zone to the west. See the fault & volcanoes in the topography below! 🧵 1/ https://t.co/rY6yzEwBwG pic.twitter.com/5gd5YjaPfG — Dr. Judith Hubbard (@JudithGeology) February 25, 2022 Kondisi saat ini di Kec. Talamau Pasaman Barat. Bagi manteman yang ada dilokasi boleh mention kondisi di sana ya @infomitigasi @JogjaUpdate pic.twitter.com/910vTLMioM — Podcast Asap_id (@podcastasap_id) February 25, 2022 An earthquake with Mw 6.2 struck inland with dextral mechanism in the segmentation of Sumatra Fault on this morning (Indonesia Time), killing at least two people and causing tremors that were felt until Singapore and Malaysia. pic.twitter.com/Gd8MoXC8u4 — andrean (@andreanjtk) February 25, 2022 Rangkaian #Gempa yang terjadi di #Sumbar, tapatnya di #Pasamanbarat pada 25 Feb 2022. Rangkaian gempa ini diawal oleh gempa pembuka (foreshock) M=5,2 (08:35:51 WIB), berselang 3 menit 42 detik diikuti oleh gempa utama M=6,2 (08:39:29 WIB). pic.twitter.com/iNQL9tiIcZ — Zulfakriza Z. (@zulfakriza) February 25, 2022 Akibat Gempa di Pasbar terjadi juga longsor di Malampah Pasaman pic.twitter.com/WU9MJ7pSFm — Yazid Lubis (@YazidLubis9) February 25, 2022 Did you feel shaking from this morning's #Sumatra earthquake? The rupture occured along a segment of the Sumatran Fault. While the segment is 400km away from #Singapore, it was widely felt across the island. Learn more about today's event in our blog post https://t.co/bY8KDv3GAx — Earth Observatory SG (@EOS_SG) February 25, 2022 6.1 Mw North-Central Sumatra (#INDONESIA 🇮🇩), a right-lateral strike-slip "Southern Angkola Segment" (Great Sumatran Fault System), potentially for a >7.5 Mw. pic.twitter.com/YSXqgH1Ge1 — Abel Seism🌏Sánchez (@EQuake_Analysis) February 25, 2022 Some hours ago, strong shallow M6.2 #earthquake in Sumatra, widely felt also in Malaysia and Singapore. — José R. Ribeiro (@JoseRodRibeiro) February 25, 2022 Di dekat episenter gempa Pasaman Mag. 6,1 tadi pagi, pada bulan Januari 2022 sudah terjadi 2 gempa tidak dirasakan. pic.twitter.com/IWQvwvAlVY — DARYONO BMKG (@DaryonoBMKG) February 25, 2022 Pasca Gempa di Pasaman Barat semburkan air panas di Bonjol Sumatera Barat. — David Haris St Parmato (@DavidHaris10) February 25, 2022 Ground failure pasca gempa kuat. https://t.co/2ApLwk83aq — DARYONO BMKG (@DaryonoBMKG) February 25, 2022 Vibrasi periode panjang terjadi di Malaysia saat gempa M6,1 Pasaman. https://t.co/zCegE51eI9 — DARYONO BMKG (@DaryonoBMKG) February 25, 2022
I was returning from New Orleans where I was attending the American Geophysical Union Fall Meeting. There was a short layover in Denver and I had a short time to find some food, which is challenging with my dietary restrictions. I cannot recall precisely, but I got some notification from my CGS crew about a magnitude M 6.2 earthquake offshore of the Mendocino triple junction. One of these notifications was from Cindy as we both collaborate to prepare quick reports for earthquakes in California. These reports are sent upstream to management in our organization and others. I was unavailable to contribute this time. Needless to say, I was sad to have missed experiencing this good sized shaker for myself. This is the first earthquake of this size that I have missed (in Humboldt) since I moved here in 1991. Last week or so, their analyses were produced publicly and the earthquake catalog was updated. What we discovered is that there were two closely spaced (in time but not space) earthquakes, an M 5.7 and and M 6.2. https://earthquake.usgs.gov/earthquakes/eventpage/nc71127029/executive It was complicated for the seismologists to work out because the seismic waves of the two events overlapped in time. i.e., the waves from the first quake were still passing through the Earth when the waves from the second quake started. Basically, there was initially an M 5.7 strike-slip earthquake along the Mendocino transform fault zone about 20 km (12.5 miles) offshore. About 10 or 11 seconds later, there was an M 6.2 strike-slip earthquake within the Gorda plate, below the megathrust fault. Here is a plot from the USGS. Each horizontal squiggly line is the seismograph record from an individual seismometer. They are plotted with the seismometer closest to the earthquake on the bottom row and the furthest seismometer on the uppermost row. The P wave (primary wave) is the first of four major types of seismic waves. Next comes the S (secondary) wave, then the Love waves, and finally the Raleigh waves. The P wave arrives at closer seismometers before it arrives at more distant seismometers. Because of this, we generally call this type of plot a travel time plot. In the above plot we can see how the M 6.1 P waves are arriving while the M 5.7 S waves are still being transmitted. The M 5.7 is clearly a right-lateral strike-slip event given the aftershock pattern and the known location and type of the Mendocino fault system (a right-lateral strike-slip fault. Earthquake mechanisms (the “beach balls”) show two possible ways that the earthquake could have slipped. We use aftershock patterns and existing mapped faults to help us interpret which of these [nodal] fault planes is the more likely one. If we look at the earthquake poster below, we see that the M 6.2 earthquake is an almost pure strike-slip earthquake. The two possible fault planes are one that is oriented in the northwest direction (would be right-lateral) and one that is in the northeast direction (would be left-lateral). So, while most of our experience with the Gorda plate is with northeast oriented (striking) left-lateral strike-slip faults (e.g., 1980, 2010, 2014, etc.) it is possible that there are other faults, sub-parallel to the post-1992 seismicity trends, where the M 6.2 and other aftershocks were hosted. I mention these northwest trending faults in a recent Earthquake Report here. Something that is interesting is that the onshore events from this 20 Dec 2021 sequence are just to the north of the aftershocks from the 1992 sequence. They are at similar depths as those ’92 quakes and have similar earthquake mechanisms. As Spock would say, Fascinating. Dr. Anthony Lomax, famous for his work locating the hypocenter for the 1906 San Francisco Earthquake, has been developing excellent tools for seismologists ever since. He recently applied one of his new tools to locate earthquakes to the Mendocino triple junction region. I present some of his figures below. There are many different ways in which a landslide can be triggered. The first order relations behind slope failure (landslides) is that the “resisting” forces that are preventing slope failure (e.g. the strength of the bedrock or soil) are overcome by the “driving” forces that are pushing this land downwards (e.g. gravity). The ratio of resisting forces to driving forces is called the Factor of Safety (FOS). We can write this ratio like this: FOS = Resisting Force / Driving Force When FOS > 1, the slope is stable and when FOS < 1, the slope fails and we get a landslide. The illustration below shows these relations. Note how the slope angle α can take part in this ratio (the steeper the slope, the greater impact of the mass of the slope can contribute to driving forces). The real world is more complicated than the simplified illustration below. Landslide ground shaking can change the Factor of Safety in several ways that might increase the driving force or decrease the resisting force. Keefer (1984) studied a global data set of earthquake triggered landslides and found that larger earthquakes trigger larger and more numerous landslides across a larger area than do smaller earthquakes. Earthquakes can cause landslides because the seismic waves can cause the driving force to increase (the earthquake motions can “push” the land downwards), leading to a landslide. In addition, ground shaking can change the strength of these earth materials (a form of resisting force) with a process called liquefaction. Sediment or soil strength is based upon the ability for sediment particles to push against each other without moving. This is a combination of friction and the forces exerted between these particles. This is loosely what we call the “angle of internal friction.” Liquefaction is a process by which pore pressure increases cause water to push out against the sediment particles so that they are no longer touching. An analogy that some may be familiar with relates to a visit to the beach. When one is walking on the wet sand near the shoreline, the sand may hold the weight of our body generally pretty well. However, if we stop and vibrate our feet back and forth, this causes pore pressure to increase and we sink into the sand as the sand liquefies. Or, at least our feet sink into the sand. Below is a diagram showing how an increase in pore pressure can push against the sediment particles so that they are not touching any more. This allows the particles to move around and this is why our feet sink in the sand in the analogy above. This is also what changes the strength of earth materials such that a landslide can be triggered. Below is a diagram based upon a publication designed to educate the public about landslides and the processes that trigger them (USGS, 2004). Additional background information about landslide types can be found in Highland et al. (2008). There was a variety of landslide types that can be observed surrounding the earthquake region. So, this illustration can help people when they observing the landscape response to the earthquake whether they are using aerial imagery, photos in newspaper or website articles, or videos on social media. Will you be able to locate a landslide scarp or the toe of a landslide? This figure shows a rotational landslide, one where the land rotates along a curvilinear failure surface.
The Gorda and Juan de Fuca plates subduct beneath the North America plate to form the Cascadia subduction zone fault system. In 1992 there was a swarm of earthquakes with the magnitude Mw 7.2 Mainshock on 4/25. Initially this earthquake was interpreted to have been on the Cascadia subduction zone (CSZ). The moment tensor shows a compressional mechanism. However the two largest aftershocks on 4/26/1992 (Mw 6.5 and Mw 6.7), had strike-slip moment tensors. In my mind, these two aftershocks aligned on what may be the eastern extension of the Mendocino fault. However, looking at their locations, my mind was incorrect. These two earthquakes were not aftershocks, but were either left-lateral or right-lateral strike-slip Gorda plate earthquakes triggered by the M 7.1 thrust event. These two quakes appear to be aligned with the two northwest trends in seismicity and the 18 March 2020 M 5.2. The orientation of the mechanisms are not as perfectly well aligned, but there are lots of reasons for this (perhaps the faults were formed in a slightly different orientation, but have rotated slightly). There have been several series of intra-plate earthquakes in the Gorda plate. Two main shocks that I plot of this type of earthquake are the 1980 (Mw 7.2) and 2005 (Mw 7.2) earthquakes. I place orange lines approximately where the faults are that ruptured in 1980 and 2005. These are also plotted in the Rollins and Stein (2010) figure above. The Gorda plate is being deformed due to compression between the Pacific plate to the south and the Juan de Fuca plate to the north. Due to this north-south compression, the plate is deforming internally so that normal faults that formed at the spreading center (the Gorda Rise) are reactivated as left-lateral strike-slip faults. In 2014, there was another swarm of left-lateral earthquakes in the Gorda plate. I posted some material about the Gorda plate setting on this page.
Tectonic configuration of the Gorda deformation zone and locations and source models for 1976–2010 M ≥ 5.9 earthquakes. Letters designate chronological order of earthquakes (Table 1 and Appendix A). Plate motion vectors relative to the Pacific Plate (gray arrows in main diagram) are from Wilson [1989], with Cande and Kent’s [1995] timescale correction.
A: Mapped faults and fault-related ridges within Gorda plate based on basement structure and surface morphology, overlain on bathymetric contours (gray lines—250 m interval). Approximate boundaries of three structural segments are also shown. Black arrows indicated approximate location of possible northwest- trending large-scale folds. B, C: uninterpreted and interpreted enlargements of center of plate showing location of interpreted second-generation strike-slip faults and features that they appear to offset. OSC—overlapping spreading center.
Models of brittle deformation for Gorda plate overlain on magnetic anomalies modified from Raff and Mason (1961). Models A–F were proposed prior to collection and analysis of full-plate multibeam data. Deformation model of Gulick et al. (2001) is included in model A. Model G represents modification of Stoddard’s (1987) flexural-slip model proposed in this paper.
Earthquake Report for M 6.9 Earthquake in Taiwan
Because of this, I present Earthquake Report Lite. (but it is more than just water, like the adult beverage that claims otherwise). I will try to describe the figures included in the poster, but sometimes I will simply post the poster here.Below is my interpretive poster for this earthquake
I include some inset figures.
Supportive Figures
Social Media:
India | Asia | India Ocean
Earthquake Reports
References:
Basic & General References
Specific References
Return to the Earthquake Reports page.
Earthquake Report: M 7.6 Papua New Guinea
Below is my interpretive poster for this earthquake
I include some inset figures. Some of the same figures are located in different places on the larger scale map below.
Other Report Pages
Some Relevant Discussion and Figures
Shaking Intensity
Potential for Ground Failure
There are many different ways in which a landslide can be triggered. The first order relations behind slope failure (landslides) is that the “resisting” forces that are preventing slope failure (e.g. the strength of the bedrock or soil) are overcome by the “driving” forces that are pushing this land downwards (e.g. gravity). The ratio of resisting forces to driving forces is called the Factor of Safety (FOS). We can write this ratio like this:
New Britain | Solomon | Bougainville | New Hebrides | Tonga | Kermadec Earthquake Reports
General Overview
Earthquake Reports
Social Media
normal oblique
7 dec '89 M7.1
14 dec '11 M7.1
6 may '19 M7.1
🔸Intensidad MMI: IX (Extremo)
🔸Profundidad: 61 km
🔸Distancia: 14772 (epicentro-estación) pic.twitter.com/8EVKmCIHT1
•Creditos Respectivos
•No se sabe localizacion precisa (Probablemente Madang)
–#Sismo #Temblor #Earthquake pic.twitter.com/Rq67oUONGU
References:
Basic & General References
Specific References
Return to the Earthquake Reports page.
Earthquake Report: M 6.9 Mid Atlantic Ridge
Earthquake magnitude is controlled by three things:
If we continue to look at the historic record, we will see that there appear to be three instances where one of these M 6.5-7 earthquakes had a later earthquake of a similar magnitude.
When an earthquake fault slips, the crust surrounding the fault squishes and expands, deforming elastically (like in one’s underwear). These changes in shape of the crust cause earthquake fault stresses to change. These changes in stress can either increase or decrease the chance of another earthquake.
I wrote more about this type of earthquake triggering for Temblor here. Head over there to learn more about “static coulomb stress triggering.”
In the poster, I label these earthquakes as “Linked Earthquakes.” Perhaps the later of each earthquake pair (or triple) was triggered by the change in static coulomb stress.
Here are the three sets of “Linked Earthquakes:”
Since we cannot yet know the real answer to this question, we are reminded of the advice that educators and emergency response people provide: If one lives in Earthquake Country, get earthquake prepared. Just a little effort to get better prepared makes a major difference in the outcome.
Head over to Earthquake Alliance where there are some excellent brochures about how to be better prepared and more resilient to earthquake and tsunami hazards. Living on Shaky Ground is one of my favorites!Below is my interpretive poster for this earthquake
I include some inset figures. Some of the same figures are located in different places on the larger scale map below.
Some Relevant Discussion and Figures
Atlantic
General Overview
Earthquake Reports
Social Media
References:
Basic & General References
Specific References
Return to the Earthquake Reports page.
Earthquake Report M 7.0 Philippines
Because of this, I present Earthquake Report Lite. (but it is more than just water, like the adult beverage that claims otherwise). I will try to describe the figures included in the poster, but sometimes I will simply post the poster here.Below is my interpretive poster for this earthquake
I include some inset figures.
Philippines | Western Pacific
Earthquake Reports
References:
Basic & General References
Specific References
Social Media: Here is my thread for this event.
This has potential to be quite devastatingReturn to the Earthquake Reports page.
Earthquake Report M 6.9 Macquarie Island
Below is my interpretive poster for this earthquake
I include some inset figures.
New Zealand | Australia
General Overview
Earthquake Reports
References:
Basic & General References
Specific References
Return to the Earthquake Reports page.
Earthquake Report M 6.7 in Taiwan
Below is my interpretive poster for this earthquake
I include some inset figures.
India | Asia Earthquake Reports
Earthquake Reports
References:
Basic & General References
Specific References
Return to the Earthquake Reports page.
Earthquake Report M 7.3 offshore of Japan
Below is my interpretive poster for this earthquake
I include some inset figures.
Japan | Izu-Bonin | Mariana Earthquake Reports
General Overview
Earthquake Reports
Social Media:
Mw7.3 #Earthquake offshore Fukushima, North Honshu, Japan, triggered a 0.3m #tsunami, causing heavy damage and death of four people. Like the 2011 and 2021 M7, it was a intraslab EQ.https://t.co/OeVlblrRzShttps://t.co/GMfvmFUaGlhttps://t.co/JLt9uvICSM pic.twitter.com/nshLVvI7uz
References:
Basic & General References
Specific References
Return to the Earthquake Reports page.
Earthquake Report: M 6.2 along the Great Sumatra fault
Below is a low-angle oblique view cut into the Earth showing this plate configuration from the Earth Observatory Singapore.
Because the convergence is at an angle oblique to the plate boundary, we can imagine that this convergence can be subdivided into two components of motion:
Below is my interpretive poster for this earthquake
I include some inset figures. Some of the same figures are located in different places on the larger scale map below.
Some Relevant Discussion and Figures
Earthquake Stress Triggering
Shaking Intensity
Potential for Ground Failure
There are many different ways in which a landslide can be triggered. The first order relations behind slope failure (landslides) is that the “resisting” forces that are preventing slope failure (e.g. the strength of the bedrock or soil) are overcome by the “driving” forces that are pushing this land downwards (e.g. gravity). The ratio of resisting forces to driving forces is called the Factor of Safety (FOS). We can write this ratio like this:
Seismic Hazard and Seismic Risk
Tsunami Hazard
Indonesia | Sumatra
General Overview
Earthquake Reports
Social Media
historical analogueshttps://t.co/Se0jsMEvGO
Hope everybody is OK in the epicentral area.https://t.co/0cddTk78dK pic.twitter.com/MW9G6IwTje
Padang Gempa Sumbar pic.twitter.com/cBBQka8hkj
References:
Basic & General References
Specific References
Return to the Earthquake Reports page.
Earthquake Report: M 5.7 & 6.2 Mendocino triple junction
I got home about 3 am the next morning and did not have energy to prepare an earthjay report. Though I started working on it the next day. However, I soon learned that this was a complicated earthquake and I decided to await additional analyses by the Berkeley Seismmo Lab and the USGS.
https://earthquake.usgs.gov/earthquakes/eventpage/nc73666231/executive
The interpretation for the type of earthquake for the M 6.2 is a little more complicated.
There are two reasons why I interpret the M 6.2 to be right-lateral (of course, I could be wrong).
Below is my interpretive poster for this earthquake
I include some inset figures. Some of the same figures are located in different places on the larger scale map below.
Other Report Pages
Shaking Intensity and Potential for Ground Failure
Some Relevant Discussion and Figures
I have compiled some literature about the CSZ earthquake and tsunami. Here is a short list that might help us learn about what is contained within the core that I collected.
Cascadia subduction zone
General Overview
Earthquake Reports
Gorda plate
Blanco transform fault
Mendocino fault
Mendocino triple junction
North America plate
Explorer plate
Uncertain
Social Media
References:
Basic & General References
Specific References
Return to the Earthquake Reports page.