Often I feel FOMO (fear of missing out) when I am out of town for work and there is a large storm as I would be missing the opportunity to observe some extreme weather.
I was traveling for work in Colorado, where I had awakened to a temperature of -9 deg F (-23 deg C). It had snowed the night before so it was very cold while i was clearing the snow off the car.
It was so cold, it was sticky. I drove safely to the airport, wondering if the weather system in coastal northern California would interfere with my flight.
I posted to social media about the weather in Denver and people commented that I might need a boat to get home from the airport.
Well, we landed at the airport coming from the north, while most flights land coming from the south.
The wind gusts were intense and it was raining heavily.
Here is present some data from the storm.
I set up a page that has links to images and websites of interest to me, here in Humboldt County, California.
Here is a website with a map interface that allows one to locate hydrographs for stream gages. THis one is from the National Oceanic and Atmospheric Administration (NOAA). But the U.S. Geological Survey (USGS) does too.
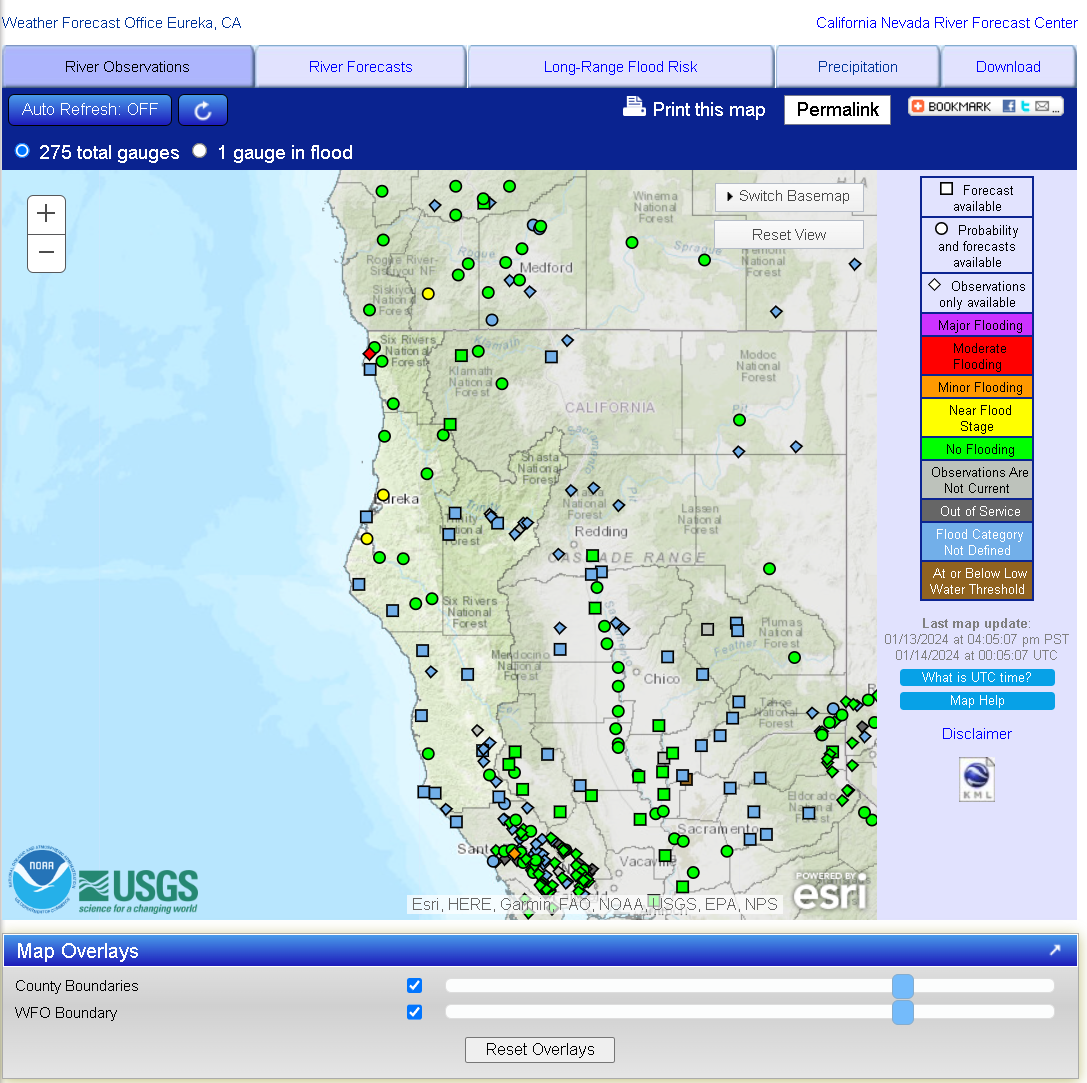
This is a screenshot from that website. The location of each stream gage is symbolized with color representing the relative level of the river at that time. I took this screenshot after most of the extreme flooding was over (see how most of the symbols are blue or green).
One may click on those symbols to see the hydrograph for that stream gage. NOAA also provides lots of additional information too (flood history).
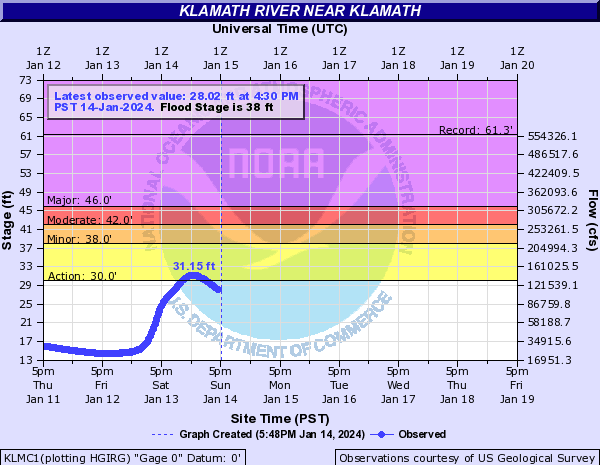
Stream gages record the water surface elevation, the height of the top of the water in a river relative to some datum (like sea level).
Hydrographs are plots that show the height of the water surface elevation (vertical axis) relative to time (horizontal axis).
Hydrographs show how the amount of water in a river or creek changes with time. At higher levels, there is more water in the river.
Hydrologists use statistics from the rivers where these stream gages are located to develop “rating curves.” Rating curves allow us to convert one set of data to another.
For example, we can use rating curves to convert the water surface elevation to the volume of water flowing past the stream gage. The volume of water moving is called “discharge” and expressed in units of volume per time (like cubic feet per second (cfs) or cubic meters per second (cms)).
The hydrographs on these NOAA websites include the water surface elevation (relative to the local datum) and discharge (in cfs).
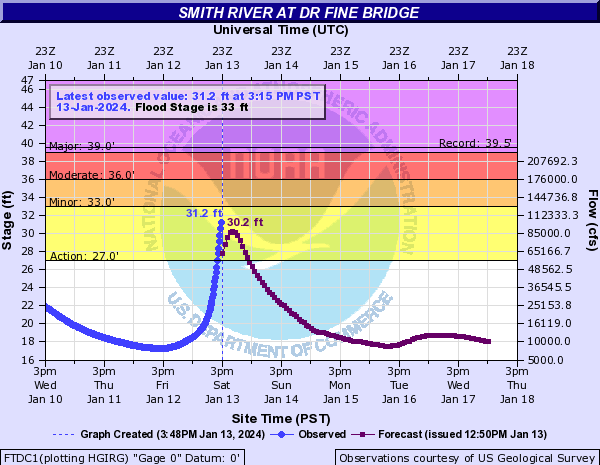
Del Norte
Much of Del Norte got between 10 and 15 inches (25 and 38 centimeters) of rain over the past week (most of it the past couple of days).
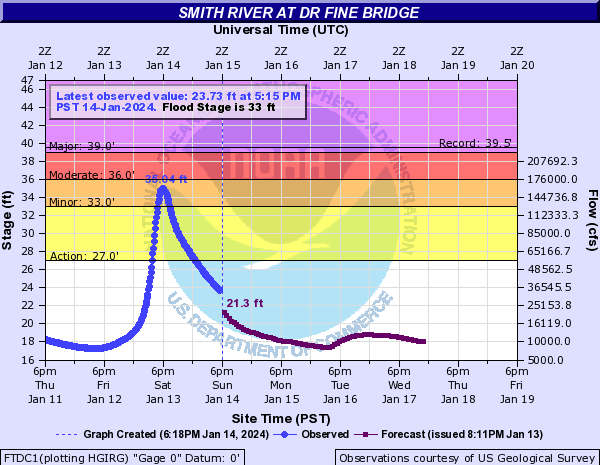
Smith River at Dr Fine Bridge (HWY 101)
- Here is the source of the hydrograph.
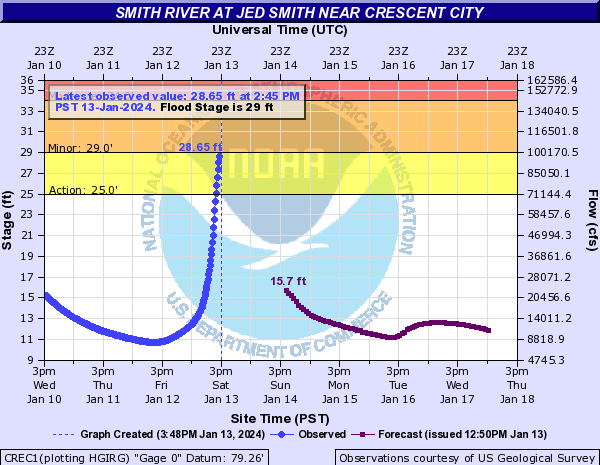
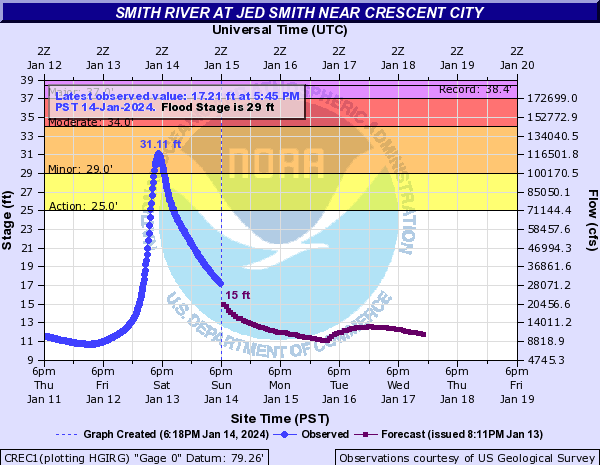
Smith River at Jed Smith
- Here is the source of the hydrograph.
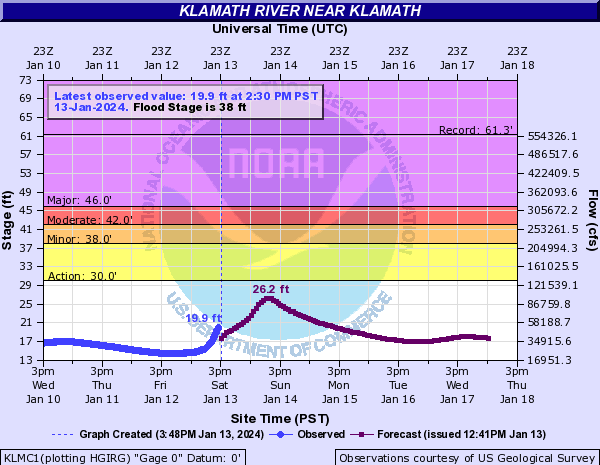
Klamath River at Klamath (Hwy 101)
- Here is the source of the hydrograph.
Humboldt
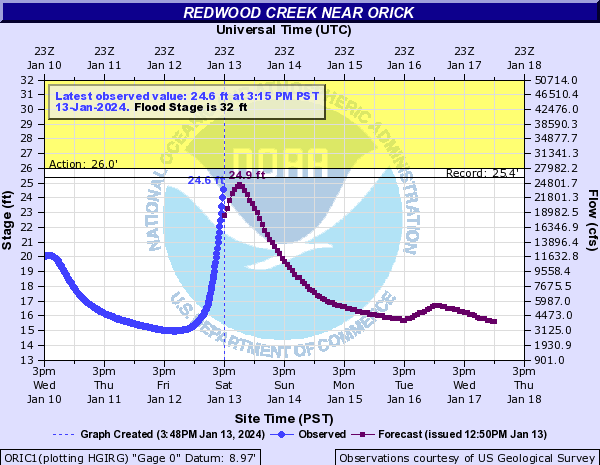
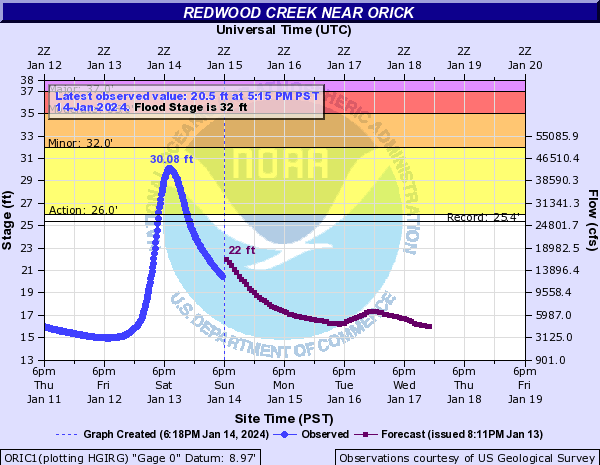
Much of Redwood Creek got between 10 and 15 inches of rain over the past week (mostly the past couple of days). This is probably one of the reasons why the hydrograph from Redwood Creek shows that the flood record was broken here.
Here is the USGS website for the stream gage in Orick.
Redwood Creek at Orick
- Here is the source of the hydrograph.
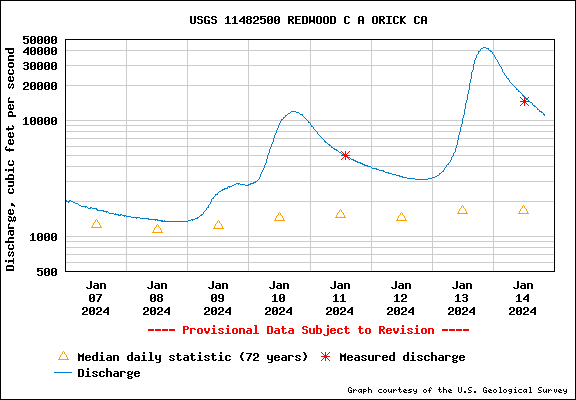
- Here is the USGS gage for Redwood Creek
- The USGS hydrographs don’t include forecasts (that is NOAAs purview) but they show more data from the previous days.
- We can also see some stats for the gage (mean daily statistic) and the times that they collected discharge data (we can see that they sadly missed the peaks, which happened at night).
- This hydrograph shows that this record flow was over 40,000 cfs.
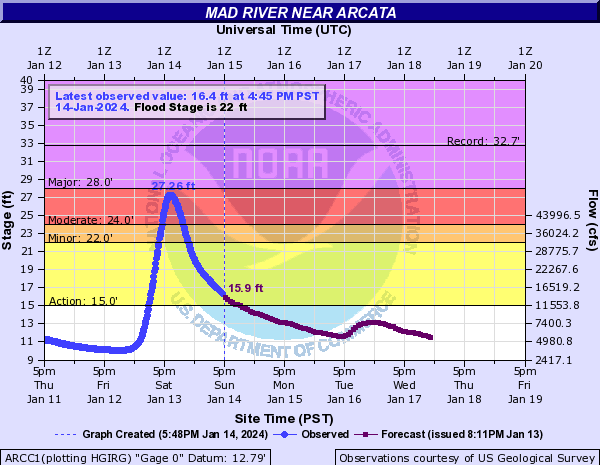
Mad River also got lots of rain, much of the watershed getting between 8 and 10 inches of rain.
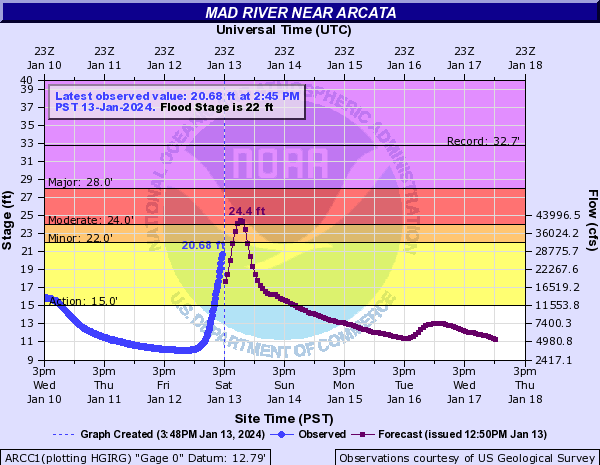
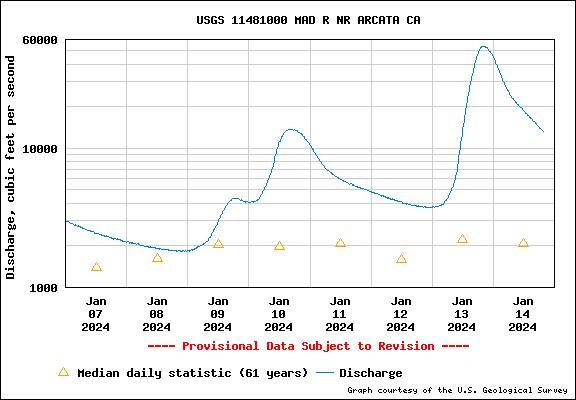
Mad River near Arcata & Blue Lake
- Here is the source of the hydrograph.
- Here is the USGS gage for Mad River

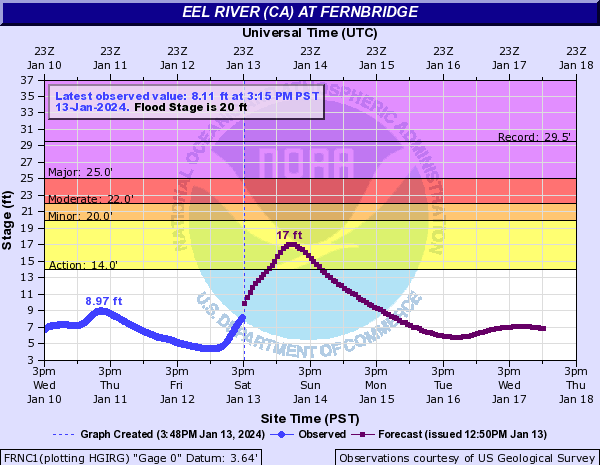
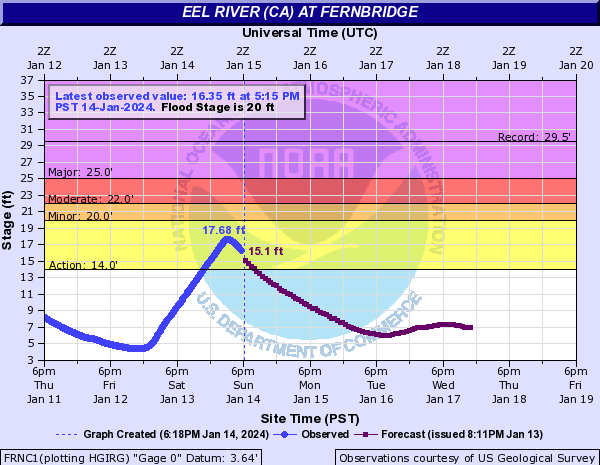
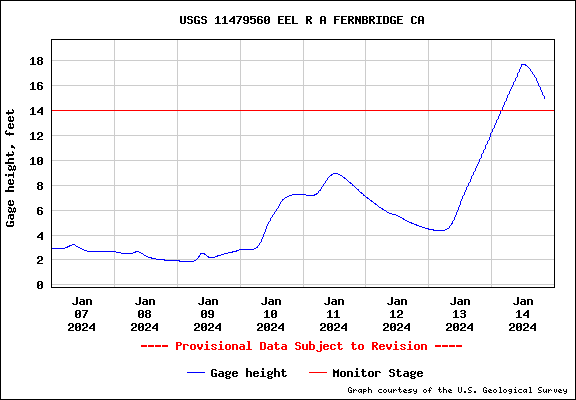
Eel River at Fernbridge
- Here is the source of the hydrograph.
- Here is the USGS gage for Eel River at Fernbridge
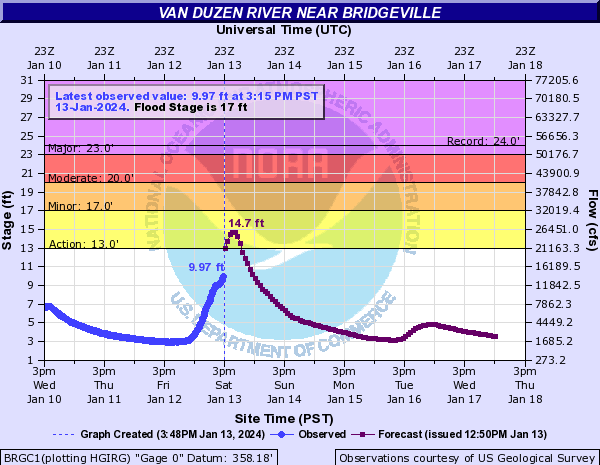
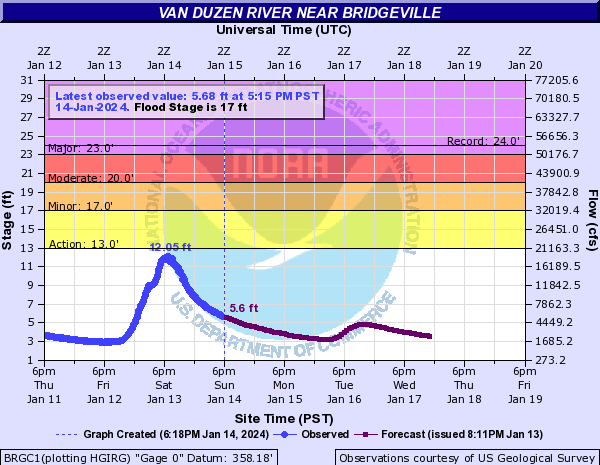
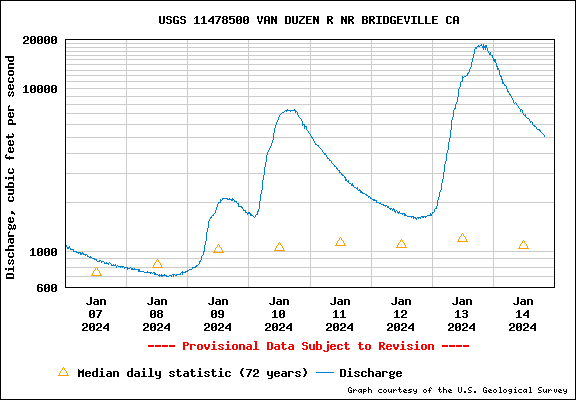
Van Duzen River near Bridgeville
- Here is the source of the hydrograph.
- Here is the USGS gage for Van Duzen River near Bridgeville
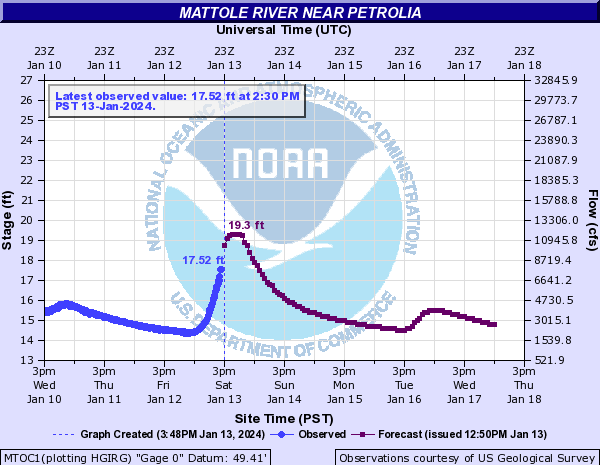
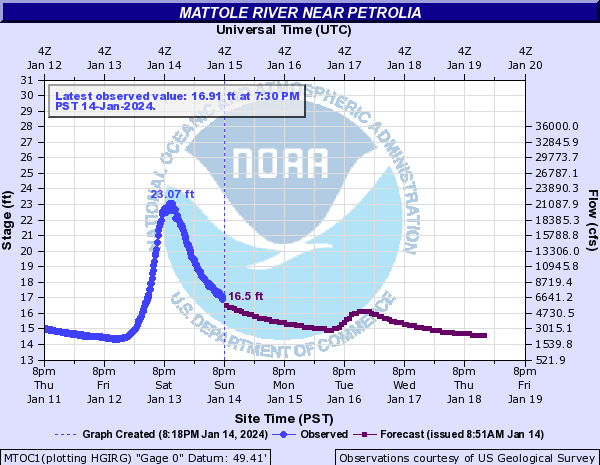
Mattole River near Petrolia
- Here is the source of the hydrograph.
Precipitation Record
The California Nevada Precipitation Forecast Center is a rich source of hydological data. They have a webpage with an interface with links to stream gages.
They also have web pages that have ways of looking at the rainfall for particular time periods.
Here is the CNPFC webpage that summarizes rainfall from the past week (one can modify the time range).
- This interface shows the amount of precipitation using color.
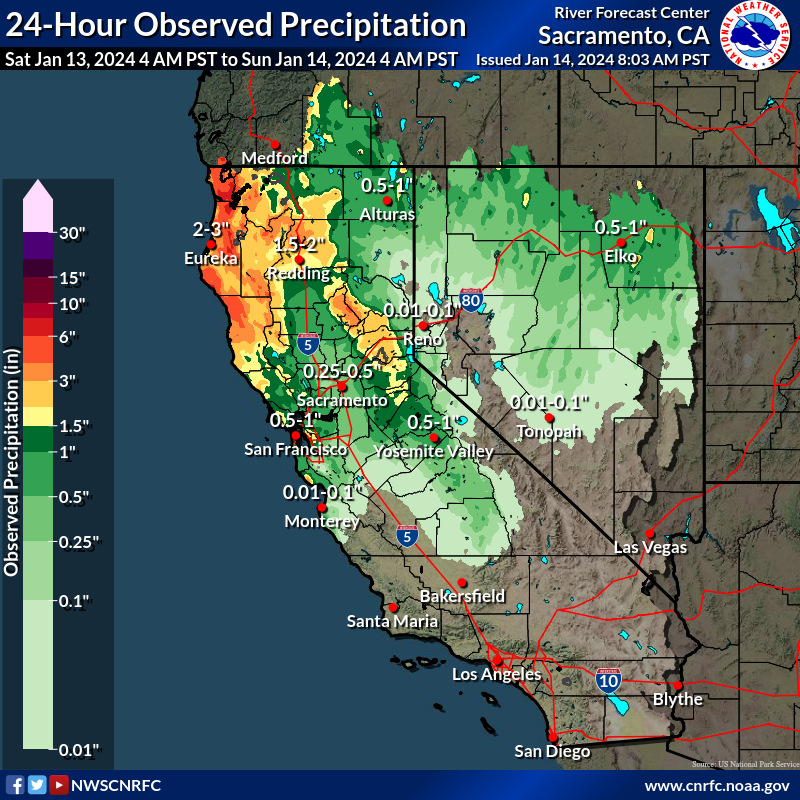
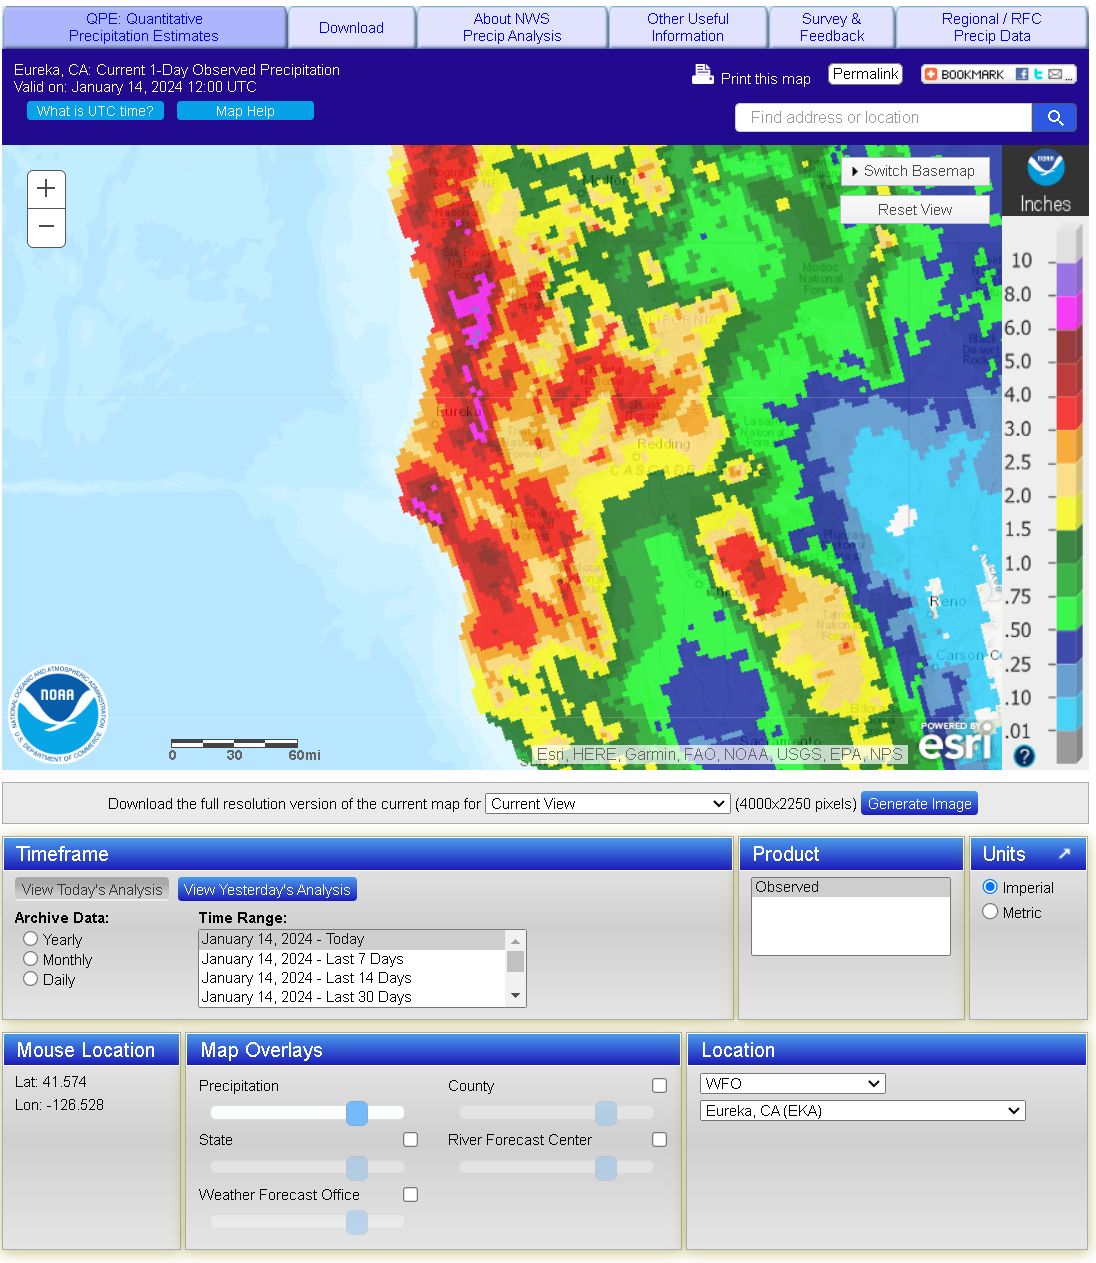
- Below is the rainfall for the past 24 hours (as of the time I prepared this: 14 Jan 2024, 19:20 Pacific Time).
- This shows there were between 2 and 3 inches of rain in Eureka. Note the large amount of precipitation in Del Norte and northern Humboldt.
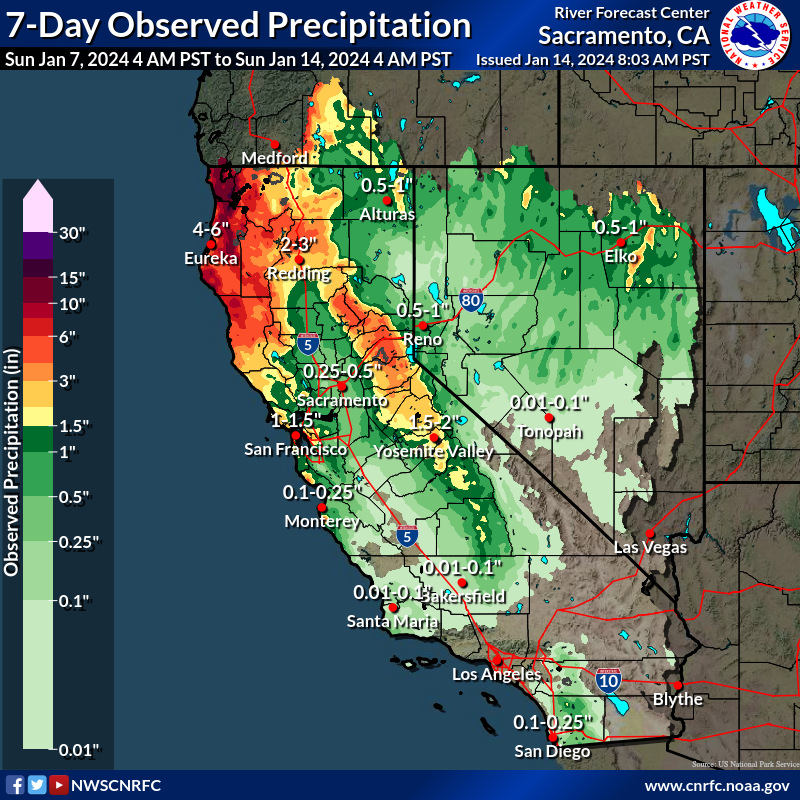
- Below is the rainfall for the past 7 days (as of the time I prepared this: 14 Jan 2024, 19:20 Pacific Time).
- This shows that there was between 4 and 6 inches of rain in Eureka. In most of Del Norte, there was between 10 and 15 inches of rain! This area covers the Smith River and lower Klamath River. Redwood Creek also got between 10 and 15 inches of rain.
Here is another CNPFC webpage that summarizes rainfall observations for different time ranges (one can modify the time range).
- This shows that there was 2.5 to 3.5 inches of precipitation in Eureka.
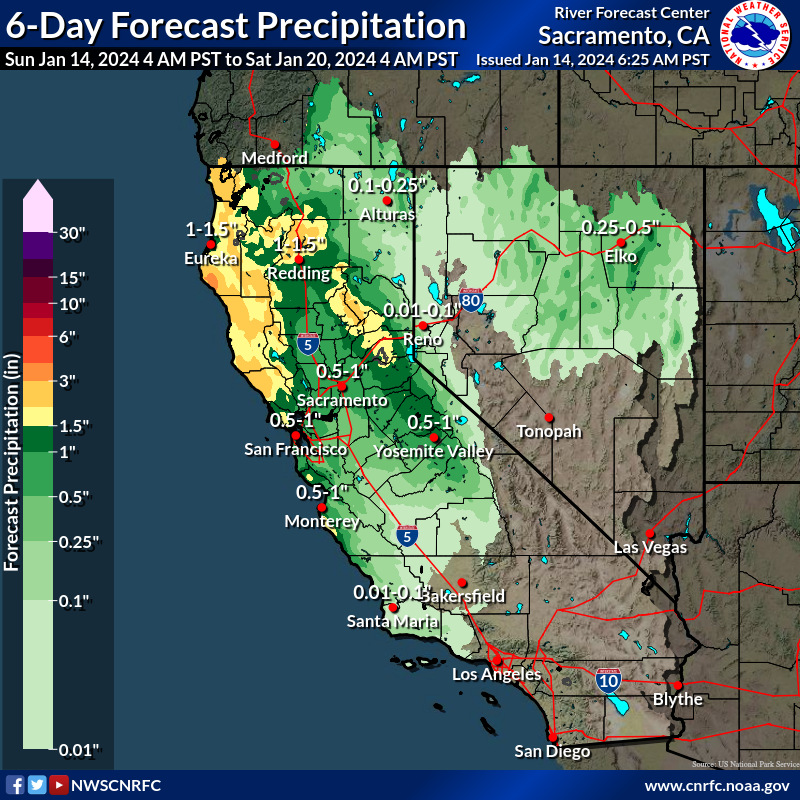
Here is the CNPFC webpage that summarizes rainfall forecast for the upcoming 6 days (one can modify the time range).
- This interface shows the forecast amount of precipitation using color.
- Below is the rainfall for the next 6 days (as of the time I prepared this: 14 Jan 2024, 19:20 Pacific Time).
- This shows that there will be 1 to 1.5 inches of precipitation in Eureka.
- If we compare this with the rain from the previous week, and we look at the forecast water levels in the hydrograph, what can we conclude? With less rain, do the forecasted water levels in the rivers reflect this?