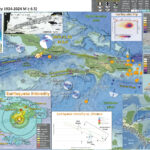
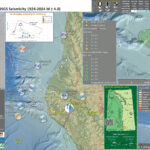
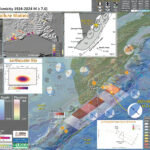
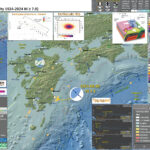
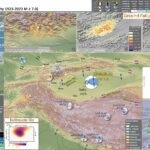
The past couple of weeks have been busy from an earthquake perspective. There have been four M7 events.
I am writing this report a few days late. But, better late than never!
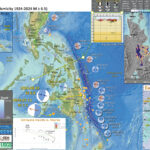
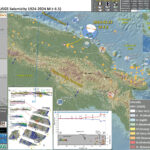
There was a magnitude M 7.0 earthquake offshore of the Solomon Islands.
https://earthquake.usgs.gov/earthquakes/eventpage/us7000irfb/executive
The Solomon Islands owe their existence to the plate boundary fault system there, a convergent plate boundary where plates move towards each other. The plate boundary here is formed by the subduction of the Australia plate beneath the Pacific plate.
The largest earthquakes that happen on Earth happen on these subduction zone faults.
At first I thought that this was an interface earthquake along the megathrust subduction zone fault. These are called interface events because they happen along the fault interface between the two plates. They are also called interplate earthquakes.
However, as the earthquake mechanisms (e.g., focal mechanism or moment tensor) were calculated and posted online, it was clear that this was not a megathrust earthquake.
Here is an illustration that shows a cross section of a subduction zone. I show hypothetical locations for different types of earthquakes. I include earthquake mechanisms (as they would be viewed from map view) for these different types of earthquakes.
Here is a legend for these different mechanisms. We can see what the mechanisms look like from map view (from looking down onto Earth from outer space or from flying in an airplane) and what they look like from the side.
The mechanism for the M 7.0 Solomon Isle earthquake is an extensional (normal) type of an earthquake that happened in the slab of the Australia plate.
Typically, the extension in these slab events is perpendicular to the plate boundary fault because that is the direction that the plate is pulling down (slab pull) due to gravity or that is the orientation of bending of the plate that causes this extension.
In this case, the orientation of extension is oblique (not perpendicular, nor parallel) to the plate boundary. The leading hypothesis for this is that there is some pre-existing structure in the Australia plate that hosted this earthquake fault slip.
If we look to the west, to the structures in the Woodlark Basin, we see some candidate structures for this earthquake. These are faults that are related to the seafloor spreading that formed the Woodlark Basin. It is possible that some of these faults have been subducted beneath the Solomon Isles (though this is unclear).
There are also records of tsunami and seismic waves on water level sensors in this region. A tsunami was observed on the Honiara tide gage and seismic waves observed on the Coral Sea DART Buoy 55023.
Here are the tide gage data from https://webcritech.jrc.ec.europa.eu/SeaLevelsDb/Home. This is a small tsunami that happened on a tide gage with noisy data. So, it is difficult to tell how long the tsunami lasted here.
Here are the DART data from the same website. I triple checked the size of the wave but it still seems a little large for a seismic wave. I could still be wrong. Feel free to contact me if you think this plot needs to be corrected! quakejay at gmail.com.
Below is my interpretive poster for this earthquake
- I plot the seismicity from the past month, with diameter representing magnitude (see legend). I include earthquake epicenters from 1922-2022 with magnitudes M ≥ 3.0 in one version.
- I plot the USGS fault plane solutions (moment tensors in blue and focal mechanisms in orange), possibly in addition to some relevant historic earthquakes.
- A review of the basic base map variations and data that I use for the interpretive posters can be found on the Earthquake Reports page. I have improved these posters over time and some of this background information applies to the older posters.
- Some basic fundamentals of earthquake geology and plate tectonics can be found on the Earthquake Plate Tectonic Fundamentals page.
- In the upper left is a map that shows the plate boundary faults and a century of seismicity. The shoreline data come from GIS data at Natural Earth (a great source of fee GIS data).
- In the center right is a map from Holm et al. (2016) that shows various key elements of the plate configuration in this region. Colors representing the age of the crust shows how the Woodlark Basin has an active spreading ridge system with ridges striking East-West. Large Igneous Provinces are shown here in dark gray. A relevant cross section is C-D, with the location highlighted in magenta on the map. The cross section shows how the North Solomon Trench is configured.
- In the lower right corner is a map that shows the ground shaking from the earthquake, with color representing intensity using the Modified Mercalli Intensity (MMI) scale. The closer to the earthquake, the stronger the ground shaking. The colors on the map represent the USGS model of ground shaking. The colored circles represent reports from people who posted information on the USGS Did You Feel It? part of the website for this earthquake. There are things that affect the strength of ground shaking other than distance, which is why the reported intensities are different from the modeled intensities.
- In the center left is a plot that shows how the shaking intensity models and reports relate to each other. The horizontal axis is distance from the earthquake and the vertical axis is shaking intensity (using the MMI scale, just like in the map to the right: these are the same datasets).
- In the upper right are two maps that show models of how there may have been landslides or liquefaction because of the earthquake shaking and impacts. Read more about landslides and liquefaction here. I include the USGS epicenter as a yellow circle. These ground failure models are based on the USGS epicenter/location.
- In the lower center are water surface elevation (WSE) data from a tide gage in Honiara and a DART buoy located near Cocos Island. The tide gage shows a small tsunami and the DART buoy shows evidence for seismic waves from this earhquake.
I include some inset figures. Some of the same figures are located in different places on the larger scale map below.
- Here is an educational video (from IRIS) for this part of the western Pacific. There are many plate boundaries and these margins are very active. This is a link to the embedded video below (10.4 MB mp4)
Other Report Pages
- This figure shows an interpretation of the regional tectonics (Holm et al., 2016). I include the figure caption below as a blockquote.
- This figure shows details of the regional tectonics (Holm et al., 2016). I include the figure caption below as a blockquote.
Some Relevant Discussion and Figures
Tectonic setting of Papua New Guinea and Solomon Islands. a) Regional plate boundaries and tectonic elements. Light grey shading illustrates bathymetry b 2000 m below sea level indicative of continental or arc crust, and oceanic plateaus; 1000 m depth contour is also shown. Adelbert Terrane (AT); Bismarck Sea fault (BSF); Bundi fault zone (BFZ); Feni Deep (FD); Finisterre Terrane (FT); Gazelle Peninsula (GP); Kia-Kaipito-Korigole fault zone (KKKF); Lagaip fault zone (LFZ); Mamberamo thrust belt (MTB); Manus Island (MI); New Britain (NB); New Ireland (NI); North Sepik arc (NSA); Ramu-Markham fault (RMF); Weitin Fault (WF);West Bismarck fault (WBF); Willaumez-Manus Rise (WMR).
a) Present day tectonic features of the Papua New Guinea and Solomon Islands region as shown in plate reconstructions. Sea floor magnetic anomalies are shown for the Caroline plate (Gaina and Müller, 2007), Solomon Sea plate (Gaina and Müller, 2007) and Coral Sea (Weissel and Watts, 1979). Outline of the reconstructed Solomon Sea slab (SSP) and Vanuatu slab (VS)models are as indicated. b) Cross-sections related to the present day tectonic setting. Section locations are as indicated. Bismarck Sea fault (BSF); Feni Deep (FD); Louisiade Plateau
(LP); Manus Basin (MB); New Britain trench (NBT); North Bismarck microplate (NBP); North Solomon trench (NST); Ontong Java Plateau (OJP); Ramu-Markham fault (RMF); San Cristobal trench (SCT); Solomon Sea plate (SSP); South Bismarck microplate (SBP); Trobriand trough (TT); projected Vanuatu slab (VS); West Bismarck fault (WBF); West Torres Plateau (WTP); Woodlark Basin (WB).
- 2022.11.22 M 7.0 Solomon Isles
- 2022.11.11 M 7.3 Tonga
- 2022.09.10 M 7.6 Papua New Guinea
- 2021.03.04 M 8.1 Kermadec
- 2021.02.10 M 7.7 Loyalty Islands
- 2019.06.15 M 7.2 Kermadec
- 2019.05.14 M 7.5 New Ireland
- 2019.05.06 M 7.2 Papua New Guinea
- 2018.12.05 M 7.5 New Caledonia
- 2018.10.10 M 7.0 New Britain, PNG
- 2018.09.09 M 6.9 Kermadec
- 2018.08.29 M 7.1 Loyalty Islands
- 2018.08.18 M 8.2 Fiji
- 2018.03.26 M 6.9 New Britain
- 2018.03.26 M 6.6 New Britain
- 2018.03.08 M 6.8 New Ireland
- 2018.02.25 M 7.5 Papua New Guinea
- 2018.02.26 M 7.5 Papua New Guinea Update #1
- 2017.11.19 M 7.0 Loyalty Islands Update #1
- 2017.11.07 M 6.5 Papua New Guinea
- 2017.11.04 M 6.8 Tonga
- 2017.10.31 M 6.8 Loyalty Islands
- 2017.08.27 M 6.4 N. Bismarck plate
- 2017.05.09 M 6.8 Vanuatu
- 2017.03.19 M 6.0 Solomon Islands
- 2017.03.05 M 6.5 New Britain
- 2017.01.22 M 7.9 Bougainville
- 2017.01.03 M 6.9 Fiji
- 2016.12.17 M 7.9 Bougainville
- 2016.12.08 M 7.8 Solomons
- 2016.10.17 M 6.9 New Britain
- 2016.10.15 M 6.4 South Bismarck Sea
- 2016.09.14 M 6.0 Solomon Islands
- 2016.08.31 M 6.7 New Britain
- 2016.08.12 M 7.2 New Hebrides Update #2
- 2016.08.12 M 7.2 New Hebrides Update #1
- 2016.08.12 M 7.2 New Hebrides
- 2016.04.06 M 6.9 Vanuatu Update #1
- 2016.04.03 M 6.9 Vanuatu
- 2015.03.30 M 7.5 New Britain (Update #5)
- 2015.03.30 M 7.5 New Britain (Update #4)
- 2015.03.29 M 7.5 New Britain (Update #3)
- 2015.03.29 M 7.5 New Britain (Update #2)
- 2015.03.29 M 7.5 New Britain (Update #1)
- 2015.03.29 M 7.5 New Britain
- 2015.11.18 M 6.8 Solomon Islands
- 2015.05.24 M 6.8, 6.8, 6.9 Santa Cruz Islands
- 2015.05.05 M 7.5 New Britain
New Britain | Solomon | Bougainville | New Hebrides | Tonga | Kermadec Earthquake Reports
General Overview
Earthquake Reports
Social Media
- Frisch, W., Meschede, M., Blakey, R., 2011. Plate Tectonics, Springer-Verlag, London, 213 pp.
- Hayes, G., 2018, Slab2 – A Comprehensive Subduction Zone Geometry Model: U.S. Geological Survey data release, https://doi.org/10.5066/F7PV6JNV.
- Holt, W. E., C. Kreemer, A. J. Haines, L. Estey, C. Meertens, G. Blewitt, and D. Lavallee (2005), Project helps constrain continental dynamics and seismic hazards, Eos Trans. AGU, 86(41), 383–387, , https://doi.org/10.1029/2005EO410002. /li>
- Jessee, M.A.N., Hamburger, M. W., Allstadt, K., Wald, D. J., Robeson, S. M., Tanyas, H., et al. (2018). A global empirical model for near-real-time assessment of seismically induced landslides. Journal of Geophysical Research: Earth Surface, 123, 1835–1859. https://doi.org/10.1029/2017JF004494
- Kreemer, C., J. Haines, W. Holt, G. Blewitt, and D. Lavallee (2000), On the determination of a global strain rate model, Geophys. J. Int., 52(10), 765–770.
- Kreemer, C., W. E. Holt, and A. J. Haines (2003), An integrated global model of present-day plate motions and plate boundary deformation, Geophys. J. Int., 154(1), 8–34, , https://doi.org/10.1046/j.1365-246X.2003.01917.x.
- Kreemer, C., G. Blewitt, E.C. Klein, 2014. A geodetic plate motion and Global Strain Rate Model in Geochemistry, Geophysics, Geosystems, v. 15, p. 3849-3889, https://doi.org/10.1002/2014GC005407.
- Meyer, B., Saltus, R., Chulliat, a., 2017. EMAG2: Earth Magnetic Anomaly Grid (2-arc-minute resolution) Version 3. National Centers for Environmental Information, NOAA. Model. https://doi.org/10.7289/V5H70CVX
- Müller, R.D., Sdrolias, M., Gaina, C. and Roest, W.R., 2008, Age spreading rates and spreading asymmetry of the world’s ocean crust in Geochemistry, Geophysics, Geosystems, 9, Q04006, https://doi.org/10.1029/2007GC001743
- Pagani,M. , J. Garcia-Pelaez, R. Gee, K. Johnson, V. Poggi, R. Styron, G. Weatherill, M. Simionato, D. Viganò, L. Danciu, D. Monelli (2018). Global Earthquake Model (GEM) Seismic Hazard Map (version 2018.1 – December 2018), DOI: 10.13117/GEM-GLOBAL-SEISMIC-HAZARD-MAP-2018.1
- Silva, V ., D Amo-Oduro, A Calderon, J Dabbeek, V Despotaki, L Martins, A Rao, M Simionato, D Viganò, C Yepes, A Acevedo, N Horspool, H Crowley, K Jaiswal, M Journeay, M Pittore, 2018. Global Earthquake Model (GEM) Seismic Risk Map (version 2018.1). https://doi.org/10.13117/GEM-GLOBAL-SEISMIC-RISK-MAP-2018.1
- Zhu, J., Baise, L. G., Thompson, E. M., 2017, An Updated Geospatial Liquefaction Model for Global Application, Bulletin of the Seismological Society of America, 107, p 1365-1385, https://doi.org/0.1785/0120160198
- Baldwin, S.L., Fitzgerald, P.G., and Webb, L.E., 2012, Tectonics of the New Guinea Region, Annu. Rev. Earth Planet. Sci., v. 40, pp. 495-520.
- Benz, H.M., Herman, M., Tarr, A.C., Hayes, G.P., Furlong, K.P., Villaseñor, A., Dart, R.L., and Rhea, S., 2011. Seismicity of the Earth 1900–2010 New Guinea and vicinity: U.S. Geological Survey Open-File Report 2010–1083-H, scale 1:8,000,000.
- Bird, P., 2003. An updated digital model of plate boundaries in Geochemistry, Geophysics, Geosystems, v. 4, doi:10.1029/2001GC000252, 52 p.
- Geist, E.L., and Parsons, T., 2005, Triggering of tsunamigenic aftershocks from large strike-slip earthquakes: Analysis of the November 2000 New Ireland earthquake sequence: Geochemistry, Geophysics, Geosystems, v. 6, doi:10.1029/2005GC000935, 18 p. [Download PDF (6.5 MB)]
- Hamilton, W.B., 1979. Tectonics of the Indonesian Region, USGS Professional Paper 1078.
- Hayes, G. P., D. J. Wald, and R. L. Johnson (2012), Slab1.0: A three-dimensional model of global subduction zone geometries, J. Geophys. Res., 117, B01302, doi:10.1029/2011JB008524.
- Holm, R. and Richards, S.W., 2013. A re-evaluation of arc-continent collision and along-arc variation in the Bismarck Sea region, Papua New Guinea in Australian Journal of Earth Sciences, v. 60, p. 605-619.
- Holm, R.J., Richards, S.W., Rosenbaum, G., and Spandler, C., 2015. Disparate Tectonic Settings for Mineralisation in an Active Arc, Eastern Papua New Guinea and the Solomon Islands in proceedings from PACRIM 2015 Congress, Hong Kong ,18-21 March, 2015, pp. 7.
- Holm, R.J., Rosenbaum, G, and Richards, S.W., 2016. Post 8 Ma reconstruction of Papua New Guinea and Solomon Islands: Microplate tectonics in a convergent plate boundary setting in Earth-Science Reviews, v. 156, pp. 66-81.
- Johnson, R.W., 1976, Late Cainozoic volcanism and plate tectonics at the southern margin of the Bismarck Sea, Papua New Guinea, in Johnson, R.W., ed., 1976, Volcanism in Australia: Amsterdam, Elsevier, p. 101-116
- Lay, T., and Kanamori, H., 1980, Earthquake doublets in the Solomon Islands: Physics of the Earth and Planetary Interiors, v. 21, p. 283-304.
- Schwartz, S.Y., 1999, Noncharacteristic behavior and complex recurrence of large subduction zone earthquakes: Journal of Geophysical Research, v. 104, p. 23,111-123,125.
- Schwartz, S.Y., Lay, T., and Ruff, L.J., 1989, Source process of the great 1971 Solomon Islands doublet: Physics of the Earth and Planetary Interiors, v. 56, p. 294-310.
- Tregoning, P., McQueen, H., Lambeck, K., Jackson, R. Little, T., Saunders, S., and Rosa, R., 2000. Present-day crustal motion in Papua New Guinea, Earth Planets and Space, v. 52, pp. 727-730.
- USGS, 2007. Preliminary Analysis of the April 2007 Solomon Islands Tsunami, Southwest Pacific Ocean
References:
Basic & General References
Specific References
Return to the Earthquake Reports page.
- Sorted by Magnitude
- Sorted by Year
- Sorted by Day of the Year
- Sorted By Region
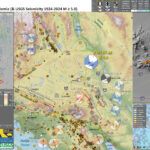
While I was travelling back from a USGS Powell Center Workshop on the recurrence of earthquakes along the Cascadia subduction zone, there was an earthquake (gempa) offshore of Sumatra. https://earthquake.usgs.gov/earthquakes/eventpage/us7000iqpn/executive There was actually a foreshock (more than one): https://earthquake.usgs.gov/earthquakes/eventpage/us7000iq2d/executive OK, sunset led to nap, led to bed. The plate boundary offshore of Sumatra, Indonesia, is a convergent (moving together) plate boundary. Here, the Australia plate subducts northwards beneath the Sunda plate (part of the Eurasia plate) along a megathrust subduction zone fault. This subduction forms a deep sea trench, the Sunda trench. This was a shallow event near the trench formed by the subduction here. The magnitude was a little small for generating a large tsunami. However, it was shallow, so the deformation reached the sea floor and generated tsunami recorded on several tide gages in the region. These gages are operated by the Indonesian Geospatial Reference System, though there are some gages that are posted on the European Union World Sea Levels website. The water surface elevation data was a little noisy on these tide gage plots, but two of them had sufficient signal to justify my interpretation that these are tsunami. My interpretations could be incorrect and I include two plots below. Many are familiar with the Boxing Day Earthquake and Tsunami from December 2004. This is one of the most deadly events in modern history, almost a quarter million people perished (mostly from the tsunami). These lives lost did lead to changes in how tsunami risk is managed worldwide. So, these lives lost were not lost in vain (though it would be better if they were not lost, we can all agree to that). The southern Sumatra subduction zone has an excellent record of prehistoric and historic earthquakes. For example, there is a couplet where earthquake slips overlapped slightly, the 1797 and 1833 earthquakes. Many think that this area is the next place a large tsunamigenic earthquake may occur. Below we can see the analysis from Chlieh et al. (2008) where they suggest that there is considerable tectonic strain accumulated since these 1797 and 1833 earthquakes. There have been several large earthquakes in this area but they may not have released this strain. If we look at the Chlieh et al. (2008) study, we will notice that this M 6.9 earthquake happened in an area thought to be in an area that is not accumulating much tectonic strain. I post a figure showing this later in the report. There are millions of people who live in the coastal lowlands of Padang who may have difficulty evacuating in time should an earthquake like the 2004 Sumatra-Andaman subduction zone earthquake were to occur in this area. For those that live along the coast here, the ground shaking from the earthquake is their natural notification to evacuate to high ground. For those that live across the ocean, they will get warning notifications to help them learn to evacuate since they won’t have the ground shaking as a warning. This is what happened to many people in December 2004 along the east coast of India and along the coast of Sri Lanka. Here are some of the larger historic earthquakes in this area, ordered by magnitude:
Sumatra core location and plate setting map with sedimentary and erosive systems figure. A. India-Australia plate subducts northeastwardly beneath the Sunda plate (part of Eurasia) at modern rates (GPS velocities are based on regional modeling of Bock et al, 2003 as plotted in Subarya et al., 2006). Historic earthquake ruptures (Bilham, 2005; Malik et al., 2011) are plotted in orange. 2004 earthquake and 2005 earthquake 5 meter slip contours are plotted in orange and green respectively (Chlieh et al., 2007, 2008). Bengal and Nicobar fans cover structures of the India-Australia plate in the northern part of the map. RR0705 cores are plotted as light blue. SRTM bathymetry and topography is in shaded relief and colored vs. depth/elevation (Smith and Sandwell, 1997). B. Schematic illustration of geomorphic elements of subduction zone trench and slope sedimentary settings. Submarine channels, submarine canyons, dune fields and sediment waves, abyssal plain, trench axis, plunge pool, apron fans, and apron fan channels are labeled here. Modified from Patton et al. (2013 a).
Map of Southeast Asia showing recent and selected historical ruptures of the Sunda megathrust. Black lines with sense of motion are major plate-bounding faults, and gray lines are seafloor fracture zones. Motions of Australian and Indian plates relative to Sunda plate are from the MORVEL-1 global model [DeMets et al., 2010]. The fore-arc sliver between the Sunda megathrust and the strike-slip Sumatran Fault becomes the Burma microplate farther north, but this long, thin strip of crust does not necessarily all behave as a rigid block. Sim = Simeulue, Ni = Nias, Bt = Batu Islands, and Eng = Enggano. Brown rectangle centered at 2°S, 99°E delineates the area of Figure 3, highlighting the Mentawai Islands. Figure adapted from Meltzner et al. [2012] with rupture areas and magnitudes from Briggs et al. [2006], Konca et al. [2008], Meltzner et al. [2010], Hill et al. [2012], and references therein.
Recent and ancient ruptures along the Mentawai section of the Sunda megathrust. Colored patches are surface projections of 1-m slip contours of the deep megathrust ruptures on 12–13 September 2007 (pink to red) and the shallow rupture on 25 October 2010 (green). Dashed rectangles indicate roughly the sections that ruptured in 1797 and 1833. Ancient ruptures are adapted from Natawidjaja et al. [2006] and recent ones come from Konca et al. [2008] and Hill et al. (submitted manuscript, 2012). Labeled points indicate coral study sites Sikici (SKC), Pasapuat (PSP), Simanganya (SMY), Pulau Pasir (PSR), and Bulasat (BLS).
Distribution of coupling on the Sumatra megathrust derived from the formal inversion of the coral and of the GPS data (Tables 2, 3, and 4) prior to the 2004 Sumatra-Andaman earthquake (model I-a in Table 7). (a) Distribution of coupling on the megathrust. Fully coupled areas are red, and fully creeping areas are white. Three strongly coupled patches are revealed beneath Nias island, Siberut island, and Pagai island. The annual moment deficit rate corresponding to that model is 4.0 X 10^20 N m/a. (b) Observed (black vectors) and predicted (red vectors) horizontal velocities appear. Observed and predicted vertical displacements are shown by color-coded large and small circles, respectively. The Xr^2 of this model is 3.9 (Table 7).
Distribution of coupling on the Sumatra megathrust derived from the formal inversion of the horizontal velocities and uplift rates derived from the CGPS measurements at the SuGAr stations (processed at SOPAC). To reduce the influence of postseismic deformation caused by the March 2005 Nias-Simeulue rupture, velocities were determined for the period between June 2005 and October 2006. (a) Distribution of coupling on the megathrust. Fully coupled areas are red and fully creeping areas are white. This model reveals strong coupling beneath the Mentawai Islands (Siberut, Sipora, and Pagai islands), offshore Padang city, and suggests that the megathrust south of Bengkulu city is creeping at the plate velocity. (b) Comparison of observed (green) and predicted (red) velocities. The Xr^2 associated to that model is 24.5 (Table 8).
Distribution of coupling on the Sumatra megathrust derived from the formal inversion of all the data (model J-a, Table 8). (a) Distribution of coupling on the megathrust. Fully coupled areas are red, and fully creeping areas are white. This model shows strong coupling beneath Nias island and beneath the Mentawai (Siberut, Sipora and Pagai) islands. The rate of accumulation of moment deficit is 4.5 X 10^20 N m/a. (b) Comparison of observed (black arrows for pre-2004 Sumatra-Andaman earthquake and green arrows for post-2005 Nias earthquake) and predicted velocities (in red). Observed and predicted vertical displacements are shown by color-coded large and small circles (for the corals) and large and small diamonds (for the CGPS), respectively. The Xr^2 of this model is 12.8.
Comparison of interseismic coupling along the megathrust with the rupture areas of the great 1797, 1833, and 2005 earthquakes. The southernmost rupture area of the 2004 Sumatra-Andaman earthquake lies north of our study area and is shown only for reference. Epicenters of the 2007 Mw 8.4 and Mw 7.9 earthquakes are also shown for reference. (a) Geometry of the locked fault zone corresponding to forward model F-f (Figure 6c). Below the Batu Islands, where coupling occurs in a narrow band, the largest earthquake for the past 260 years has been a Mw 7.7 in 1935 [Natawidjaja et al., 2004; Rivera et al., 2002]. The wide zones of coupling, beneath Nias, Siberut, and Pagai islands, coincide well with the source of great earthquakes (Mw > 8.5) in 2005 from Konca et al. [2007] and in 1797 and 1833 from Natawidjaja et al. [2006]. The narrow locked patch beneath the Batu islands lies above the subducting fossil Investigator Fracture Zone. (b) Distribution of interseismic coupling corresponding to inverse model J-a (Figure 10). The coincidence of the high coupling area (orange-red dots) with the region of high coseismic slip during the 2005 Nias-Simeulue earthquake suggests that strongly coupled patches during interseismic correspond to seismic asperities during megathrust ruptures. The source regions of the 1797 and 1833 ruptures also correlate well with patches that are highly coupled beneath Siberut, Sipora, and Pagai islands.
Latitudinal distributions of seismic moment released by great historical earthquakes and of accumulated deficit of moment due to interseismic locking of the plate interface. Values represent integrals over half a degree of latitude. Accumulated interseismic deficits since 1797, 1833, and 1861 are based on (a) model F-f and (b) model J-a. Seismic moments for the 1797 and 1833 Mentawai earthquakes are estimated based on the work by Natawidjaja et al. [2006], the 2005 Nias-Simeulue earthquake is taken from Konca et al. [2007], and the 2004 Sumatra-Andaman earthquake is taken from Chlieh et al. [2007]. Postseismic moments released in the month that follows the 2004 earthquake and in the 11 months that follows the Nias-Simeulue 2005 earthquake are shown in red and green, respectively, based on the work by Chlieh et al. [2007] and Hsu et al. [2006].
Free-air gravity anomaly map derived from satellite altimetry [Sandwell and Smith, 2009] over the Wharton Basin area.
Structure and age of the Wharton Basin deduced from free-air gravity anomaly [Sandwell and Smith, 2009; background colors] for the fracture zones (thin black longitudinal lines), and marine magnetic anomaly profiles (not shown) for the isochrons (thin black latitudinal lines). The plain colors represent the oceanic lithosphere created during normal geomagnetic polarity intervals (see legend for the ages of Chrons 20 to 34 according to the time scale of Gradstein et al. [2004]). Compartments separated by major fracture zones are labeled A to H. Grey areas: oceanic plateaus, thick black line: Sunda Trench subduction zone.
Reconstitution of the subducted magnetic isochrons and fracture zones of the northern Wharton Basin using the finite rotation parameters deduced from our two- and three-plate reconstructions. (a) First the geometry is restored on the Earth surface, then (b) it is draped on the top of the subducting plate as derived from seismic tomography [Pesicek et al., 2010] shown by the thin dotted lines at intervals of 100 km (b). Colored dots: identified magnetic anomalies; colored triangles: rotated magnetic anomalies, solid lines; observed fracture zones and isochrons, dashed lines: uncertain or reconstructed fracture zones, dotted lines: reconstructed isochrons from rotated magnetic anomalies (two-plate and three-plate reconstructions), colored area: oceanic lithosphere created during normal geomagnetic polarity intervals (see legend for the ages; the colored areas without solid or dotted lines have been interpolated), grey areas: oceanic plateaus, thick line: Sunda Trench subduction zone.
The deviation of the Sunda Trench from a regular arc shape (dotted lines) off Sumatra is explained by the presence of the younger, hotter and therefore lighter lithosphere in compartments C–F, which resists subduction and form an indentor (solid line). The very young compartment G was probably part of this indentor before oceanic crust formed at slow spreading rate near the Wharton fossil spreading center approached subduction: The weaker rheology of outcropping or shallow serpentinite may have favored the restoration of the accretionary prism in this area. Further south, the deviation off Java is explained by the resistance of the thicker Roo Rise, an oceanic plateau entering the subduction.
Annual probability of experiencing a tsunami with a height at the coast of (a) 0.5m (a tsunami warning) and (b) 3m (a major tsunami warning).
EarthquakeReport for M6.9 #Gempa #Earthquake offshore of #Sumatra #Indonesia Appears to be on the megathrust subduction zone fault Read more about the regional tectonics herehttps://t.co/sjXP2RmtVuhttps://t.co/bglPVLQUDt pic.twitter.com/KSdUDVh9HD — Jason "Jay" R. Patton (@patton_cascadia) November 18, 2022 #EarthquakeReport for M 6.9 #Gempa #Earthquake offshore of #Sumatra #Indonesia appears to be a megathrust subduction zone fault earthquake generated a small tsunami recorded on tide gages read more here:https://t.co/KKizpqJuSa pic.twitter.com/W4gCCJ9bKY — Jason "Jay" R. Patton (@patton_cascadia) November 20, 2022 #EarthquakeReport for M 6.9 #Gempa #Earthquake offshore of #Sumatra #Indonesia probably slip along megathrust subduction zone where Chlieh modeled low seismogenic coupling https://t.co/nuGY5m9iGD *in area absent of GPS/microatoll data read more here:https://t.co/KKizpqsrQa pic.twitter.com/oZP5u7JgiK — Jason "Jay" R. Patton (@patton_cascadia) November 20, 2022 #EarthquakeReport #TsunamiReport for M 6.9 #Gempa #Earthquake offshore of #Sumatra #Indonesia Cocos Isle gage updated due to twitter peer review from @Harold_Tobin thanks! also added Bintuhan record interp poster and plots updated in report herehttps://t.co/KKizpqsrQa pic.twitter.com/TGgCZeA1MV — Jason "Jay" R. Patton (@patton_cascadia) November 20, 2022 Effects of the magnitude 6.9 #earthquake off #Sumatra #Indonesia was felt in my apartment over 776 km away in #Singapore. Managed to record this lamp swaying. #gempa #seismology #sismo #terremoto #geology pic.twitter.com/b1CdcxrCLm — GeoGeorge (@GeoGeorgeology) November 18, 2022 Preliminary M6.9 #Earthquake – Learn more about us at https://t.co/ojzht2DDAL – EVENT: https://t.co/WbAhjnStUl pic.twitter.com/W5SOXtMdjn — Raspberry Shake Earthquake Channel (@raspishakEQ) November 18, 2022 I love this figure by Kyle Bradley – really highlights the Mentawai Seismic Gap, a region at high risk of a large tsunamigenic earthquake offshore Sumatra. https://t.co/DJ1MSuKGVa pic.twitter.com/j8A0LjReNO — Dr. Judith Hubbard (@JudithGeology) March 18, 2022 No #tsunami threat to Australia from magnitude 6.8 #earthquake near Southwest of Sumatra, Indonesia. Latest advice at https://t.co/Tynv3Zygqi. pic.twitter.com/ISugUTXpVm — Bureau of Meteorology, Australia (@BOM_au) November 18, 2022 NO TSUNAMI THREAT! An earthquake occurred in South Sumatra region with following preliminary parameters 👇🏼 There is no tsunami threat to SL at present & coastal areas of SL are declared safe.#Tsunami #NoThreat #SriLanka #LKA pic.twitter.com/CPQMp12dqD — Department of Meteorology Sri Lanka (@SLMetDept) November 18, 2022 Earthquakes commonly occur near Sumatra, as the Indo-Australian Plate subducts under the Sunda Plate. The M6.9 earthquake occurred at a depth of 25 km, likely on the subduction interface.https://t.co/OM7bvJsmTO pic.twitter.com/NS3rGVd8hR — EarthScope Consortium (@EarthScope_sci) November 18, 2022 Surface waves from a M6.9 earthquake near Bengkulu, Indonesia at 18/11/2022 13:37:09UTC, received in the UK approximately an hour after the earthquake on @BGS and @raspishake devices. The frequency of these waves is shown on a plot from the BGS Elmsett seismometer. @rdlarter pic.twitter.com/OQkXOm5K1o — Mark Vanstone (@wmvanstone) November 19, 2022 Waves from the M6.9 earthquake southwest of Sumatra shown on a nearby station using Station Monitor. https://t.co/Tir0KZmCJF pic.twitter.com/H5AjBzaKRH — EarthScope Consortium (@EarthScope_sci) November 18, 2022 Location and First-motion mechanism: Mwp6.8 #earthquake Southwest of Sumatra, Indonesia https://t.co/kCIw9Vypa6 https://t.co/xebYrDiQ5S pic.twitter.com/May21uExD6 — Anthony Lomax 😷🇪🇺🌍🇺🇦 (@ALomaxNet) November 18, 2022 Watch the waves from the M6.9 earthquake in Sumatra, Indonesia roll across seismic stations in North America. (THREAD 🧵) pic.twitter.com/JMolvkAy4b — EarthScope Consortium (@EarthScope_sci) November 18, 2022 Global surface and body wave sections from the M6.9 earthquake southwest of Sumatra, Indonesiahttps://t.co/a0ciLbpC9x pic.twitter.com/T4HDlrwvjy — EarthScope Consortium (@EarthScope_sci) November 18, 2022 Back projection for the M6.9 earthquake southwest of Sumatra, Indonesiahttps://t.co/SLKRaU3oUA pic.twitter.com/glLYRXLj7X — EarthScope Consortium (@EarthScope_sci) November 18, 2022 Earthquakes commonly occur near Sumatra, as the Indo-Australian Plate subducts under the Sunda Plate. The M6.9 earthquake occurred at a depth of 25 km, likely on the subduction interface.https://t.co/OM7bvJsmTO pic.twitter.com/NS3rGVd8hR — EarthScope Consortium (@EarthScope_sci) November 18, 2022 Mw=6.9, SOUTHWEST OF SUMATRA, INDONESIA (Depth: 19 km), 2022/11/18 13:37:06 UTC – Full details here: https://t.co/uLuj3Ztf0a pic.twitter.com/3V9bk1wFaq — Earthquakes (@geoscope_ipgp) November 18, 2022 Preliminary M6.9 #Earthquake – Learn more about us at https://t.co/ojzht2DDAL – EVENT: https://t.co/WbAhjnStUl pic.twitter.com/W5SOXtMdjn — Raspberry Shake Earthquake Channel (@raspishakEQ) November 18, 2022
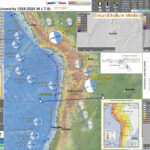
Early this morning I received some notifications of earthquakes along the Tonga trench (southwestern central Pacific Ocean). It was about 2am my local time. I work on the tsunami program for the California state tsunami program (CTP) and we respond to tsunami to (1) help local communities do their first response activities so that they can help reduce suffering and to (2) document the impact of these tsunami. Because of this work, our team is “at the ready” 24 hours a day, 7 days a week, to respond to these events. Luckily, this event was unlikely to generate a tsunami that would impact California. I went back to sleep. This morning I put together a report and checked to see if there was a tsunami generated. Here is one place that I check for tsunami records as observed on tide gages http://www.ioc-sealevelmonitoring.org/map.php. I did not see anything convincing. This earthquake, from last night my time, has a magnitude of M 7.3. https://earthquake.usgs.gov/earthquakes/eventpage/us7000ip0l/executive This area of the Earth has a plate boundary fault system called a subduction zone. A subduction zone is a convergent plate boundary, which means that the plates on either side of the boundary move towards each other. Here, the Pacific plate dives westwards beneath the Australia plate, forming the Tonga trench. Below is a schematic illustration showing what these plates may look like if we cut into the Earth and viewed this subduction zone from the side. Note the Pacific plate on the right and the Australia plate on the left, with the megathrust subduction zone fault where they meet. This illustration shows where earthquakes may happen along this plate boundary. There could be interface earthquakes along the megathrust fault (megathrust earthquakes). These are what most people are familiar with when they are thinking about tsunami (e.g., the 2011 Great East Japan Earthquake and Tsunami). In the upper plate (the Australia plate), there can be crustal fault earthquakes. In the lower plate (the Pacific plate) there can be slab earthquakes (events within the crust, aka the slab), and there can be outer rise earthquakes). The outer rise is a part of the plate that is warping up and down because of the forces adjacent to the subduction zone. This warping can cause extension in the upper part, and compression in the lower part, of this plate. This 11 Nov 2022 M 7.3 earthquake was a compressional (reverse) earthquake in the outer rise region of this plate boundary. It was pretty deep (for oceanic crust) so fits nicely in the correct place in this illustration: But megathrust earthquakes are not the only type of earthquake that can cause a tsunami. The 2009 magnitude M 8.1 extensional (normal) fault earthquake near Samoa and American Samoa caused a tsunami that inundated the nearby islands (causing lots of damage and human suffering). This tsunami also travelled across the Pacific Ocean to impact California! (This is why the California Tsunami Program monitors tsunami across the Pacific Basin, so that we can help reduce suffering through the evacuation of coastal areas. Remember, the entire coast of California is a Tsunami Hazard Area.)
Bathymetric map of the Tonga–Kermadec arc system. Map showing the depth of the subducted slab beneath the Tonga–Kermadec arc system. Louisville seamount ages are after Koppers et al.49 ELSC, eastern Lau-spreading centre; DSDP, Deep Sea Drilling Programme; NHT, Northern Havre Trough; OT, Osbourn Trough; VFR, Valu Fa Ridge. Arrows mark total convergence rates.
Earthquakes and subducted slabs beneath the Tonga–Fiji area. The subducting slab and detached slab are defined by the historic earthquakes in this region: the steeply dipping surface descending from the Tonga Trench marks the currently active subduction zone, and the surface lying mostly between 500 and 680 km, but rising to 300 km in the east, is a relict from an old subduction zone that descended from the fossil Vitiaz Trench. The locations of the mainshocks of the two Tongan earthquake sequences discussed by Tibi et al. are marked in yellow (2002 sequence) and orange (1986 series). Triggering mainshocks are denoted by stars; triggered mainshocks by circles. The 2002 sequence lies wholly in the currently subducting slab (and slightly extends the earthquake distribution in it),whereas the 1986 mainshock is in that slab but the triggered series is located in the detached slab,which apparently contains significant amounts of metastable olivine
bathymetry, and major tectonic element map of the study area. The Tonga and Vanuatu subduction systems are shown together with the locations of earthquake epicenters discussed herein. Earthquakes between 0 and 70 km depth have been removed for clarity. Remaining earthquakes are color-coded according to depth. Earthquakes located at 500–650 km depth beneath the North Fiji Basin are also shown. Plate motions for Vanuatu are from the U.S. Geological Survey, and for Tonga from Beavan et al. (2002) (see text for details). Dashed line indicates location of cross section shown in Figure 3. NFB—North Fiji Basin; HFZ—Hunter Fracture Zone.
Map showing distribution of slab segments beneath the Tonga-Vanuatu region. West-dipping Pacifi c slab is shown in gray; northeast-dipping Australian slab is shown in red. Three detached segments of Australian slab lie below the North Fiji Basin (NFB). HFZ—Hunter Fracture Zone. Contour interval is 100 km. Detached segments of Australian plate form sub-horizontal sheets located at ~600 km depth. White dashed line shows outline of the subducted slab fragments when reconstructed from 660 km depth to the surface. When all subducted components are brought to the surface, the geometry closely approximates that of the North Fiji Basin.
Previous interpretation of combined P-wave tomography and seismicity from van der Hilst (1995). Earthquake hypocenters are shown in blue. The previous interpretation of slab structure is contained within the black dashed lines. Solid red lines mark the surface of the Pacifi c slab (1), the still attached subducting Australian slab (2a), and the detached segment of the Australian plate (2b). UM—upper mantle;
Simplified plate tectonic reconstruction showing the progressive geometric evolution of the Vanuatu and Tonga subduction systems in plan view and in cross section. Initiation of the Vanuatu subduction system begins by 10 Ma. Initial detachment of the basal part of the Australian slab begins at ca. 5–4 Ma and then sinking and collision between the detached segment and the Pacifi c slab occur by 3–4 Ma. Initial opening of the Lau backarc also occurred at this time. Between 3 Ma and the present, both slabs have been sinking progressively to their current position. VT—Vitiaz trench; dER—d’Entrecasteaux Ridge.
Map of the Southwest Pacific Ocean showing the regional tectonic setting and location of the two dredged profiles. Depth contours in kilometres. The presently active arcs comprise New Zealand–Kermadec Ridge–Tonga Ridge, linked with Vanuatu by transforms associated with the North Fiji Basin. Colville Ridge–Lau Ridge is the remnant arc. Havre Trough–Lau Basin is the active backarc basin. Kermadec–Tonga Trench marks the site of subduction of Pacific lithosphere westward beneath Australian plate lithosphere. North and South Fiji Basins are marginal basins of late Neogene and probable Oligocene age, respectively. 5.4sK–Ar date of dredged basalt sample (Adams et al., 1994).
Large subduction-zone interplate earthquakes (large open gray stars) labeled with event date, Mw, GCMT focal mechanisms, and GPS velocity vectors (gray arrows and black triangles labeled with station name). GPS velocities are listed in Table 3. Black lines indicate the Tonga–Kermadec and Vanuatu trenches. Note that the 2009/09/29 Samoa–Tonga outer trench-slope event (Mw 8.1) triggered large interplate doublets (both of Mw 7.8; Lay et al., 2010). The Pacific plate subducts westward beneath the Australian plate along the Tonga–Kermadec trench, whereas the Australian plate subducts eastward beneath the Vanuatu arc and North Fiji basin. The opposite orientation between the Tonga–Kermadec and Vanuatu subduction systems is due to complex and broad back-arc extension in the Lau and North Fiji basins (Pelletier et al., 1998).
Regional map of moderate-sized (mb > 4:7) shallow-focus repeating earthquakes and background seismicity along the (a) Tonga–Kermadec and (b) Vanuatu (former New Hebrides) subduction zones. Shallow repeating earthquakes (black stars) and their available Global Centroid Moment Tensor (GCMT; Dziewoński et al., 1981; Ekström et al., 2003) are labeled with event date and doublet/cluster id where applicable. Colors of GCMT are used to distinguish nearby different repeaters. Source parameters for the clusters and doublets are listed in Tables 1 and 2. Background seismicity is shown as gray dots and large interplate earthquakes (moment magnitude, Mw > 7:3) since 1976 are shown as large open gray stars. Black lines indicate the trench (Bird, 2003) and slab contour at 50-km depth (Gudmundsson and Sambridge, 1998). Repeating earthquake clusters in the (a) T1 and T2 plate-interface regions in Tonga and (b) V3 plate-interface region in Vanuatu are used to study the fault-slip rate ( _d). A regional map of the Tonga–Kermadec–Vanuatu subduction zones is #EarthquakeReport for M 7.3 #Earthquake along outer rise near the Tonga trench reverse (compressional) mechanism south of analogues incl tsunamigenic 2009 M 8.1 (tho that was extensional)https://t.co/gQEdISt9eD learn more abt regional tectonics herehttps://t.co/eDsUON2Mly pic.twitter.com/DvMnY4rWck — Jason "Jay" R. Patton (@patton_cascadia) November 11, 2022 #EarthquakeReport for M 7.3 #Earthquake near the Tonga trench thrust (compressional) earthquake along the outer rise no #Tsunami observed on tide gages report here includes my interpretation and a regional tectonic summary:https://t.co/ze2s3bb7Vn pic.twitter.com/2M3SZaYE19 — Jason "Jay" R. Patton (@patton_cascadia) November 11, 2022 The region near todays M7.3 earthquake is incrediblely active due to the high rates of convergence between the Australian and Pacific Plates. Since 1900, 40 M7.5+ earthquakes have been recorded, as well as at least 3 M8+ events. https://t.co/avVOX0LcGH pic.twitter.com/dN9mIrwgwN — Wendy Bohon, PhD 🌏 (@DrWendyRocks) November 11, 2022 Fri Nov 11 10:48:00 2022 UTC * HAZARDOUS TSUNAMI WAVES FROM THIS EARTHQUAKE ARE POSSIBLE WITHIN 300 KM OF THE EPICENTER ALONG THE COASTS OF — よっしみ~☆🌏 (@yoshimy_s) November 11, 2022 Seismic waves from the Tonga 7.3 #earthquake, as arriving at a @raspishakEQ station of the @GEO3BCN_CSIC educational network in NE Iberia pic.twitter.com/K6YZPQf1JU — Jordi Diaz Cusi (@JDiazCusi) November 11, 2022 Recent Earthquake Teachable Moment for the M7.3 Tonga earthquake https://t.co/PJBT5jgOTy pic.twitter.com/h0kTCejygS — IRIS Earthquake Sci (@IRIS_EPO) November 11, 2022 Global surface and body wave sections from the M7.3 earthquake near Tongahttps://t.co/mz6A6vgD9F pic.twitter.com/0psyiRcDum — IRIS Earthquake Sci (@IRIS_EPO) November 11, 2022 Mw=7.3, TONGA ISLANDS REGION (Depth: 43 km), 2022/11/11 10:48:42 UTC – Full details here: https://t.co/vqxit49tby pic.twitter.com/m16qoCB5wK — Earthquakes (@geoscope_ipgp) November 11, 2022 Watch the waves from the M7.3 earthquake near Tonga roll across seismic stations in North America (THREAD 🧵) pic.twitter.com/hupVx0WfpQ — IRIS Earthquake Sci (@IRIS_EPO) November 11, 2022 Section from today's M7.3 earthquake in the Tonga region at 2022-11-11 10:48:45UTC recorded on the worldwide @raspishake network. See: https://t.co/LS1S4JlAqX. Uses @obspy and @matplotlib. pic.twitter.com/Jdz1FlEZN2 — Mark Vanstone (@wmvanstone) November 11, 2022 A cross-section of seismicity, with the focal mechanisms projected into the vertical plane, shows the three deep quakes with purple outlines. These events were close to the deepest quakes in this area, where the subducted slab possibly is deflected by the 670 km discontinuity. pic.twitter.com/V09EYGWJRd — Jascha Polet (@CPPGeophysics) November 11, 2022
I don’t always have the time to write a proper Earthquake Report. However, I prepare interpretive posters for these events. There was a magnitude M 7.6 earthquake in Mexico on 1 September 2022. https://earthquake.usgs.gov/earthquakes/eventpage/us7000i9bw/executive I am catching up on some Earthquake Reports that I did not yet post since my website was being migrated to a more secure and reliable server (and more expensive). The tectonics of coastal southwestern Mexico is dominated by the convergent plate boundary between the Cocos plate (to the southwest) and the North America plate (to the northeast). Here, the Cocos plate subducts below (goes underneath) the North America plate. The fault between these plates is called a megathrust subduction zone fault and the plate boundary forms the Middle America trench. This M 7.6 earthquake mechanism (the “moment tensor”) shows that this event was a compressional earthquake (reverse or thrust). Based on it’s location, the event probably happened along the megathrust fault. This earthquake even generated a tsunami recorded on tide gages in the region!
Development of the Tepic–Zacoalco (TZ), Colima, and Chapala rifts. The TZ rift is formed by the Rivera slab rollback, enhanced by the toroidal flow around the slab edges. The Colima rift is probably related with the oblique convergence between Rivera and NAM plates at ~5 Ma.
Tectonic setting of the Caribbean Plate. Grey rectangle shows study area of Fig. 2. Faults are mostly from Feuillet et al. (2002). PMF, Polochic–Motagua faults; EF, Enriquillo Fault; TD, Trinidad Fault; GB, Guatemala Basin. Topography and bathymetry are from Shuttle Radar Topography Mission (Farr&Kobrick 2000) and Smith & Sandwell (1997), respectively. Plate velocities relative to Caribbean Plate are from Nuvel1 (DeMets et al. 1990) for Cocos Plate, DeMets et al. (2000) for North America Plate and Weber et al. (2001) for South America Plate.
A. Geodynamic and tectonic setting alongMiddle America Subduction Zone. JB: Jalisco Block; Ch. Rift—Chapala rift; Co. rift—Colima rift; EGG—El Gordo Graben; EPR: East Pacific Rise; MCVA: Modern Chiapanecan Volcanic Arc; PMFS: Polochic–Motagua Fault System; CR—Cocos Ridge. Themain Quaternary volcanic centers of the TransMexican Volcanic Belt (TMVB) and the Central American Volcanic Arc (CAVA) are shown as blue and red dots, respectively. B. 3-D view of the Pacific, Rivera and Cocos plates’ bathymetrywith geometry of the subducted slab and contours of the depth to theWadati–Benioff zone (every 20 km). Grey arrows are vectors of the present plate convergence along theMAT. The red layer beneath the subducting plate represents the sub-slab asthenosphere.
Marine magnetic anomalies and fracture zones that constrain tectonic reconstructions such as those shown in Figure 4 (ages of anomalies are keyed to colors as explained in the legend; all anomalies shown are from University of Texas Institute for Geophysics PLATES [2000] database): (1) Boxed area in solid blue line is area of anomaly and fracture zone picks by Leroy et al. (2000) and Rosencrantz (1994); (2) boxed area in dashed purple line shows anomalies and fracture zones of Barckhausen et al. (2001) for the Cocos plate; (3) boxed area in dashed green line shows anomalies and fracture zones from Wilson and Hey (1995); and (4) boxed area in red shows anomalies and fracture zones from Wilson (1996). Onland outcrops in green are either the obducted Cretaceous Caribbean large igneous province, including the Siuna belt, or obducted ophiolites unrelated to the large igneous province (Motagua ophiolites). The magnetic anomalies and fracture zones record the Cenozoic relative motions of all divergent plate pairs infl uencing the Central American subduction zone (Caribbean, Nazca, Cocos, North America, and South America). When incorporated into a plate model, these anomalies and fracture zones provide important constraints on the age and thickness of subducted crust, incidence angle of subduction, and rate of subduction for the Central American region. MCSC—Mid-Cayman Spreading Center.
Rupture zones (ellipses) and epicenters (triangles and circles) of large shallow earthquakes (after KELLEHER et al., 1973) and bathymetry (CHASE et al., 1970) along the Middle America arc. Note that six gaps which have earthquake histories have not ruptured for 40 years or more. In contrast, the gap near the intersection of the Tehuantepec ridge has no known history of large shocks. Contours are in fathoms.
The study area encompasses Guerrero and Oaxaca states of Mexico. Shaded ellipse-like areas annotated with the years are rupture areas of the most recent major thrust earthquakes (M≥6.5) in the Mexican subduction zone. Triangles show locations of permanent GPS stations. Small hexagons indicate campaign GPS sites. Arrows are the Cocos-North America convergence vectors from NUVEL-1A model (DeMets et al., 1994). Double head arrow shows the extent of the Guerrero seismic gap. Solid and dashed curves annotated with negative numbers show the depth in km down to the surface of subducting Cocos plate (modified from Pardo and Su´arez, 1995, using the plate interface configuration model for the Central Oaxaca from this study, the model for Guerrero from Kostoglodov et al. (1996), and the last seismological estimates in Chiapas by Bravo et al. (2004). MAT, Middle America trench.
FOS = Resisting Force / Driving Force #EarthquakeReport for the M 7.6 (likely) subduction zone #Earthquake in #Mexico on 19 Sept 2022 catching up on reports that happened after my website went down generated 0.6-1.7m wave height #Tsunami — Jason "Jay" R. Patton (@patton_cascadia) November 9, 2022
I don’t always have the time to write a proper Earthquake Report. However, I prepare interpretive posters for these events. Because of this, I present Earthquake Report Lite. (but it is more than just water, like the adult beverage that claims otherwise). I will try to describe the figures included in the poster, but sometimes I will simply post the poster here. https://earthquake.usgs.gov/earthquakes/eventpage/us7000ilwt/executive This is possibly one of the most mysterious earthquakes of the year. I forgot to write this up at the time so need to fill in more details after I am done working up my annual summary.
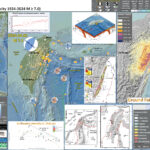
I don’t always have the time to write a proper Earthquake Report. However, I prepare interpretive posters for these events. There was a magnitude M 6.9 earthquake in Taiwan on 18 September 2022. https://earthquake.usgs.gov/earthquakes/eventpage/us7000i90q/executive Taiwan is an interesting place, from a tectonic perspective. There is an intersection of several plate boundary fault systems here. Along the western boundary of Taiwan the Eurasia plate subducts (dives beneath) the Philippine Sea plate forming the Manila trench. This megathrust subduction zone fault system terminates somewhere in central-northern Taiwan. Intersecting central Taiwan from the east is another subduction zone where the Philippine Sea plate subducts beneath the Eurasia plate, forming the Ryukyu trench. There was an earthquake in Taiwan in 1999 that has been commemorated by creating a park and museum that preserves some of the evidence of the earthquake. This Chi-Chi earthquake cause lots of damage and, sadly, lots of suffering. In addition, because of the dominance of the computer chip manufacturing industry in Taiwan at the time, the price of computer chips was greatly inflated. The global economy suffered following this earthquake. This 18 September 2022 M 6.9 earthquake occurred on a crustal fault that strikes (trends) parallel to the coast. Because of the mapped faults, I interpret this to have been a left-lateral strike slip earthquake. There was a foreshock, a mag M 6.5 earthquake, nearby, the day before.
Geologic map of the Coastal Range on shaded relief (after Wang and Chen, 1993). The Longitudinal Valley Fault (LVF) can be subdivided into the Linding and Juisui locked Fault and the Chihshang and Lichi creeping Fault. Vertical cross-sections of VS perturbation tomography along the AeA0 and BeB0 profiles denote the Central Range, the Coastal Range, and the LVF. EU: Eurasian Plate; PH: Philippine Sea Plate.
A neotectonic snapshot of Taiwan and adjacent regions. (a) Taiwan is currently experiencing a double suturing. In the south the Luzon volcanic arc is colliding with the Hengchun forearc ridge, which is, in turn, colliding with the Eurasian continental margin. In the north both sutures are unstitching. Their disengagement is forming both the Okinawa Trough and the forearc basins of the Ryukyu arc. Thus, in the course of passing through the island, the roles of the volcanic arc and forearc ridge flip along with the flipping of the polarity of subduction. The three gray strips represent the three lithospheric pieces of Taiwan’s tandem suturing and disarticulation: the Eurasian continental margin, the continental sliver, and the Luzon arc. Black arrows indicate the suturing and disarticulation. This concept is discussed in detail by Shyu et al. [2005]. Current velocity vector of the Philippine Sea plate relative to the Eurasian plate is adapted from Yu et al. [1997, 1999]. Current velocity vector of the Ryukyu arc is adapted from Lallemand and Liu [1998]. Black dashed lines are the northern and western limits of the Wadati-Benioff zone of the two subducting systems, taken from the seismicity database of the Central Weather Bureau, Taiwan. DF, deformation front; LCS, Lishan-Chaochou suture; LVS, Longitudinal Valley suture; WF, Western Foothills; CeR, Central Range; CoR, Coastal Range; HP, Hengchun Peninsula. (b) Major tectonic elements around Taiwan. Active structures identified in this study are shown in red. Major inactive faults that form the boundaries of tectonic elements are shown in black: 1, Chiuchih fault; 2, Lishan fault; 3, Laonung fault; 4, Chukou fault. Selected GPS vectors relative to the stable Eurasian continental shelf are adapted from Yu et al. [1997]. A,Western Foothills; B, Hsueshan Range; C, Central Range and Hengchun Peninsula; D, Coastal Range; E, westernmost Ryukyu arc; F, Yaeyama forearc ridge; G, northernmost Luzon arc; H, western Taiwan coastal plains; I, Lanyang Plain; J, Pingtung Plain; K, Longitudinal Valley; L, submarine Hengchun Ridge; M, Ryukyu forearc basins.
Map of major active faults and folds of Taiwan (in red) showing that the two sutures are producing separate western and eastern neotectonic belts. Each collision belt matures and then decays progressively from south to north. This occurs in discrete steps, manifested as seven distinct neotectonic domains along the western belt and four along the eastern. A distinctive assemblage of active structures defines each domain. For example, two principal structures dominate the Taichung Domain. Rupture in 1999 of one of these, the Chelungpu fault, caused the disastrous Chi-Chi earthquake. The Lishan fault (dashed black line) is the suture between forearc ridge and continental margin. Thick light green and pink lines are boundaries of domains.
Proposed major sources for future large earthquakes in and around Taiwan. Thick red lines are proposed future ruptures, and the white patches are rupture planes projected to the surface. Here we have selected only a few representative scenarios from Table 1. Earthquake magnitude of each scenario is predicted value from our calculation.
#EarthquakeReport for M 6.9 #Earthquake in Taiwan on 18 September 2022 there was lots of damage and some casualties :-( landslides and liquefaction models show that there was a high likelihood for these.https://t.co/3tzXgvQl26 damage informationhttps://t.co/I95RUCSWkh pic.twitter.com/TPKL95vqHI — Jason "Jay" R. Patton (@patton_cascadia) November 9, 2022
I was travelling to southern California to attend the annual meeting for the Southern California Earthquake Center. This was the first in person meeting since 2019, my first SCEC meeting. I had landed and was waiting for the luggage to arrive when I saw the CSEM earthquake app notification that there was a large earthquake in Papua New Guinea (PNG). I put together a quick tweet before anything was posted on the USGS earthquake page other than the location and depth. When I got to my hotel room later, more information was up. However, due to some problems with Dreamhost (my website hosting company), I am migrating to a different company. For a little while, parts of this website (like the links and the images) will be non-functional. I will not be using Dreamhost again. I don’t have any more to say about this since they have not returned any of my emails in over a week, basically abandoning my website in the middle of the night without any warning. https://earthquake.usgs.gov/earthquakes/eventpage/us6000iitd/executive The depth increased to about 90 km and has a normal-oblique sense of motion. This means that the earthquake was the result of a combination of extension (stretching) and strike-slip. This area is a complicated region from a tectonic perspective. There are old faults and old plate boundaries that may no longer be active and there are known active faults that juxtapose these older structures. For example, there is a convergent (moving together) plate boundary fault system on the north side of Papua New Guinea. This ‘subduction zone’ formed a deep sea trench called the New Guinea trench, where the Caroline plate subducted south beneath Papua New Guinea. This plate boundary fault system is thought to be inactive on the west side of the island and active, but with a slow convergence rate, on the eastern side of the island. Then, to the southeast of PNG, there is a deep sea trench formed by the subduction of the Australia plate diving to the north beneath the island. This fault is inactive offshore and turns into the Papua fold and thrust belt (PFTB) onshore. The PFTB onshore is inactive in the western part of the island and has a slow convergence rate on the eastern side of the island. On 25 February 2018 there was a M 7.5 earthquake associated with the PFTB. Here is the earthquake report for that earthquake. Between these two subduction zones, that dip in opposite directions, are several large strike-slip fault systems, which also have varying levels of activity. “Yesterday’s” M 7.6 occurred in one of the plates that is/was being subducted. It was probably in the Australia plate that dives beneath PNG (which is responsible for the PFTB). I updated this page a bit on 13 March 2023 and make some corrections. I note these changes below.
Topography, bathymetry and regional tectonic setting of New Guinea and Solomon Islands. Arrows indicate rate and direction of plate motion of the Australian and Pacific plates (MORVEL, DeMets et al., 2010); Mamberamo thrust belt, Indonesia (MTB); North Fiji Basin (NFB)
Tectonic map of New Guinea, adapted from Hamilton (1979), Cooper and Taylor (1987), Dow et al. (1988), and Sapiie et al. (1999). AFTB—Aure fold and thrust belt, FTB—fold-and-thrust belt, IOB—Irian Ophiolite Belt, TFB—thrust-and-fold belt, POB—Papuan Ophiolite Belt, BTFZ—Bewani-Torricelli fault zone, MDZ—Mamberamo deformation zone, YFZ—Yapen fault zone, SFZ—Sorong fault zone, WO—Weyland overthrust. Continental basement exposures are concentrated along the southern fl ank of the Central Range: BD—Baupo Dome, MA—Mapenduma anticline, DM—Digul monocline, IDI—Idenberg Inlier, MUA—Mueller anticline, KA—Kubor anticline, LFTB—Legguru fold-and-thrust belt, RMFZ—Ramu-Markham fault zone, TAFZ—Tarera-Aiduna fault zone. The Tasman line separates continental crust that is Paleozoic and younger to the east from Precambrian to the west.
Lithospheric-scale cross section at 2 Ma. Plate motion is now focused along the Yapen fault zone in the center of the recently extinct arc. This probably occurred because this zone of weakness had a trend that could accommodate the imposed movements as the corner of the Caroline microplate ruptured, forming the Bismarck plate, and the corner of the Australian plate ruptured, forming the Solomon microplate. The collisional delamination-generated magmatic event ends in the highlands as the lower crustal magma chamber solidifies. Upwelled asthenosphere cools and transforms into lithospheric mantle. This drives a slow regional subsidence of the highlands that will continue for tens of millions of years or until other plate-tectonic movements are initiated. Deep erosion is still concentrated on the fl anks of the mountain belt. RMB—Ruffaer Metamorphic Belt, AUS—Australian plate, PAC—Pacific plate.
Seismotectonic interpretation of New Guinea. Tectonic features: PTFB—Papuan thrust-and-fold belt; RMFZ—Ramu-Markham fault zone; BTFZ—Bewani-Torricelli fault zone; MTFB—Mamberamo thrust-and-fold belt; SFZ—Sorong fault zone; YFZ—Yapen fault zone; RFZ—Ransiki fault zone; TAFZ—Tarera-Aiduna fault zone; WT—Waipona Trough. After Sapiie et al. (1999).
Topography, bathymetry and major tectonic elements of the study area. (a) Major tectonic boundaries of Papua New Guinea and the western Solomon Islands; CP, Caroline plate; MB, Manus Basin; NBP, North Bismarck plate; NBT, New Britain trench; NGT, New Guinea trench; NST, North Solomon trench; PFTB, Papuan Fold and Thrust Belt; PT, Pocklington trough; RMF, Ramu-Markham Fault; SBP, South Bismarck plate; SCT, San Cristobal trench; SS, Solomon Sea plate; TT, Trobriand trough; WB,Woodlark Basin; WMT,West Melanesian trench. Study area is indicated by rectangle labelled Figure 1b; the other inset rectangle highlights location for subsequent figures. Present day GPS motions of plates are indicated relative to the Australian plate (from Tregoning et al. 1998, 1999; Tregoning 2002; Wallace et al. 2004). (b) Detailed topography, bathymetry and structural elements significant to the South Bismarck region (terms not in common use are referenced); AFB, Aure Fold Belt (Davies 2012); AT, Adelbert Terrane (e.g. Wallace et al. 2004); BFZ, Bundi Fault Zone (Abbott 1995); BSSL, Bismarck Sea Seismic Lineation; CG, Cape Gloucester; FT, Finisterre Terrane; GF, Gogol Fault (Abbott 1995); GP, Gazelle Peninsula; HP, Huon Peninsula; MB, Manus Basin; NB, New Britain; NI, New Ireland; OSF, Owen Stanley Fault; RMF, Ramu-Markham Fault; SS, Solomon Sea; WMR, Willaumez-Manus Rise (Johnson et al. 1979); WT, Wonga Thrust (Abbott et al. 1994); minor strike-slip faults are shown adjacent to Huon Peninsula (Abers & McCaffrey 1994) and in east New Britain, the Gazelle Peninsula (e.g. Madsen & Lindley 1994). Circles indicate centres of Quaternary volcanism of the Bismarck arc. Filled triangles indicate active thrusting or subduction, empty triangles indicate extinct or negligible thrusting or subduction.
3-D model of the Solomon slab comprising the subducted Solomon Sea plate, and associated crust of the Woodlark Basin and Australian plate subducted at the New Britain and San Cristobal trenches. Depth is in kilometres; the top surface of the slab is contoured at 20 km intervals from the Earth’s surface (black) to termination of slabrelated seismicity at approximately 550 km depth (light brown). Red line indicates the locations of the Ramu-Markham Fault (RMF)–New Britain trench (NBT)–San Cristobal trench (SCT); other major structures are removed for clarity; NB, New Britain; NI, New Ireland; SI, Solomon Islands; SS, Solomon Sea; TLTF, Tabar–Lihir–Tanga–Feni arc. See text for details.
Forward tectonic reconstruction of progressive arc collision and accretion of New Britain to the Papua New Guinea margin. (a) Schematic forward reconstruction of New Britain relative to Papua New Guinea assuming continued northward motion of the Australian plate and clockwise rotation of the South Bismarck plate. (b) Cross-sections illustrate a conceptual interpretation of collision between New Britain and Papua New Guinea.
UPDATE: 2023.03.13
Panel A: Distribution of mapped magmatic rock units (from Australian Bureau of Mineral Resources (1972)) and major tectonic boundaries of central Papua New Guinea. Published K/Ar (white boxes) and U–Pb ages (grey boxes) for Late Cenozoic magmatic rocks are from Page and McDougall (1972), Grant and Nielsen (1975), Page (1976), Whalen et al. (1982), Rogerson and Williamson (1985), Richards and McDougall (1990), and van Dongen et al. (2010). Panel B: Major tectonic elements of Papua New Guinea; Adelbert Terrane (AT); Aure trough (AuT); Bundi fault zone (BFZ); Bismarck Sea seismic lineation (BSSL); Fly Platform (FP); Finisterre Terrane (FT); Lagaip fault zone (LFZ); Manus Basin (MB); New Britain (NB); New Britain trench (NBT); New Guinea trench (NGT); North Sepik arc (NSA); Owen Stanley fault zone (OSFZ); Papuan Fold and Thrust Belt (PFTB); Papuan Peninsula (PP); Pocklington trough (PT); Ramu–Markham fault zone (RMFZ); South Bismarck plate (SBP); Solomon Sea (SS); Trobriand trough (TT);Woodlark Basin (WB). Panel C: Regional geology of the eastern Papuan Highlands (modified from Australian Bureau of Mineral Resources (1989)).
Simplified geodynamic evolution of the Maramuni arc. Time steps represent: a) north-dipping subduction of the Pocklington Sea slab at the Pocklington trough and associated magmatism of the Maramuni arc intruding the New Guinea Mobile Belt (NGMB); b) onset of continental collision and growth of the New Guinea Orogen from ca. 12 Ma as the Australian continent enters the Pocklington trough. Collision between the Australian continent and the New Guinea Mobile Belt leads to cessation of subduction at the Pocklington trough and associated foundering and steepening of the Pocklington Sea slab in the mantle; c) continued orogenesis results from convergence between the Australian continent and New Guinea Mobile Belt, associated with under thrusting of the leading Australian continental margin at the Pocklington trough. Northward motion of the Australian plate relative to the foundering Pocklington Sea slab leads to buckling and overturning of the slab. A reduction in convergence at the Pocklington trough is accommodated by initiation of north-dipping subduction of the Solomon Sea plate beneath the Finisterre Terrane; d) lithospheric delamination of the Pocklington Sea slab some 6 m.y. after continental collision results in renewed orogenesis in the New Guinea Orogen, and HREE-depleted magmatism at Kokofimpa. Subduction of the Solomon Sea plate continues at the New Britain trench but also begins to underthrust the New Guinea Mobile Belt at the Trobriand trough (Holmet al., unpublished data); e) Maramuni arc magmatism migrates southward into the Papuan Fold and Thrust Belt. Subduction of the Solomon Sea plate at the New Britain and Trobriand subduction systems results in closure of the Solomon Sea and collision and overthrusting of the Finisterre Terrane above the New Guinea Mobile Belt. Magmatism of the West Bismarck arc begins northward of the Finisterre Terrane; and f) convergence between the Finisterre Terrane and New Guinea Mobile Belt continues at the Ramu–Markham fault. Underthrusting of the New Guinea Mobile Belt beneath the Finisterre Terrane results in crustal-derived magmatism in theWest Bismarck arc. The foundered Solomon Sea slab is laterally continuous with the present day Solomon Sea plate to the east (see Fig. 1). Present day cross-section is modified from Holm and Richards (2013).
Luckily I updated this page because I noticed that the interpretive figure below was incorrect (it was for a different earthquake). Luckily I updated this page because I noticed that the interpretive figure below was incorrect (it was for a different earthquake). FOS = Resisting Force / Driving Force #EarthquakeReport for M7.6 #Gempa #Earthquake in #PapuaNewGuinea Strong shaking, hi chance for damage, casualties, landslides, and liquefaction Hopefully there is not much suffering https://t.co/qv9dci3yu0 pic.twitter.com/Mc3HjtGgQS — Jason "Jay" R. Patton (@patton_cascadia) September 11, 2022 #EarthquakeReport for M 7.6 #Gempa #Sismo #Earthquake in #PapuaNewGuinea possibly in Australia plate slab analogous events earthjay website is down as i migrate to aws away from dreamhosthttps://t.co/M8yFwXgiI2 pic.twitter.com/EFSqVdTKKM — Jason "Jay" R. Patton (@patton_cascadia) September 11, 2022 — Jason "Jay" R. Patton (@patton_cascadia) September 11, 2022 Hoping Kainantu is OK. Scenes from Madang #earthquake pic.twitter.com/NH5oTsabHI — Chakriya Bowman (@CIPRD) September 11, 2022 🏚FUERTE #SISMO Mw7.7 con epicentro a #Morobe, #PapuaNuevaGuinea 🇵🇬 (ocurrió el 10-septiembre-2022 18:46 hrs EST) fue registrado por mi estación AM.#R69E9 ubicada en #Veraguas, #Panamá 🇵🇦 — Monitoreo Sísmico JP 🇵🇦 (@monitoreojp) September 11, 2022 About ~15 mins ago, a M7.5 near Lae, Papua New Guinea, as recorded by the @AusQuake seismograph network in southeast Australia. Reportedly at a depth of ~100 km. pic.twitter.com/SnY8WbXNeI — Dr. Dee Ninis (@DeeNinis) September 11, 2022 The waves from the M7.6 Papua New Guinea earthquake are rolling under the east coast of the US right now. (The timing makes the trace kind of hard to see.) Images from @IRIS_EPO Station Monitor. https://t.co/UGVApJ6xpu pic.twitter.com/QSMxw4mpmz — Wendy Bohon, PhD 🌏 (@DrWendyRocks) September 11, 2022 Mw=7.7, EASTERN NEW GUINEA REG., P.N.G. (Depth: 39 km), 2022/09/10 23:46:55 UTC – Full details here: https://t.co/b2drScMokg pic.twitter.com/t1empyuII5 — Earthquakes (@geoscope_ipgp) September 11, 2022 The IRIS Earthquake Browser shows the distribution of earthquakes that have occurred near this Magnitude 7.6 earthquake in Papau New Guinea ➡️https://t.co/fhm2uyCHNW pic.twitter.com/d0eVSgZUQq — IRIS Earthquake Sci (@IRIS_EPO) September 11, 2022 A dormitory building at the University of Goroka suffered moderate damage to what appears to be decorative awnings & some wall spalling & parapet collapse. Overall building seems intact, but LOTS of falling debris that could hurt or kill someone below. #PNG #earthquake pic.twitter.com/0tZCN3qA36 — Brian Olson (@mrbrianolson) September 11, 2022 🇵🇬| Papua New Guinea – Registro desde una camara de seguridad del evento sismico Mw7.7 — Seba Sismos CL (@Seba_Sismos_CL) September 11, 2022 — Elior Cohen (@Elior_C_E) September 11, 2022 #Helicopter in an #Earthquake near #Lae PNG this morning. 7.6 Magnitude pic.twitter.com/MYyi9tDetu — David Bennet (@bennetdg5454) September 11, 2022 Watch the waves from the M7.6 earthquake in Papua New Guinea roll across seismic stations in North America. 🎥 https://t.co/yHxbrJ92kh pic.twitter.com/P4mS7M1N4k — IRIS Earthquake Sci (@IRIS_EPO) September 11, 2022 View a visual explainer and more videos like this on our TikTok, Terra Explore https://t.co/tSbAKZfjif pic.twitter.com/B7pJGCRdwZ — IRIS Earthquake Sci (@IRIS_EPO) September 11, 2022 ..
There have not been that many large earthquakes this year. This is good for one main reason, there is a lower potential for human suffering. Therefore, there are fewer Earthquake Reports for this year. This morning (my time) there was a magnitude M 6.9 earthquake along the Romanche transform fault, a right-lateral strike-slip fault system that offsets the Mid Atlantic Ridge in the equatorial Atlantic Ocean. The fault is part of the Romanche fracture zone. https://earthquake.usgs.gov/earthquakes/eventpage/us7000i53f/executive The transform faults in this part of the Mid Atlantic Ridge plate boundary have a pattern of earthquakes that seem to max out in the lower 7 magnitudes. This may be (at least partly) due to the maximum length of these faults (?). The Romanche fault is about 900 kilometers long. The Chain fault is about 250 km long. The St. Paul fault is about 350 km long. Using empirical (data) based relations between earthquake subsurface rupture length and earthquake magnitude (Wells and Coppersmith, 1994), I calculate the maximum earthquake magnitude we may get on these three faults listed above. Here are the data that Wells and Coppersmith use to establish these relations.
(a) Regression of subsurface rupture length on magnitude (M). Regression line shown for all-slip-type relationship. Short dashed line indicates 95% confidence interval. (b) Regression lines for strike-slip relationships. See Table 2 for regression coefficients. Length of regression lines shows the range of data for each relationship.
Here are the magnitude estimates for each of these fault systems. Looking at the interpretive poster, we can see that there have not been any temblors that approach the sizes listed in this table. The largest historic earthquake was M 7.1 (there were several). So, we may ask ourselves one of the most common questions people ask regarding earthquakes. Was this M 6.9 a foreshock to a larger earthquake? Obviously, we cannot yet know this. Nobody can predict the future (at least not yet). However, based on the incredibly short historic record of earthquakes, we may answer this question: “no, probably not.” This answer is tempered by the very short seismic record. If magnitude 8 earthquakes occur, on average, every 1000 years, then our ~100 year record might be too short to “notice” one of these M 8 events. So, given the historic record, it sure seems likely that there may be another M6-7 earthquakes in the region of the fault sometime in the next couple of months. And, given our lack of knowledge about the long term behavior of these faults, it is also possible that there could be a larger M 8 event.
A: Multibeam topography of Romanche region, showing north-south profiles where sampling was carried out. Black dots and red numbers indicate estimated age (in million years) of lithosphere south of Romanche Transform, assuming spreading half-rate of 17 mm/yr within present-day ridge and transform geometry. White dots indicate epicenters of teleseismically recorded 1970–1995 events (magnitude . 4). FZ is fracture zone. B: Topography and petrology at eastern intersection of Romanche Fracture Zone with Mid-Atlantic Ridge. Data were obtained during expeditions S-16, S-19, and G-96 (Bonatti et al., 1994, 1996). C: Location of A along Mid-Atlantic Ridge.
Seismotectonic context. The map location is given by the red rectangle on the inset globe. Focal mechanisms are shown for events with Mw > 6 (ref. 30). Mw > 7.0 events are labelled. Stations of the PI-LAB ocean bottom seismometer network are indicated by triangles. Our relocated hypocentre and low-frequency RMT of the 2016 earthquake are shown by the red star and red beach ball, respectively. The orange beach ball is a colocated Mw 5.8 used for the Mach cone analysis. The black rectangle shows the location of the map in Fig. 2. ISC Bulletin, Bulletin of the International Seismological Centre.
Interpretation of rupture dynamics for the 2016 Romanche earthquake. Top: perspective view of bathymetry along the Romanche FZ. Bottom: interpretive cross-section along the ruptured fault plane. Colours show a thermal profile based on half-space cooling. The green line denotes the predicted transition between velocity-strengthening and velocity-weakening frictional regimes (as expressed by the a – b friction rate parameter) from Gabbro data35. The numbers show the key stages of rupture evolution: (1) rupture initiation (star) in the oceanic mantle, (2) initiation phase has sufficient fracture energy to propagate upwards to the locked section of fault, (3) weak subshear rupture front travels east in the lower crust and/or upper mantle, (4) rupture reaches the locked, thinner crustal segment close to the weaker RTI (SE1), (5) sufficient fracture energy for a westward supershear rupture in the crust along the strongly coupled fault segment (SE2) and (6) rupture possibly terminated by a serpentinized and hydrothermally altered fault segment.
#EarthquakeReport for M 6.9 #Earthquake along the equatorial Mid Atlantic Ridge plate boundary a right-lateral strike-slip earthquake along the Romanche transform faulthttps://t.co/LkglWJgBvD read the report herehttps://t.co/8ZGxTJEU9v pic.twitter.com/axcwlSPDSI — Jason "Jay" R. Patton (@patton_cascadia) September 5, 2022 Mw=7.0, CENTRAL MID-ATLANTIC RIDGE (Depth: 25 km), 2022/09/04 09:42:18 UTC – Full details here: https://t.co/MaNnp6eDAU pic.twitter.com/Gv39KoU3KQ — Earthquakes (@geoscope_ipgp) September 4, 2022 Magnitude 6.9 #earthquake on the mid-Atlantic ridge a couple of hours ago (2022-09-04Z09:42) https://t.co/GwKH4H1yON Predominantly strike-slip (as expected there). Amazing T-phases on the Ascension island hydrophones (data via @IRIS_EPO) coming after the weaker converted P-wave. pic.twitter.com/rCwawAet0W — Dr. Steven J. Gibbons (@stevenjgibbons) September 4, 2022 Major M6.9 right lateral fault #eartquake in oceanic Romanche fracture zone, offsetting central Mid-Atlantic Ridge (3cm/y). Large one for geologic setting, but no surface impact; no tsunami. Textbook behavior. #geohazards https://t.co/F3hXqtkikg pic.twitter.com/KcHL6p1nca — 🌎 Prof Ben van der Pluijm ⚒️ (@vdpluijm) September 4, 2022 Magnitude 6.9 earthquake on the Mid-Atlantic ridge, recorded in New England – detected in Maine, Massachusetts and the Westport Observatory's seismic equipment 4,340 miles from the epicenter in the middle of the Atlantic ocean. @Weston_Quakes https://t.co/dS9MJOU3ow pic.twitter.com/wUJwQ8XBqh — WestportAstroSociety (@westportskyguys) September 4, 2022 2022-09-04 strong M6.9 Central Mid-#Atlantic Ridge #earthquake recorded by online high quality data #RaspberryShakes + 3D trace from Canindé de São Francisco, #Brazil (2031.6km away) + area historical seismicity.#Python @raspishake @matplotlib #CitizenScienc pic.twitter.com/QYqq7lJPaW — Giuseppe Petricca (@gmrpetricca) September 4, 2022
I don’t always have the time to write a proper Earthquake Report. However, I prepare interpretive posters for these events. https://earthquake.usgs.gov/earthquakes/eventpage/us6000i5rd/executive 20220727_philippines_interpretation.pdf 16 MB pdf #EarthquakeReport for M7.1 #Lindol #Earthquake in the #Philippines Shaking reported up to MMI 9! See more abt regional tectonics herehttps://t.co/kZy1TFpDgN USGS page herehttps://t.co/GI4mzfeu0Y pic.twitter.com/pzMzWJDmxm — Jason "Jay" R. Patton (@patton_cascadia) July 27, 2022 I don’t always have the time to write a proper Earthquake Report. However, I prepare interpretive posters for these events. Because of this, I present Earthquake Report Lite. (but it is more than just water, like the adult beverage that claims otherwise). I will try to describe the figures included in the poster, but sometimes I will simply post the poster here. https://earthquake.usgs.gov/earthquakes/eventpage/us6000hm9j/executive I will fill in the details later, after I complete the annual summary. I have not even made a poster for this earthquake yet. Woops.
Earthquake Report: M 6.9 Sumatra
I need to run to catch the sunset and will complete the intro later tonight.
Below is my interpretive poster for this earthquake
I include some inset figures. Some of the same figures are located in different places on the larger scale map below.
Other Report Pages
Some Relevant Discussion and Figures
Seismic Hazard and Seismic Risk
Tsunami Hazard
Indonesia | Sumatra
General Overview
Earthquake Reports
Social Media
ID: #rs2022wsherl
Southwest of Sumatra, Indonesia
2022-11-18 13:37 UTC@raspishake #QuakeView
ID: #rs2022wsherl
Southwest of Sumatra, Indonesia
2022-11-18 13:37 UTC@raspishake #QuakeView
References:
Basic & General References
Specific References
Return to the Earthquake Reports page.
Earthquake Report: M 7.3 Tonga trench outer rise
Below is my interpretive poster for this earthquake
I include some inset figures. Some of the same figures are located in different places on the larger scale map below.
Other Report Pages
Some Relevant Discussion and Figures
TZ—transition zone; LM—lower mantle.
shown in the inset figure, with the gray dotted box indicating the expanded region in the main figure.
New Britain | Solomon | Bougainville | New Hebrides | Tonga | Kermadec Earthquake Reports
General Overview
Earthquake Reports
Social Media
Mag: 7.5 Depth: 33
Coords: 19.322 S 172.01 W
Location: TONGA ISLANDS REGION
NIUE AND TONGA pic.twitter.com/lm1RMEJ0o8
References:
Basic & General References
Specific References
Return to the Earthquake Reports page.
Earthquake Report: M 7.6 Earthquake in Mexico
Because of this, I present Earthquake Report Lite. (but it is more than just water, like the adult beverage that claims otherwise). I will try to describe the figures included in the poster, but sometimes I will simply post the poster here.Below is my interpretive poster for this earthquake
I include some inset figures.
Supportive Figures
Earthquake Triggered Landslides
Social Media:
probably triggered landslides/induced liquefactionhttps://t.co/9zpN2ZlAhw pic.twitter.com/tMDb4mSwCw
Mexico | Central America
General Overview
Earthquake Reports
References:
Basic & General References
Specific References
Return to the Earthquake Reports page.
Earthquake Report: M 6.0 northeast Pacific Ocean
Below is my interpretive poster for this earthquake
I include some inset figures.
Pacific Ocean | Hawai’i’ Earthquake Reports
References:
Basic & General References
Specific References
Return to the Earthquake Reports page.
Earthquake Report for M 6.9 Earthquake in Taiwan
Because of this, I present Earthquake Report Lite. (but it is more than just water, like the adult beverage that claims otherwise). I will try to describe the figures included in the poster, but sometimes I will simply post the poster here.Below is my interpretive poster for this earthquake
I include some inset figures.
Supportive Figures
Social Media:
India | Asia | India Ocean
Earthquake Reports
References:
Basic & General References
Specific References
Return to the Earthquake Reports page.
Earthquake Report: M 7.6 Papua New Guinea
Below is my interpretive poster for this earthquake
I include some inset figures. Some of the same figures are located in different places on the larger scale map below.
Other Report Pages
Some Relevant Discussion and Figures
Shaking Intensity
Potential for Ground Failure
There are many different ways in which a landslide can be triggered. The first order relations behind slope failure (landslides) is that the “resisting” forces that are preventing slope failure (e.g. the strength of the bedrock or soil) are overcome by the “driving” forces that are pushing this land downwards (e.g. gravity). The ratio of resisting forces to driving forces is called the Factor of Safety (FOS). We can write this ratio like this:
New Britain | Solomon | Bougainville | New Hebrides | Tonga | Kermadec Earthquake Reports
General Overview
Earthquake Reports
Social Media
normal oblique
7 dec '89 M7.1
14 dec '11 M7.1
6 may '19 M7.1
🔸Intensidad MMI: IX (Extremo)
🔸Profundidad: 61 km
🔸Distancia: 14772 (epicentro-estación) pic.twitter.com/8EVKmCIHT1
•Creditos Respectivos
•No se sabe localizacion precisa (Probablemente Madang)
–#Sismo #Temblor #Earthquake pic.twitter.com/Rq67oUONGU
References:
Basic & General References
Specific References
Return to the Earthquake Reports page.
Earthquake Report: M 6.9 Mid Atlantic Ridge
Earthquake magnitude is controlled by three things:
If we continue to look at the historic record, we will see that there appear to be three instances where one of these M 6.5-7 earthquakes had a later earthquake of a similar magnitude.
When an earthquake fault slips, the crust surrounding the fault squishes and expands, deforming elastically (like in one’s underwear). These changes in shape of the crust cause earthquake fault stresses to change. These changes in stress can either increase or decrease the chance of another earthquake.
I wrote more about this type of earthquake triggering for Temblor here. Head over there to learn more about “static coulomb stress triggering.”
In the poster, I label these earthquakes as “Linked Earthquakes.” Perhaps the later of each earthquake pair (or triple) was triggered by the change in static coulomb stress.
Here are the three sets of “Linked Earthquakes:”
Since we cannot yet know the real answer to this question, we are reminded of the advice that educators and emergency response people provide: If one lives in Earthquake Country, get earthquake prepared. Just a little effort to get better prepared makes a major difference in the outcome.
Head over to Earthquake Alliance where there are some excellent brochures about how to be better prepared and more resilient to earthquake and tsunami hazards. Living on Shaky Ground is one of my favorites!Below is my interpretive poster for this earthquake
I include some inset figures. Some of the same figures are located in different places on the larger scale map below.
Some Relevant Discussion and Figures
Atlantic
General Overview
Earthquake Reports
Social Media
References:
Basic & General References
Specific References
Return to the Earthquake Reports page.
Earthquake Report M 7.0 Philippines
Because of this, I present Earthquake Report Lite. (but it is more than just water, like the adult beverage that claims otherwise). I will try to describe the figures included in the poster, but sometimes I will simply post the poster here.Below is my interpretive poster for this earthquake
I include some inset figures.
Philippines | Western Pacific
Earthquake Reports
References:
Basic & General References
Specific References
Social Media: Here is my thread for this event.
This has potential to be quite devastatingReturn to the Earthquake Reports page.
Earthquake Report M 6.9 Macquarie Island
Below is my interpretive poster for this earthquake
I include some inset figures.
New Zealand | Australia
General Overview
Earthquake Reports
References:
Basic & General References
Specific References
Return to the Earthquake Reports page.