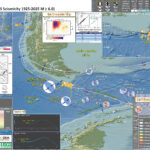
There have not been that many large earthquakes this year. This is good for one main reason, there is a lower potential for human suffering.
Therefore, there are fewer Earthquake Reports for this year.
This morning (my time) there was a magnitude M 6.9 earthquake along the Romanche transform fault, a right-lateral strike-slip fault system that offsets the Mid Atlantic Ridge in the equatorial Atlantic Ocean. The fault is part of the Romanche fracture zone.
https://earthquake.usgs.gov/earthquakes/eventpage/us7000i53f/executive
The transform faults in this part of the Mid Atlantic Ridge plate boundary have a pattern of earthquakes that seem to max out in the lower 7 magnitudes. This may be (at least partly) due to the maximum length of these faults (?).
The Romanche fault is about 900 kilometers long. The Chain fault is about 250 km long. The St. Paul fault is about 350 km long.
-
Earthquake magnitude is controlled by three things:
- the size of the earthquake slip area, for most events, this is basically the length of the fault (since the width of the fault is controlled by the thickness of the lithosphere, or the crust)
- the amount that the fault slipped
- physical properties of the lithosphere or crust on either side of the fault (how “elastic” the Earth is)
Using empirical (data) based relations between earthquake subsurface rupture length and earthquake magnitude (Wells and Coppersmith, 1994), I calculate the maximum earthquake magnitude we may get on these three faults listed above.
Here are the data that Wells and Coppersmith use to establish these relations.
(a) Regression of subsurface rupture length on magnitude (M). Regression line shown for all-slip-type relationship. Short dashed line indicates 95% confidence interval. (b) Regression lines for strike-slip relationships. See Table 2 for regression coefficients. Length of regression lines shows the range of data for each relationship.
Here are the magnitude estimates for each of these fault systems.
Looking at the interpretive poster, we can see that there have not been any temblors that approach the sizes listed in this table. The largest historic earthquake was M 7.1 (there were several).
So, we may ask ourselves one of the most common questions people ask regarding earthquakes. Was this M 6.9 a foreshock to a larger earthquake?
Obviously, we cannot yet know this. Nobody can predict the future (at least not yet).
However, based on the incredibly short historic record of earthquakes, we may answer this question: “no, probably not.” This answer is tempered by the very short seismic record. If magnitude 8 earthquakes occur, on average, every 1000 years, then our ~100 year record might be too short to “notice” one of these M 8 events.
If we continue to look at the historic record, we will see that there appear to be three instances where one of these M 6.5-7 earthquakes had a later earthquake of a similar magnitude.
When an earthquake fault slips, the crust surrounding the fault squishes and expands, deforming elastically (like in one’s underwear). These changes in shape of the crust cause earthquake fault stresses to change. These changes in stress can either increase or decrease the chance of another earthquake.
I wrote more about this type of earthquake triggering for Temblor here. Head over there to learn more about “static coulomb stress triggering.”
In the poster, I label these earthquakes as “Linked Earthquakes.” Perhaps the later of each earthquake pair (or triple) was triggered by the change in static coulomb stress.
-
Here are the three sets of “Linked Earthquakes:”
- In 1992, along the Chain fault, the 16 Feb M 6.6 appears to have triggered the 18 Feb M 6.6. More speculatively, about 6 months later, it seems that there was a triggered M 6.9 on 18 Aug. Static Coulomb triggering typically has a limit of about 2-3 times the rupture length (and this depends of the pre-existing stress on the receiver fault, the fault that may be having triggered slip). A M 6.6 may have a rupture length of 50 km, so could possibly affect faults as far as 100-150 km away. The M 6.9 is about 70 km from the easternmost M 6.6, so it seems possible that the M 6.9 was triggered by the M 6.6.
- In 2003, along the Romanche fault, there were two M 6.6 earthquakes separated by about 6 weeks. These quakes are about 100 km apart, possibly close enough to be triggered.
- In 2020, along the St. Paul transform fault, there was a pair of quakes about 3 weeks and 340 km apart. The first quake was M 6.5, so this pair of events seems to far apart to be related.
So, given the historic record, it sure seems likely that there may be another M6-7 earthquakes in the region of the fault sometime in the next couple of months. And, given our lack of knowledge about the long term behavior of these faults, it is also possible that there could be a larger M 8 event.
Since we cannot yet know the real answer to this question, we are reminded of the advice that educators and emergency response people provide: If one lives in Earthquake Country, get earthquake prepared. Just a little effort to get better prepared makes a major difference in the outcome.
Head over to Earthquake Alliance where there are some excellent brochures about how to be better prepared and more resilient to earthquake and tsunami hazards. Living on Shaky Ground is one of my favorites!
Below is my interpretive poster for this earthquake
- I plot the seismicity from the past month, with diameter representing magnitude (see legend). I include earthquake epicenters from 1920-2020 with magnitudes M ≥ 3.0 in one version.
- I plot the USGS fault plane solutions (moment tensors in blue and focal mechanisms in orange), possibly in addition to some relevant historic earthquakes.
- A review of the basic base map variations and data that I use for the interpretive posters can be found on the Earthquake Reports page. I have improved these posters over time and some of this background information applies to the older posters.
- Some basic fundamentals of earthquake geology and plate tectonics can be found on the Earthquake Plate Tectonic Fundamentals page.
- In the lower right corner I include a map that shows the age of the oceanic crust in the Atlantic Ocean. Oceanic crust (or lithosphere) is created at mid ocean ridges, where there is extension that allows upward movement of magma, leading to the formation of oceanic crust. The Mid Atlantic Ridge system is one of these types of plate boundaries.
- Above the crust age map is an illustration showing the how the crust moving away from the ocean ridges leaves behind oceanic crust. The Earth’s magnetic polarity changes at times and the oceanic crust records these changes in magnetic polarity. These changes are the main reason why we know that the crust is formed along these ridge systems. Read more here.
- In the upper left corner is a small scale map that shows the historic seismicity, the plate boundary fault systems, and the magnetic anomalies. Places with crust formed when the magnetic field is like today, is colored red (a.k.a. normal polarity) and crust formed when the poles were reversed relative to today is blue (i.e., reversed polarity).
- In the upper right corner is a map that shows the earthquake intensity from this earthquake (using the modified Mercalli Intensity Scale). Intensity is a measure of how strongly the shaking is felt, not a measure of the earthquake size. So, the intensity gets smaller with distance (see how the highest intensity is nearest the earthquake epicenter).
- In the lower left center there is a map from Heezen et al. (1964). Heezen was an oceanographer that contributed greatly to our knowledge of the oceans. In this study, one of the things that they were studying is the flow of deep water (deep water flows largely because of changes in density of the seawater, controlled by salinity and temperature). Because of this, they were mapping the shape of the seafloor to see where this deep water could flow. Ths location of this map is outlined by a dashed rectangle in the main map.
I include some inset figures. Some of the same figures are located in different places on the larger scale map below.
Some Relevant Discussion and Figures
- Here a the Bonatti et al. (2001) figure showing the bathymetry of this area. I include the figure caption as a blockquote below.
A: Multibeam topography of Romanche region, showing north-south profiles where sampling was carried out. Black dots and red numbers indicate estimated age (in million years) of lithosphere south of Romanche Transform, assuming spreading half-rate of 17 mm/yr within present-day ridge and transform geometry. White dots indicate epicenters of teleseismically recorded 1970–1995 events (magnitude . 4). FZ is fracture zone. B: Topography and petrology at eastern intersection of Romanche Fracture Zone with Mid-Atlantic Ridge. Data were obtained during expeditions S-16, S-19, and G-96 (Bonatti et al., 1994, 1996). C: Location of A along Mid-Atlantic Ridge.
- Dr. Stephen Hicks and their colleagues conducted a fascinating study of the 2016 M 7.1 earthquake. They hypothesize that the Romanche fault slipped in different parts of the fault at different times (during the earthquake).
- This map shows the historic seismicity of the region.
- Here is where Hicks et al. (2020) hypothesize that the slip slipped.
Seismotectonic context. The map location is given by the red rectangle on the inset globe. Focal mechanisms are shown for events with Mw > 6 (ref. 30). Mw > 7.0 events are labelled. Stations of the PI-LAB ocean bottom seismometer network are indicated by triangles. Our relocated hypocentre and low-frequency RMT of the 2016 earthquake are shown by the red star and red beach ball, respectively. The orange beach ball is a colocated Mw 5.8 used for the Mach cone analysis. The black rectangle shows the location of the map in Fig. 2. ISC Bulletin, Bulletin of the International Seismological Centre.
Interpretation of rupture dynamics for the 2016 Romanche earthquake. Top: perspective view of bathymetry along the Romanche FZ. Bottom: interpretive cross-section along the ruptured fault plane. Colours show a thermal profile based on half-space cooling. The green line denotes the predicted transition between velocity-strengthening and velocity-weakening frictional regimes (as expressed by the a – b friction rate parameter) from Gabbro data35. The numbers show the key stages of rupture evolution: (1) rupture initiation (star) in the oceanic mantle, (2) initiation phase has sufficient fracture energy to propagate upwards to the locked section of fault, (3) weak subshear rupture front travels east in the lower crust and/or upper mantle, (4) rupture reaches the locked, thinner crustal segment close to the weaker RTI (SE1), (5) sufficient fracture energy for a westward supershear rupture in the crust along the strongly coupled fault segment (SE2) and (6) rupture possibly terminated by a serpentinized and hydrothermally altered fault segment.
- 2022.09.04 M 6.9 Mid Atlantic Ridge (Romannche fracture zone)
- 2018.11.08 M 6.8 Mid Atlantic Ridge (Jan Mayen fracture zone)
- 2017.08.18 M 6.6 Mid Atlantic Ridge (Chain fracture zone)
- 2016.08.30 M 7.1 Mid Atlantic Ridge
- 2015.06.18 M 7.0 Mid Atlantic Ridge
- 2015.05.24 M 6.3 Mid Atlantic Ridge
- 2015.02.13 M 7.1 Mid Atlantic Ridge
Atlantic
General Overview
Earthquake Reports
Social Media
#EarthquakeReport for M 6.9 #Earthquake along the equatorial Mid Atlantic Ridge plate boundary
a right-lateral strike-slip earthquake along the Romanche transform faulthttps://t.co/LkglWJgBvD
read the report herehttps://t.co/8ZGxTJEU9v pic.twitter.com/axcwlSPDSI
— Jason "Jay" R. Patton (@patton_cascadia) September 5, 2022
Mw=7.0, CENTRAL MID-ATLANTIC RIDGE (Depth: 25 km), 2022/09/04 09:42:18 UTC – Full details here: https://t.co/MaNnp6eDAU pic.twitter.com/Gv39KoU3KQ
— Earthquakes (@geoscope_ipgp) September 4, 2022
Magnitude 6.9 #earthquake on the mid-Atlantic ridge a couple of hours ago (2022-09-04Z09:42) https://t.co/GwKH4H1yON Predominantly strike-slip (as expected there). Amazing T-phases on the Ascension island hydrophones (data via @IRIS_EPO) coming after the weaker converted P-wave. pic.twitter.com/rCwawAet0W
— Dr. Steven J. Gibbons (@stevenjgibbons) September 4, 2022
Major M6.9 right lateral fault #eartquake in oceanic Romanche fracture zone, offsetting central Mid-Atlantic Ridge (3cm/y). Large one for geologic setting, but no surface impact; no tsunami. Textbook behavior. #geohazards https://t.co/F3hXqtkikg pic.twitter.com/KcHL6p1nca
— 🌎 Prof Ben van der Pluijm ⚒️ (@vdpluijm) September 4, 2022
Magnitude 6.9 earthquake on the Mid-Atlantic ridge, recorded in New England – detected in Maine, Massachusetts and the Westport Observatory's seismic equipment 4,340 miles from the epicenter in the middle of the Atlantic ocean. @Weston_Quakes https://t.co/dS9MJOU3ow pic.twitter.com/wUJwQ8XBqh
— WestportAstroSociety (@westportskyguys) September 4, 2022
2022-09-04 strong M6.9 Central Mid-#Atlantic Ridge #earthquake recorded by online high quality data #RaspberryShakes + 3D trace from Canindé de São Francisco, #Brazil (2031.6km away) + area historical seismicity.#Python @raspishake @matplotlib #CitizenScienc pic.twitter.com/QYqq7lJPaW
— Giuseppe Petricca (@gmrpetricca) September 4, 2022
- Frisch, W., Meschede, M., Blakey, R., 2011. Plate Tectonics, Springer-Verlag, London, 213 pp.
- Hayes, G., 2018, Slab2 – A Comprehensive Subduction Zone Geometry Model: U.S. Geological Survey data release, https://doi.org/10.5066/F7PV6JNV.
- Holt, W. E., C. Kreemer, A. J. Haines, L. Estey, C. Meertens, G. Blewitt, and D. Lavallee (2005), Project helps constrain continental dynamics and seismic hazards, Eos Trans. AGU, 86(41), 383–387, , https://doi.org/10.1029/2005EO410002. /li>
- Jessee, M.A.N., Hamburger, M. W., Allstadt, K., Wald, D. J., Robeson, S. M., Tanyas, H., et al. (2018). A global empirical model for near-real-time assessment of seismically induced landslides. Journal of Geophysical Research: Earth Surface, 123, 1835–1859. https://doi.org/10.1029/2017JF004494
- Kreemer, C., J. Haines, W. Holt, G. Blewitt, and D. Lavallee (2000), On the determination of a global strain rate model, Geophys. J. Int., 52(10), 765–770.
- Kreemer, C., W. E. Holt, and A. J. Haines (2003), An integrated global model of present-day plate motions and plate boundary deformation, Geophys. J. Int., 154(1), 8–34, , https://doi.org/10.1046/j.1365-246X.2003.01917.x.
- Kreemer, C., G. Blewitt, E.C. Klein, 2014. A geodetic plate motion and Global Strain Rate Model in Geochemistry, Geophysics, Geosystems, v. 15, p. 3849-3889, https://doi.org/10.1002/2014GC005407.
- Meyer, B., Saltus, R., Chulliat, a., 2017. EMAG2: Earth Magnetic Anomaly Grid (2-arc-minute resolution) Version 3. National Centers for Environmental Information, NOAA. Model. https://doi.org/10.7289/V5H70CVX
- Müller, R.D., Sdrolias, M., Gaina, C. and Roest, W.R., 2008, Age spreading rates and spreading asymmetry of the world’s ocean crust in Geochemistry, Geophysics, Geosystems, 9, Q04006, https://doi.org/10.1029/2007GC001743
- Pagani,M. , J. Garcia-Pelaez, R. Gee, K. Johnson, V. Poggi, R. Styron, G. Weatherill, M. Simionato, D. Viganò, L. Danciu, D. Monelli (2018). Global Earthquake Model (GEM) Seismic Hazard Map (version 2018.1 – December 2018), DOI: 10.13117/GEM-GLOBAL-SEISMIC-HAZARD-MAP-2018.1
- Silva, V ., D Amo-Oduro, A Calderon, J Dabbeek, V Despotaki, L Martins, A Rao, M Simionato, D Viganò, C Yepes, A Acevedo, N Horspool, H Crowley, K Jaiswal, M Journeay, M Pittore, 2018. Global Earthquake Model (GEM) Seismic Risk Map (version 2018.1). https://doi.org/10.13117/GEM-GLOBAL-SEISMIC-RISK-MAP-2018.1
- Zhu, J., Baise, L. G., Thompson, E. M., 2017, An Updated Geospatial Liquefaction Model for Global Application, Bulletin of the Seismological Society of America, 107, p 1365-1385, https://doi.org/0.1785/0120160198
- Abercrombie, R.E. and Ekstrom, G., 2001. Earthquake slip on oceanic transform faults in Nature, v. 410, p. 74-77
- Bonatti, E., Brunello, D., Fabretti, P., Ligi, M., Porcaro, R.A., and Sealer, M., 2001. Steady-state creation of crust-free lithosphere at cold spots in mid-ocean ridges in Geology, v. 29, no. 11, p. 979-982.
- Hicks, S.P., Okuwaki, R., Steinberg, A., Rychert, C.A., Harmon, N. Abercrombie, R.E., Bogiatzis, P., Cataphors, D., Zahradnik, J., Kendall, J-M., Yagi, Y., Shimizu, K., and Sudhaus, H., 2020. Back-propagating supershear rupture in the 2016 Mw 7.1 Romanche transform fault earthquake in Nature Geoscience, v. 13, p. 647-653, https://doi.org/10.1038/s41561-020-0619-9
- Heezen, B.C., Bunce, E.T., Hersey, J.B., and Tharp, M., 1964. Chain and Romanche fracture zones in Deep-Sea research, v. 11, p. 11-33
- Müller, R.D., Sdrolias, M., Gaina, C., and Roest, W.R., 2008. Age, spreading rates and spreading symmetry of the world’s ocean crust in Geochem. Geophys. Geosyst., 9, Q04006, doi:10.1029/2007GC001743
- Torsvik, T.H., Tousse, S., Labaila, C., and Smethurst, M.A., 2009. A new scheme for the opening of the South Atlantic Ocean and the dissection of an Aptian salt basin in Geophysical Journal International, v. 177, p. 1315-1333.
References:
Basic & General References
Specific References
Return to the Earthquake Reports page.
- Sorted by Magnitude
- Sorted by Year
- Sorted by Day of the Year
- Sorted By Region
I don’t always have the time to write a proper Earthquake Report. However, I prepare interpretive posters for these events. https://earthquake.usgs.gov/earthquakes/eventpage/us6000i5rd/executive 20220727_philippines_interpretation.pdf 16 MB pdf #EarthquakeReport for M7.1 #Lindol #Earthquake in the #Philippines Shaking reported up to MMI 9! See more abt regional tectonics herehttps://t.co/kZy1TFpDgN USGS page herehttps://t.co/GI4mzfeu0Y pic.twitter.com/pzMzWJDmxm — Jason "Jay" R. Patton (@patton_cascadia) July 27, 2022 I don’t always have the time to write a proper Earthquake Report. However, I prepare interpretive posters for these events. Because of this, I present Earthquake Report Lite. (but it is more than just water, like the adult beverage that claims otherwise). I will try to describe the figures included in the poster, but sometimes I will simply post the poster here. https://earthquake.usgs.gov/earthquakes/eventpage/us6000hm9j/executive I will fill in the details later, after I complete the annual summary. I have not even made a poster for this earthquake yet. Woops.
I don’t always have the time to write a proper Earthquake Report. However, I prepare interpretive posters for these events. Because of this, I present Earthquake Report Lite. (but it is more than just water, like the adult beverage that claims otherwise). I will try to describe the figures included in the poster, but sometimes I will simply post the poster here. https://earthquake.usgs.gov/earthquakes/eventpage/us6000h6nr/executive I will fill in these details a bit more after I complete the annual summary.
I don’t always have the time to write a proper Earthquake Report. However, I prepare interpretive posters for these events. Because of this, I present Earthquake Report Lite. (but it is more than just water, like the adult beverage that claims otherwise). I will try to describe the figures included in the poster, but sometimes I will simply post the poster here. https://earthquake.usgs.gov/earthquakes/eventpage/us6000h519/executive I forgot to write this up when the earthquake happened. I will fill in some details after I have completed my annual summary.
There was a magnitude M 6.2 Gempa or Earthquake on 25 February 2022. https://earthquake.usgs.gov/earthquakes/eventpage/us6000gzyg/executive The plate boundary fault system that dominates the tectonics of the Island of Sumatera, Indonesia, is the complicated. The oceanic India-Australia plate converges with the Eurasia plate to form the Sunda trench. This convergent plate boundary forms a subduction zone where the oceanic plate subducts beneath the continental plate. However, the direction of plate convergence is not perpendicular to the plate boundary fault (the megathrust subduction zone). Why does this matter? The amount of plate convergence that is perpendicular to the plate boundary is accommodated by earthquake fault slip on the megathrust. The amount of plate convergence that is parallel to the plate boundary is accommodated by earthquake fault slip on a different series of faults that we call sliver faults. The Great Sumatra fault is one of these [forearc] sliver faults. Here is a figure from Lange et al. (2008) that shows how oblique plate convergence forms both a subduction zone and a forearc sliver fault system. The M 6.2 earthquake is a strike-slip earthquake along the Great Sumatra fault, one of these forearc sliver faults. Based on our knowledge of this fault system and the earthquake mechanism, we can easily interpret this to be a right-lateral strike-slip fault. There are numerous historical analogies from the past century. Most of the events in the past few decades have been in the M 6-7 range, though there have been events of larger magnitude in the past centuries.
India-Australia plate subducts northeastwardly beneath the Sunda plate (part of Eurasia) at modern rates (GPS velocities are based on regional modeling of Bock et al, 2003 as plotted in Subarya et al., 2006). Historic earthquake ruptures (Bilham, 2005; Malik et al., 2011) are plotted in orange. 2004 earthquake and 2005 earthquake 5 meter slip contours are plotted in orange and green respectively (Chlieh et al., 2007, 2008). Bengal and Nicobar fans cover structures of the India-Australia plate in the northern part of the map. RR0705 cores are plotted as light blue. SRTM bathymetry and topography is in shaded relief and colored vs. depth/elevation (Smith and Sandwell, 1997).
This movie illustrates simulation of seismic wave propagation generated by Dec. 26 Sumatra earthquake. Colors indicate amplitude of vertical displacement at the surface of the Earth. Red is upward and blue is downward. Total duration of this simulation is 20 minutes. Source model we used is that of Chen Ji of Caltech. Simulation was performed by using the Earth Simulator of JAMSTEC.
Map of Southeast Asia showing recent and selected historical ruptures of the Sunda megathrust. Black lines with sense of motion are major plate-bounding faults, and gray lines are seafloor fracture zones. Motions of Australian and Indian plates relative to Sunda plate are from the MORVEL-1 global model [DeMets et al., 2010]. The fore-arc sliver between the Sunda megathrust and the strike-slip Sumatran Fault becomes the Burma microplate farther north, but this long, thin strip of crust does not necessarily all behave as a rigid block. Sim = Simeulue, Ni = Nias, Bt = Batu Islands, and Eng = Enggano. Brown rectangle centered at 2°S, 99°E delineates the area of Figure 3, highlighting the Mentawai Islands. Figure adapted from Meltzner et al. [2012] with rupture areas and magnitudes from Briggs et al. [2006], Konca et al. [2008], Meltzner et al. [2010], Hill et al. [2012], and references therein.
New revised (simplified) active fault map of the Sumatran Fault Zone (SFZ) according to the PuSGeN Team for Updating Indonesia Seismic Hazard Map (2016) with new slip rates from geological and geodetical (GPS) recent studies.
Map of 20 geometrically defined segments of the Sumatran fault system and their spatial relationships to active volcanoes, major graben, and lakes.
Tectonic modelling based on continuous GPS – SuGAr 9 Sumatran GPS Array) and coral uplift rates,
Comparison of GPS velocity profiles across the Sumatran fore arc inferred from (left) kinematic block models (right) with previously published velocity profiles. Modeling all fore-arc site velocities with a single strike-slip fault results in anomalously high inferred slip-rates (>22mm/yr) and missing the Sumatran Fault trace by up to 40km. Incorporating the effect of oblique locking of the Sunda megathrust results in lower inferred slip – rates for the Sumatran Fault (~15mm/yr) that are more consistent with updated geological slip rates.
A plausible (but nonunique) history of deformation along the obliquely convergent Sumatran plate margin, based upon our work and consistent with GPS results and the timing of deformation in the forearc region. (a) By about 4 Ma, the outer-arc ridge has formed. The former deformation front and the Mentawai homocline provide a set of reference features for assessing later deformations. From 4 to 2 Ma, partitioning of oblique plate convergence occurs only north of the equator. Dextral-slip faults on the northeast flank of the forearc sliver plate parallel the trench in northern Sumatra but swing south and disarticulate the forearc basin and outer-arc ridge north of the equator. (b) Slip partitioning begins south of the equator about 2 Ma, with the creation of the Mentawai and Sumatran faults. Transtension continues in the forearc north of the equator. (c) In perhaps just the past 100 yr, the Mentawai fault has become inactive, and the rate of slip on the Sumatran fault north of 2°N has more than doubled. This difference in slip rate may be accommodated by a new zone of transtension between the Sumatran fault and the deformation front in the forearc and outer-arc regions.
Relocated MJHD epicenters. (a) Northern Sumatra. (b) Central Sumatra. (c) Southern Sumatra. Solid lines with names indicate segments of the Sumatran fault (Sieh and Natawidjaja, 2000). Symbols are as in Figure 2. The thick solid line (see Fig. 4c) indicates the Ranau–Suwoh area, which was severely damaged by the 1933 Liwa earthquake (Berlage, 1934;Widiwijayanti et al., 1996). The slip rates of the Sumatran fault in northern, central, and southern Sumatra are taken from Ito et al. (2012) and Genrich et al. (2000) for Global Positioning System (GPS) and Bellier and Sebrier (1995) for Satellite Pour l’Observation de la Terre (SPOT).
Earthquake history along the Sumatran fault since 1892. Fault planes estimated in this study are shown by thick lines. SG: Seismic gap.
Coulomb stress models resolved on receiver faults of central part of GSF from coseismic slip model of each large interplate earthquakes. The color represents the maximum stress changes at 10 km depth with a scale saturated at 1 bar.
Cumulative ΔCFF of each earthquake listed in Table 1 (a) and cumulative ΔCFF of 1797, 1833, and 1861 earthquakes (b). The cyan ellipses are the damage area of large intraplate earthquakes marked as green star. The ΔCFF is calculated at 10 km depth with a scale saturated at 1 bar.
FOS = Resisting Force / Driving Force
Annual probability of experiencing a tsunami with a height at the coast of (a) 0.5m (a tsunami warning) and (b) 3m (a major tsunami warning).
#EarthquakeReport for M 6.2 #Gempa #Earthquake along the #Sumatra fault just north of #Padang evidence for strong ground shaking and possible surface rupture read more herehttps://t.co/xujTF3MERq pic.twitter.com/tWEhQTCj06 — Jason "Jay" R. Patton (@patton_cascadia) February 27, 2022 A Mw6.2 earthquake just occurred along the Sumatran Fault in Indonesia. This fault extends for >1700 km, slicing Sumatra in two. The fault aligns closely with the volcanoes generated by the subduction zone to the west. See the fault & volcanoes in the topography below! 🧵 1/ https://t.co/rY6yzEwBwG pic.twitter.com/5gd5YjaPfG — Dr. Judith Hubbard (@JudithGeology) February 25, 2022 Kondisi saat ini di Kec. Talamau Pasaman Barat. Bagi manteman yang ada dilokasi boleh mention kondisi di sana ya @infomitigasi @JogjaUpdate pic.twitter.com/910vTLMioM — Podcast Asap_id (@podcastasap_id) February 25, 2022 An earthquake with Mw 6.2 struck inland with dextral mechanism in the segmentation of Sumatra Fault on this morning (Indonesia Time), killing at least two people and causing tremors that were felt until Singapore and Malaysia. pic.twitter.com/Gd8MoXC8u4 — andrean (@andreanjtk) February 25, 2022 Rangkaian #Gempa yang terjadi di #Sumbar, tapatnya di #Pasamanbarat pada 25 Feb 2022. Rangkaian gempa ini diawal oleh gempa pembuka (foreshock) M=5,2 (08:35:51 WIB), berselang 3 menit 42 detik diikuti oleh gempa utama M=6,2 (08:39:29 WIB). pic.twitter.com/iNQL9tiIcZ — Zulfakriza Z. (@zulfakriza) February 25, 2022 Akibat Gempa di Pasbar terjadi juga longsor di Malampah Pasaman pic.twitter.com/WU9MJ7pSFm — Yazid Lubis (@YazidLubis9) February 25, 2022 Did you feel shaking from this morning's #Sumatra earthquake? The rupture occured along a segment of the Sumatran Fault. While the segment is 400km away from #Singapore, it was widely felt across the island. Learn more about today's event in our blog post https://t.co/bY8KDv3GAx — Earth Observatory SG (@EOS_SG) February 25, 2022 6.1 Mw North-Central Sumatra (#INDONESIA 🇮🇩), a right-lateral strike-slip "Southern Angkola Segment" (Great Sumatran Fault System), potentially for a >7.5 Mw. pic.twitter.com/YSXqgH1Ge1 — Abel Seism🌏Sánchez (@EQuake_Analysis) February 25, 2022 Some hours ago, strong shallow M6.2 #earthquake in Sumatra, widely felt also in Malaysia and Singapore. — José R. Ribeiro (@JoseRodRibeiro) February 25, 2022 Di dekat episenter gempa Pasaman Mag. 6,1 tadi pagi, pada bulan Januari 2022 sudah terjadi 2 gempa tidak dirasakan. pic.twitter.com/IWQvwvAlVY — DARYONO BMKG (@DaryonoBMKG) February 25, 2022 Pasca Gempa di Pasaman Barat semburkan air panas di Bonjol Sumatera Barat. — David Haris St Parmato (@DavidHaris10) February 25, 2022 Ground failure pasca gempa kuat. https://t.co/2ApLwk83aq — DARYONO BMKG (@DaryonoBMKG) February 25, 2022 Vibrasi periode panjang terjadi di Malaysia saat gempa M6,1 Pasaman. https://t.co/zCegE51eI9 — DARYONO BMKG (@DaryonoBMKG) February 25, 2022
I was returning from New Orleans where I was attending the American Geophysical Union Fall Meeting. There was a short layover in Denver and I had a short time to find some food, which is challenging with my dietary restrictions. I cannot recall precisely, but I got some notification from my CGS crew about a magnitude M 6.2 earthquake offshore of the Mendocino triple junction. One of these notifications was from Cindy as we both collaborate to prepare quick reports for earthquakes in California. These reports are sent upstream to management in our organization and others. I was unavailable to contribute this time. Needless to say, I was sad to have missed experiencing this good sized shaker for myself. This is the first earthquake of this size that I have missed (in Humboldt) since I moved here in 1991. Last week or so, their analyses were produced publicly and the earthquake catalog was updated. What we discovered is that there were two closely spaced (in time but not space) earthquakes, an M 5.7 and and M 6.2. https://earthquake.usgs.gov/earthquakes/eventpage/nc71127029/executive It was complicated for the seismologists to work out because the seismic waves of the two events overlapped in time. i.e., the waves from the first quake were still passing through the Earth when the waves from the second quake started. Basically, there was initially an M 5.7 strike-slip earthquake along the Mendocino transform fault zone about 20 km (12.5 miles) offshore. About 10 or 11 seconds later, there was an M 6.2 strike-slip earthquake within the Gorda plate, below the megathrust fault. Here is a plot from the USGS. Each horizontal squiggly line is the seismograph record from an individual seismometer. They are plotted with the seismometer closest to the earthquake on the bottom row and the furthest seismometer on the uppermost row. The P wave (primary wave) is the first of four major types of seismic waves. Next comes the S (secondary) wave, then the Love waves, and finally the Raleigh waves. The P wave arrives at closer seismometers before it arrives at more distant seismometers. Because of this, we generally call this type of plot a travel time plot. In the above plot we can see how the M 6.1 P waves are arriving while the M 5.7 S waves are still being transmitted. The M 5.7 is clearly a right-lateral strike-slip event given the aftershock pattern and the known location and type of the Mendocino fault system (a right-lateral strike-slip fault. Earthquake mechanisms (the “beach balls”) show two possible ways that the earthquake could have slipped. We use aftershock patterns and existing mapped faults to help us interpret which of these [nodal] fault planes is the more likely one. If we look at the earthquake poster below, we see that the M 6.2 earthquake is an almost pure strike-slip earthquake. The two possible fault planes are one that is oriented in the northwest direction (would be right-lateral) and one that is in the northeast direction (would be left-lateral). So, while most of our experience with the Gorda plate is with northeast oriented (striking) left-lateral strike-slip faults (e.g., 1980, 2010, 2014, etc.) it is possible that there are other faults, sub-parallel to the post-1992 seismicity trends, where the M 6.2 and other aftershocks were hosted. I mention these northwest trending faults in a recent Earthquake Report here. Something that is interesting is that the onshore events from this 20 Dec 2021 sequence are just to the north of the aftershocks from the 1992 sequence. They are at similar depths as those ’92 quakes and have similar earthquake mechanisms. As Spock would say, Fascinating. Dr. Anthony Lomax, famous for his work locating the hypocenter for the 1906 San Francisco Earthquake, has been developing excellent tools for seismologists ever since. He recently applied one of his new tools to locate earthquakes to the Mendocino triple junction region. I present some of his figures below. There are many different ways in which a landslide can be triggered. The first order relations behind slope failure (landslides) is that the “resisting” forces that are preventing slope failure (e.g. the strength of the bedrock or soil) are overcome by the “driving” forces that are pushing this land downwards (e.g. gravity). The ratio of resisting forces to driving forces is called the Factor of Safety (FOS). We can write this ratio like this: FOS = Resisting Force / Driving Force When FOS > 1, the slope is stable and when FOS < 1, the slope fails and we get a landslide. The illustration below shows these relations. Note how the slope angle α can take part in this ratio (the steeper the slope, the greater impact of the mass of the slope can contribute to driving forces). The real world is more complicated than the simplified illustration below. Landslide ground shaking can change the Factor of Safety in several ways that might increase the driving force or decrease the resisting force. Keefer (1984) studied a global data set of earthquake triggered landslides and found that larger earthquakes trigger larger and more numerous landslides across a larger area than do smaller earthquakes. Earthquakes can cause landslides because the seismic waves can cause the driving force to increase (the earthquake motions can “push” the land downwards), leading to a landslide. In addition, ground shaking can change the strength of these earth materials (a form of resisting force) with a process called liquefaction. Sediment or soil strength is based upon the ability for sediment particles to push against each other without moving. This is a combination of friction and the forces exerted between these particles. This is loosely what we call the “angle of internal friction.” Liquefaction is a process by which pore pressure increases cause water to push out against the sediment particles so that they are no longer touching. An analogy that some may be familiar with relates to a visit to the beach. When one is walking on the wet sand near the shoreline, the sand may hold the weight of our body generally pretty well. However, if we stop and vibrate our feet back and forth, this causes pore pressure to increase and we sink into the sand as the sand liquefies. Or, at least our feet sink into the sand. Below is a diagram showing how an increase in pore pressure can push against the sediment particles so that they are not touching any more. This allows the particles to move around and this is why our feet sink in the sand in the analogy above. This is also what changes the strength of earth materials such that a landslide can be triggered. Below is a diagram based upon a publication designed to educate the public about landslides and the processes that trigger them (USGS, 2004). Additional background information about landslide types can be found in Highland et al. (2008). There was a variety of landslide types that can be observed surrounding the earthquake region. So, this illustration can help people when they observing the landscape response to the earthquake whether they are using aerial imagery, photos in newspaper or website articles, or videos on social media. Will you be able to locate a landslide scarp or the toe of a landslide? This figure shows a rotational landslide, one where the land rotates along a curvilinear failure surface.
The Gorda and Juan de Fuca plates subduct beneath the North America plate to form the Cascadia subduction zone fault system. In 1992 there was a swarm of earthquakes with the magnitude Mw 7.2 Mainshock on 4/25. Initially this earthquake was interpreted to have been on the Cascadia subduction zone (CSZ). The moment tensor shows a compressional mechanism. However the two largest aftershocks on 4/26/1992 (Mw 6.5 and Mw 6.7), had strike-slip moment tensors. In my mind, these two aftershocks aligned on what may be the eastern extension of the Mendocino fault. However, looking at their locations, my mind was incorrect. These two earthquakes were not aftershocks, but were either left-lateral or right-lateral strike-slip Gorda plate earthquakes triggered by the M 7.1 thrust event. These two quakes appear to be aligned with the two northwest trends in seismicity and the 18 March 2020 M 5.2. The orientation of the mechanisms are not as perfectly well aligned, but there are lots of reasons for this (perhaps the faults were formed in a slightly different orientation, but have rotated slightly). There have been several series of intra-plate earthquakes in the Gorda plate. Two main shocks that I plot of this type of earthquake are the 1980 (Mw 7.2) and 2005 (Mw 7.2) earthquakes. I place orange lines approximately where the faults are that ruptured in 1980 and 2005. These are also plotted in the Rollins and Stein (2010) figure above. The Gorda plate is being deformed due to compression between the Pacific plate to the south and the Juan de Fuca plate to the north. Due to this north-south compression, the plate is deforming internally so that normal faults that formed at the spreading center (the Gorda Rise) are reactivated as left-lateral strike-slip faults. In 2014, there was another swarm of left-lateral earthquakes in the Gorda plate. I posted some material about the Gorda plate setting on this page.
Tectonic configuration of the Gorda deformation zone and locations and source models for 1976–2010 M ≥ 5.9 earthquakes. Letters designate chronological order of earthquakes (Table 1 and Appendix A). Plate motion vectors relative to the Pacific Plate (gray arrows in main diagram) are from Wilson [1989], with Cande and Kent’s [1995] timescale correction.
A: Mapped faults and fault-related ridges within Gorda plate based on basement structure and surface morphology, overlain on bathymetric contours (gray lines—250 m interval). Approximate boundaries of three structural segments are also shown. Black arrows indicated approximate location of possible northwest- trending large-scale folds. B, C: uninterpreted and interpreted enlargements of center of plate showing location of interpreted second-generation strike-slip faults and features that they appear to offset. OSC—overlapping spreading center.
Models of brittle deformation for Gorda plate overlain on magnetic anomalies modified from Raff and Mason (1961). Models A–F were proposed prior to collection and analysis of full-plate multibeam data. Deformation model of Gulick et al. (2001) is included in model A. Model G represents modification of Stoddard’s (1987) flexural-slip model proposed in this paper.
I will be filling this in over the next few days and wanted to start collating social media materials for this event. This week, CGS sent teams to various harbors & beaches on the California coast to collect measurements, photos, & videos documenting the effects of the Jan. 15 #tsunami from Tonga. This info helps us understand how future tsunami might impact our coastal harbors & communities. pic.twitter.com/xGa8zmNNNs — California Geological Survey (@CAGeoSurvey) January 21, 2022 #Tonga #Tsunami January 15 2022 — California Geological Survey (@CAGeoSurvey) February 2, 2022 After two weeks of work I can finally share my 3D reconstruction of the gigantic ash cloud from the January 15 Hunga #Tonga-Hunga-Ha'apai #eruption Parts likely reached *close to 60km* according to my reconstruction, that's beyond the stratosphere and inside the mesosphere!🧵 pic.twitter.com/qMzPSjZj7P — Simeon Schmauß (@stim3on) February 2, 2022 It is incredible to see how the #Andes bounced back part of the #Tonga atmospheric Lamb wave on its first cross over South America!. Here depicted with signal processed IR data from the GOES 16 geostationary satellite pic.twitter.com/OLM0MD0neO — diego aliaga (@diegoaliaga2) January 28, 2022 Excellent thread on how you can best help disaster relief efforts (and why) from someone who knows from professional experience. Donate $ (not 👠s) to reputable relief organizations. This is true for most disaster relief. https://t.co/zj6AIUuCZC — Tim Dawson (@timblor) January 16, 2022 Here's my radio interview on KCBS today.https://t.co/mwAnGWqy59 — Jason "Jay" R. Patton (@patton_cascadia) January 16, 2022 What lies beneath? Revealing the massive Hunga #caldera (5km diameter) below the water line, 3D model using elevation data @theAGU + bathymetrics @NOAA #Tonga #Blender pic.twitter.com/PmpVOfX8HD — frédérik ruys (@fruys) January 16, 2022 This is a truly excellent short article by @LoriDengler about yesterday’s #tsunami and eruption event. It makes it clear just how unique this was, and why the @NWS_NTWC folks had to improvise (brilliantly) to get the alert out. https://t.co/meypb1w2k9 — Harold Tobin (@Harold_Tobin) January 16, 2022 This is a small volcanic island but below the ocean the volcano is huge at around 1.8 km high and 20km wide. Much of the 2014-15 cone is now gone. Read more about what we know by @scronin70: https://t.co/nMNQYGcLDw pic.twitter.com/Ejn3z6e1I4 — Dr Janine Krippner (@janinekrippner) January 15, 2022 Scientists said the volcano had been puffing away for about a month before rising magma, superheated to around 1,000 degrees Celsius (1,832 Fahrenheit), met with 20 degree (68 Fahrenheit) seawater on Saturday, causing an instantaneous and massive explosion pic.twitter.com/iNVC2tB3XM — Reuters (@Reuters) January 19, 2022 An underwater volcano off Tonga erupted on Jan. 15, triggering tsunami warnings and evacuation orders in Japan and causing large waves in several South Pacific islands, where footage on social media showed waves crashing into coastal homes pic.twitter.com/L7uzK59jG7 — Reuters (@Reuters) January 19, 2022 Observations from Japan on why the far-field tsunami was likely triggered by air-sea coupling, not the standard shallow-water wave propagation from the source. https://t.co/70O5V095Xs — Harold Tobin (@Harold_Tobin) January 20, 2022 Why the ocean depth of the Hunga Tonga caldera created the 'sweet spot' that produced such an explosive eruption. Graphic based on research by @scronin70 https://t.co/D8ZBpAQkql pic.twitter.com/3gkDDZIqzm — Alistair Hamill (@lcgeography) January 21, 2022 Lessons from the Tonga Tsunami https://t.co/ZYPy87AzKW — CREW.org (@CascadiaEQ) January 25, 2022 New preprint out on ESSOAr – "Tonga eruption triggered waves propagating globally from surface to edge of space" – in which we look at the deeply unusual atmospheric waves generated by the recent Hunga Tonga eurption. pic.twitter.com/IJfMgb1Bt9 — Corwin Wright (@CorwinWright) March 3, 2022 *** California is in a NWS Tsunami "Advisory" – — California Geological Survey (@CAGeoSurvey) January 15, 2022 #Tsunami potential #AmericanSamoa #VolcanicEruption https://t.co/6bL0wRlNmX pic.twitter.com/QqLXC79pQK — Jason "Jay" R. Patton (@patton_cascadia) January 15, 2022 #TsunamiReport for #TsunamiAdvisory for the west coast of the USA & #Canada #Alaska #BritishColumbia #Washington #Oregon #California see https://t.co/rEduVE2EDc for more updates and recommendations pic.twitter.com/gLkB833R22 — Jason "Jay" R. Patton (@patton_cascadia) January 15, 2022 #TsunamiAdvisory remains in effect for the #WestCoast, with peak tsunami wave heights of 1 to 3 feet possible. Main impacts expect to be strong rip currents and coastal flooding of some immediate coastal low-lying areas. #CAwx — NWS Eureka (@NWSEureka) January 15, 2022 #Tsunami expect to reach #SanFrancisco around 8:10 am this morning, which will correspond with #HighTide for #SanFrancisco at 9:09 am. Expect low lying inundation and minor flooding possible, especially for areas like #MarinHeadlands. #Cawx pic.twitter.com/PoR3WYZ13D — NWS Bay Area (@NWSBayArea) January 15, 2022 #Tsunami expect to reach #SanFrancisco around 8:10 am this morning, which will correspond with #HighTide for #SanFrancisco at 9:09 am. Expect low lying inundation and minor flooding possible, especially for areas like #MarinHeadlands. #Cawx pic.twitter.com/PoR3WYZ13D — NWS Bay Area (@NWSBayArea) January 15, 2022 #TsunamiAdvisory remains in effect for the #WestCoast, with peak tsunami wave heights of 1 to 2 feet possible. Main impacts expect to be strong rip currents, coastal flooding, and inundation of low lying areas is possible. Move to higher ground. #CAwx — NWS Bay Area (@NWSBayArea) January 15, 2022 A Tsunami Advisory has been issued for Humboldt Co. due to volcanic activity in the S. Pacific. A tsunami capable of producing strong currents that may be hazardous to swimmers, boats and coastal structures is expected beginning 7:30-8 a.m. Widespread inundation is not expected. — Humboldt Co OES (@HumCoOES) January 15, 2022 Wow. Evacuation orders for Berkeley and Albany west of hwy. pic.twitter.com/dRvaSkCLwa — Cian Dawson 🏳️🌈 (@cbdawson) January 15, 2022 #SF remains in a Tsunami Advisory Strong, dangerous currents WILL be present. Stay out of water and away from coastal areas. pic.twitter.com/nMYm0wxvPA — SAN FRANCISCO FIRE DEPARTMENT MEDIA (@SFFDPIO) January 15, 2022 We continue to monitor the #Tsunami closely. Please listen to local advisories — stay safe and off beaches that are under a warning. https://t.co/M1QdOhBleG — Gavin Newsom (@GavinNewsom) January 15, 2022 Great resource for the #Tongaeruption tsunami arrival times, amplitudes, and r/t tide gauge observations.https://t.co/XOESHxHSuX pic.twitter.com/StO7eQo4Dh — Peter de Menocal (@PdeMenocal) January 15, 2022 I did an interview about an hour ago summarizing what's going on for Washington coastal areas. #tsunami https://t.co/V3qFtCFTkH — Harold Tobin (@Harold_Tobin) January 15, 2022 #TsunamiReport for the #TongaVolcano #TongaTsunami observations of #Tsunami in the #Caribbean #Atlantic #GulfOfMexico no action required use https://t.co/rEduVE2EDc to see notifications and recommendations pic.twitter.com/OrhBzGOASY — Jason "Jay" R. Patton (@patton_cascadia) January 15, 2022 #TsunamiReport for #TongaTsunami #Tsunami advisories have all been cancelled for the west coast of the US & Hawai'i from https://t.co/rEduVE2EDc the [#mostimportant] first level Blooms Taxonomy for learning = #Discovery this event will not disappoint in this regard #StayTuned https://t.co/z8LpWAAOI7 pic.twitter.com/4zSgmpH9rX — Jason "Jay" R. Patton (@patton_cascadia) January 16, 2022 Update from Tongans on FB… clean up begins, #tsunami alert remains, masks advised. Stay safe, stay alert 🙏 #Tonga #tsunamitonga #TongaVolcano pic.twitter.com/GGxIw0Kw0u — Josephine Latu-Sanft (@JoLatuSanft) January 16, 2022 There has been another eruption from the volcano in Tonga. — National Weather Service WSO Pago Pago (@NWSPagoPago) January 16, 2022 Tonga Volcanic Eruption and Tsunami: World Bank Disaster Assessment Report Estimates Damages at US$90M https://t.co/bx6Iq5VTyb via @WorldBank — Jason "Jay" R. Patton (@patton_cascadia) March 7, 2022 ➡️https://t.co/ZDdvztAIKj https://t.co/oNuTw3G5s9 pic.twitter.com/LsA3PfAoJq — California Geological Survey (@CAGeoSurvey) January 17, 2022 A #Tsunami Advisory means: a dangerous wave is on the way. Strong and unusual currents are expected along the coast, and in bays, marinas, and harbors. Move to high ground and away from the shore. More at https://t.co/npoUHxEZLS. pic.twitter.com/MCLDdN9qPp — NWS Tsunami Alerts (@NWS_NTWC) January 15, 2022 #Tsunami INFO CA Tsunami Preparedness Guide website: https://t.co/UB3BAS55Pz — Nick Graehl (@nickgraehl) January 15, 2022 yes, don't forget to check out the #Tsunami Hazard Areas (where people might want to evacuate from during a tsunami event) for #California are available at https://t.co/9LPXadKWEi these are produced by the #CaliforniaTsunamiProgram a collaboration between @Cal_OES & @CAGeoSurvey pic.twitter.com/IaC13oef9b — Jason "Jay" R. Patton (@patton_cascadia) January 15, 2022 There are a number of #Tsunami HAZARDS that could directly impact harbors and boaters: continued… pic.twitter.com/1BRSOnjmYC — Nick Graehl (@nickgraehl) January 15, 2022 If you want to interact with all the tide gage data, here’s the NOAA interactive website that is pretty great!https://t.co/2SsAokmaB3 https://t.co/PMMLH35BJv pic.twitter.com/6nrXmekebL — Ryan Hollister (@phaneritic) January 15, 2022 Tsunami arrival + high tide = maximum wave run-ups pic.twitter.com/6mjQltYO45 — Brian Olson (@mrbrianolson) January 15, 2022 The #tsunami warning centers post all their messages to https://t.co/Em3fOFG82S. If you live on the US West Coast, Alaska, or British Columbia, make sure you check the messages for your region. pic.twitter.com/AJtJN9oZWg — Dr. Amy Williamson-Liuzzo (@AWilliamsonSci) January 15, 2022 If you're having a hard time interpreting news about this tsunami advisory — what the danger is and where — @DaveSnider breaks it down really well in this video on the warning center's facebook page.https://t.co/tHsstcS5xl — Ian Dickson (@IanJDickson) January 15, 2022 First signs of damage in the upper harbor. #santacruz. pic.twitter.com/p26hdpnSOn — Tim Cattera Photo (@TimCatteraPhoto) January 15, 2022 The Hunga Tonga-Hunga Ha'apai volcanic eruption was heard here in Alaska starting around 3:30 a.m. – 6,000 miles from the volcano! Infrasound measurements from the @alaska_avo confirm that it was indeed coincident with the volcanic pressure wave. Special thanks to Dr. David Fee. pic.twitter.com/Wp4tnwiaud — NWS Alaska Region (@NWSAlaska) January 15, 2022 2. Tsunamis are not one wave. It's more like sloshing and that sloshing can continue for a day. Just because the first wave has passed, it is not time to go see the beach. — Dr. Lucy Jones (@DrLucyJones) January 15, 2022 Don't be these people. Today is not the day for it. Stay off the coastal beaches and jetties. #wawx pic.twitter.com/4o0fhpJei8 — NWS Seattle (@NWSSeattle) January 15, 2022 Wondering why you didn't get an alert about the #Tonga tsunami and the #TsunamiAdvisory in WA this morning? There are many ways to get tsunami alerts and it's best to be signed up for many kinds! Learn more about tsunami alerts (and other hazard alerts) at https://t.co/iU0UZFRnC2 pic.twitter.com/aRkJ2CKB32 — Washington ShakeOut (@waShakeOut) January 15, 2022 After checking with @LoriDengler, I think that today is the first-ever Pacific-wide #tsunami alert from a volcanic eruption. Interestingly, the warning center needed an earthquake magnitude to issue the bulletin. So they made one up: mag 0.1! (Now changed to mag 1) pic.twitter.com/znjfUa1o3S — Harold Tobin (@Harold_Tobin) January 15, 2022 This was not your run of the mill way a #tsunami is generated. Most often its from plates shifting abruptly on the sea floor. This tsunami was essentially caused by a massive underwater explosion of molten rock and lava that displaced the water above it. pic.twitter.com/JyLwZYHcRp — NWS Los Angeles (@NWSLosAngeles) January 15, 2022 Not sure I have ever seen this before. My @noaaocean colleague just flagged this. The pressure wave caused by the #TongaVolcano is also actually causing a tsunami – in this case a meteotsunami of about 10cm in Puerto Rico. Wild. pic.twitter.com/EapEuNhjB5 — Greg Dusek (@DrGregDusek) January 15, 2022 A #volcano just erupted near #Tonga – but why was it there in the first place? Tonga sits on top of the #TongaKermadec #subductionzone, where the #PacificPlate sinks below the #AustralianPlate. The subducting #PacificPlate carries the culprit into the mantle: #water. 🧵1/3 https://t.co/Z1ORgcBK5l pic.twitter.com/XN5cUCT8Yg — Dr. Judith Hubbard (@JudithGeology) January 15, 2022 Fascinating part of the tsunami warning process today: This wasn't an earthquake, so the tsunami warnings were sent out with a default magnitude of 1. Shows that our whole system is set up for earthquake tsunamis. 1/2 pic.twitter.com/pwsBuicyyX — Jackie Caplan-Auerbach (@geophysichick) January 16, 2022 Be #prepared for tsunamis. — John Cassidy (@earthquakeguy) January 16, 2022 If you’re not already following all these great folks, then do yourself a favour and follow them. I’d also add to the list:@heatherkhandley @SquigglyVolcano @Volcanologist @VolcanoDoc@scarlett_jazmin@simoncarn https://t.co/RrfVVNGmQf — Mark Tingay (@CriticalStress_) January 17, 2022 Interactive Tsunami Flood Risk Map Asks: Are You in the Zone? https://t.co/WnvKidKNjE — Jason "Jay" R. Patton (@patton_cascadia) January 17, 2022 Great questions here about hydrophones as a tool to monitor submarine volcanism. This is my favorite topic, so @syabilazriAS is going to get a longer answer than maybe was desired. 😆🧵 https://t.co/VcbgmUEnZn — Jackie Caplan-Auerbach (@geophysichick) January 18, 2022 The highest concentration of sulfur dioxide (SO2) in the world right now is over the Pacific 📈 This is associated with the eruption of the Hunga-Tonga-Hunga-Ha'apai volcano 🌋 🧵 on what this means… pic.twitter.com/yjgT0yWdL8 — NIWA Weather (@NiwaWeather) January 17, 2022 For additional information on #TsunamiPrep check out "The TsunamiZone" @thetsunamizone and https://t.co/o336WXPPqj pic.twitter.com/dE1QT3QSPc — California Geological Survey (@CAGeoSurvey) January 17, 2022 High tide is around 9:30 AM along the Northwest California coast. Even though the initial wave is expected 7:30 AM to 8 AM, additional waves and strong currents will continue. As much as 3 feet of tsunami wave is expected. Stay back from the beaches and lowest-lying areas. #CAwx pic.twitter.com/BmoCVtJc2f — NWS Eureka (@NWSEureka) January 15, 2022 WATCH: Tsunami from Tonga volcano eruption starting to cause minor flooding in Santa Cruz, California pic.twitter.com/ELq8IKMEUV — BNO News (@BNONews) January 15, 2022 tsunami waves & high tide sloshing around west cliff. #MitchellsCove pic.twitter.com/yW2GLnFWzp — Dustin Mulvaney (@DustinMulvaney) January 15, 2022 Monterey Tide Station #Tsunami — Nick Graehl (@nickgraehl) January 15, 2022 #Tsunami observation update: — NWS Tsunami Alerts (@NWS_NTWC) January 15, 2022 Tsunami energy arriving at Del Monte Beach. Wave run up onto the beach is impressive. I'm safely distanced, but I saw other folks have to scramble when the waves unexpectedly reached them. Follow @NWSBayArea for #tsunami safety info. pic.twitter.com/JRl2XsTftI — Brooke Bingaman (@BrookeBingaman) January 15, 2022 Seeing some surges on the Port San Luis tsunami gauge. Reporting up to a 24 cm residual so far. That's 9.4 inches or about 19 inches from the bottom and top of the residual. More at https://t.co/SGd8WQoeji. #tsunami pic.twitter.com/bKYRRXuW4W — NWS Los Angeles (@NWSLosAngeles) January 15, 2022 Another huge surge in the back harbor. Bigger than the first one. #santacruz pic.twitter.com/gzzBmrq9dh — Tim Cattera Photo (@TimCatteraPhoto) January 15, 2022 Strong surge coming in now from #Tsunami in #RichmondCA at Meeker Slough mouth at the Bay. Highest level yet. Wild. pic.twitter.com/fevg14KZrX — Kenya Wheeler (@kenyaw) January 15, 2022 Made it to the high ground edge (6 feet+ above high water level) at Meeker Slough meets the SF Bay. Another observer tells me she has seen two surges already. Check the bridge piling for the high water mark from an earlier surge. pic.twitter.com/Vv8O00SLBF — Kenya Wheeler (@kenyaw) January 15, 2022 So far, business as usual at the Ferry Building, which sits above the expected tsunami surge. High tide in SF is at 9:25. It is probably just my imagination that the bay looks more unsettled this morning. pic.twitter.com/GkkSUSbBgY — Tim Dawson (@timblor) January 15, 2022 As usual, tsunami looks big in Crescent City, CA–waves still incoming. pic.twitter.com/iD0CSBV84O — Jackie Caplan-Auerbach (@geophysichick) January 15, 2022 Here is the current look at Half Moon Bay. You can see Pillar Point Harbor Patrol in the distance. #CaWx #California @sanmateoco @SMHarbor @NWSBayArea pic.twitter.com/z5HHnECtTE — CAL FIRE CZU (@CALFIRECZU) January 15, 2022 #TsunamiAdvisory for #SanFrancisco & #USWestCoast continues. @NWSBayArea reports #tsunami has already resulted in rapid swings up to 3 feet above/below forecast tidal level, or about 6 feet change in 30-60 minute intervals. https://t.co/PDR9BUlsMa #SFwx #CAwx #tongatsunami — Edie Schaffer, CEM (@sf_edie) January 15, 2022 10 AM | Here are the latest observed tsunami wave heights from along the West Coast of the US. Generally tsunami wave heights have been around 1 foot or less along the Oregon and Washington coast. (1/2) pic.twitter.com/r94If9ODXM — NWS Portland (@NWSPortland) January 15, 2022 Video from Cassidy Gillin of waves thrashing near the O’Neill lounge in Santa Cruz. Basic message for the day: don’t be brave. Stay away from the coast @KION546 pic.twitter.com/ieqK9nJ28A — Victor Guzman KION (@VGuzman_TV) January 15, 2022 From a friend at Santa Cruz Harbor @NWSBayArea @Weather_West pic.twitter.com/ZUgfXcbSxw — Dylan (@hamilton4391) January 15, 2022 The landing inundated here is 20 steps up. pic.twitter.com/zfU1XUoMhi — Dustin Mulvaney (@DustinMulvaney) January 15, 2022 This wave climbed up 15 steps higher to the next landing. #CAwx #TsunamiWarning pic.twitter.com/dyRPHjBArP — Dustin Mulvaney (@DustinMulvaney) January 15, 2022 Current look at Surfer’s Beach in El Granada #CaWx #California Stay on higher ground. @NWSBayArea @SMHarbor pic.twitter.com/MMwkMXXr8R — CAL FIRE CZU (@CALFIRECZU) January 15, 2022 The scene at the Santa Cruz Harbor as a tsunami generated tidal surge causing damage Saturday morning #TsunamiAdvisory pic.twitter.com/9ijKU9ZVaK — Vern Fisher (@VFisher45) January 15, 2022 Another surge and it’s now receding once again. Not as high as the first one. #santacruz pic.twitter.com/JIKfhxvZrM — Tim Cattera Photo (@TimCatteraPhoto) January 15, 2022 SURFERS EVACUATED | A surf competition was canceled and surfers were evacuated from the ocean in Santa Cruz due to the tsunami. https://t.co/8sAslNmUko pic.twitter.com/dmfKkEGzFE — KSBW Action News 8 (@ksbw) January 15, 2022 Here's the latest observed heights over tidal predictions along the West Coast pic.twitter.com/qj6pcrIS5r — NWS Eureka (@NWSEureka) January 15, 2022 The tsunami advisory remains in effect. High tide occurred through the morning, and total water levels are decreasing, lowering risk of coastal flooding, but rapid fluctuating surges of water onto and off of the coast/strong currents will continue thru the remainder of the day. pic.twitter.com/5ylsGGvr0m — NWS Bay Area (@NWSBayArea) January 15, 2022 #TSUNAMI water is literally draining out of #ventura harbor. @KTLAnewsdesk @KCBSKCALDesk @KEYTNC3 @vcstar @ABC7Desk @WeatherNation @805Weather @Weather_West @NWSLosAngeles pic.twitter.com/Tjccw1k613 — FireOFire (@FireOFire) January 15, 2022 Here are the latest maximum observed wave heights. Highlights for our area include 3.7 feet at both Crescent City and Arena Cove. The advisory continues for the West Coast, stay tuned to the latest updates on the advisory from @NWS_NTWC pic.twitter.com/UYwFWWLGWd — NWS Eureka (@NWSEureka) January 15, 2022 @Ocean_Networks #knowtheocean sensors tracked the Tonga tsunami wave as it travelled across 🇨🇦’s offshore lands. Data also provided to @NOAA tsunami alert system. pic.twitter.com/MMfjvUrM3b — Dr. Kate Moran (@katemoran) January 15, 2022 Soquel Creek in Santa Cruz flowing *backwards* because of a tsunami 🤯 pic.twitter.com/JxFsllhhdX — robwormald (@robwormald) January 15, 2022 This is from up Soquel Creek pic.twitter.com/ySRF6Okh8o — Kristen (@KRice7) January 15, 2022 #ventura #TsunamiAdvisory #tsunamitonga pic.twitter.com/JqTOqZk9Yf — MJ (@mbearwoman) January 15, 2022
#TsunamiReport for #Tonga #Tsunami recorded on @NOAA tide gages in #California #TongaTsunami #TongaEruption pic.twitter.com/wV6FThMELO — Jason "Jay" R. Patton (@patton_cascadia) January 19, 2022 Tsunami surge up the mouth of San Luis Creek at Avila Beach (Port San Luis) #tsunami — Brian Olson (@mrbrianolson) January 21, 2022 Santa Cruz Harbor back on solid footing post-tsunami, but long-term repairs loom https://t.co/uh5iiPMA8j <– Max Chun with the update on @SantaCruzHarbor after Saturday's #tsunami pic.twitter.com/8kryBrCfc5 — Lookout Santa Cruz (@LookoutSCruz) January 21, 2022 Neskowin, Oregon this morning! #tsunamitonga #TSUNAMI pic.twitter.com/YQJjaFL5w1 — retelling•the•recipe (@tiggirltk) January 15, 2022 #tsunami in #DepoeBay pic.twitter.com/aknFfQkRnk — jim (@jimfromoregon) January 15, 2022 1145 AM Update | The largest waves have spared much of the Oregon Coast so far. Tsunami wave observations so far include… 24 cm (.8 ft) at Charleston, OR (1/2) — NWS Portland (@NWSPortland) January 15, 2022 Unexpected #Tsunami #HungaTongaHungaHaapai #Tsunami #Tonga #Earthquake pic.twitter.com/p16v9c0zLt — Journalist Siraj Noorani (@sirajnoorani) January 15, 2022 Stay safe everyone 🇹🇴 pic.twitter.com/OhrrxJmXAW — Dr Faka’iloatonga Taumoefolau (@sakakimoana) January 15, 2022 The #HungaTongaHungaHaapai eruption is showing up in the tide gauge records at Suva, Apia, Rarotonga and Funafuti. Below is the real time data for the Suva tide gauge. https://t.co/2qBzfVsSJz pic.twitter.com/DXeccmsNw2 — Murray Ford (@mfordNZ) January 15, 2022 Tide gage in American Samoa registering the tsunami created by the Tonga submarine volcanic eruption. Peak amplitude so far is 0.74 meter (~2.5 feet). pic.twitter.com/ATsmnP5clg — Brian Olson (@mrbrianolson) January 15, 2022 ~ 2 Meter #Tsunami in Nuku'alofa, Tonga nach der erneuten heftigen Explosion des Hunga Tonga-Hunga Ha'apai Vulkans. Die ersten Wellen haben auch Fidschi erreicht. Ich hoffe, die seit gestern bestehende Tsunami-Warnung wurde ernst genommen https://t.co/akfdQqtrP7 pic.twitter.com/b90hbS4oTW — Jens Skapski (@JensSkapski) January 15, 2022 For any New Zealand tsunami updates during the Tonga Hunga Tonga-Hunga Ha'apai eruption go here: https://t.co/y020MigfFn — Dr Janine Krippner (@janinekrippner) January 15, 2022 Here are @BOM_au’s latest observations on the waves #Tonga #tsunami 👇 While a 1m wave might not sound big, tsunami have much longer periods (the time between each wave) than wind waves so even a 1m wave can cause significant damage and flooding! pic.twitter.com/27DoahlJEb — A/Prof Hannah Power (@DrHannahPower) January 15, 2022 And same @BOM_au #Tonga #tsunami data again for #NorfolkIsland. Lots of waves and some very big ones! Worth remembering that a #tsunami is more often a series of waves lasting several hours and not just one wave. https://t.co/YH44vAozIG pic.twitter.com/qNmvPc8akD — A/Prof Hannah Power (@DrHannahPower) January 15, 2022 #TsunamiReport for observations of #Tsunami from Tonga volcanic eruption in #CrescentCity #California for recommendations and updates head to https://t.co/rEduVE2EDc for more information the entire west coast of the USA is under a tsunami advisory pic.twitter.com/PJBwLsS7jN — Jason "Jay" R. Patton (@patton_cascadia) January 15, 2022 The plot shows water level data from Honolulu, Hawaii. It indicates that the tsunami continues to impact the Hawaiian islands at least 7 hours after initial arrival. Expect a similar, long duration event along our coast and bays today. pic.twitter.com/LfaS7O8u3A — NWS Bay Area (@NWSBayArea) January 15, 2022 El Servicio Mareográfico del Instituto de Geofisica de la UNAM, muestra que el puerto de #Manzanillo, #Colima muestra el arribo de las olas del #tsunami. pic.twitter.com/nYPJRck9N2 — Alejandro S. Méndez ⚒️ (@asalmendez) January 15, 2022 Muy buena foto !! Interesante comparar los efectos con lo que observa el mareógrafo. Este indica 40 a 60cm de desviación respecto de valores medios. El tsunami sigue en desarrollo. Gracias !! pic.twitter.com/f4WzPs2sMn — Luis Donoso (@Geo_Risk) January 15, 2022 16日午前0時半前、津波注意報が出されている高知県土佐清水市の港の映像からは、海面が上下するのにあわせて係留されている船がゆっくりと上下したり左右に揺れたりしている様子が確認できます。https://t.co/5plmIcphz6#nhk_video pic.twitter.com/2spq3znm6c — NHKニュース (@nhk_news) January 15, 2022 WATCH: Tsunami from Tonga's volcano eruption causes flooding in northern Chile pic.twitter.com/SQ8wtnM06i — BNO News (@BNONews) January 15, 2022 Small but powerful #tsunami surges reached Currarong Creek on NSW south coast between 7-8am this morning pic.twitter.com/7BteF0fhg2 — Casey Kirchhoff (@gumnut_case) January 15, 2022 😲 this video is pretty crazy.. shows the #Tsunami pushing the water up canals in #Chile 🇨🇱 Shows the power of the ocean.. 🎥 @SouthPatriotCL #Tonga #Chili #HungaTonga #HungaTongaHungaHaapai #MotherNature #TsunamiWarning #SouthAmerica pic.twitter.com/FUBzMRws12 — Bryce Campbell🤷🏻♂️ (@BCampbell_24) January 15, 2022 🌊 #Tsunami …sea is receding at Playa de Los Molles in the Valparaíso region of #Chile 🇨🇱 in South America 🤯 🎥 @AgenciaQuinta #HungaTongaHungaHaapai #MotherNature #TsunamiWarning #NationalTsunamiWarning #Earthquake #TsunamiAdvisory #SouthAmerica pic.twitter.com/4X0PVMZLtD — Bryce Campbell🤷🏻♂️ (@BCampbell_24) January 15, 2022 Footage from Niue… crazy sea activity at Sir Robert’s Wharf, Alofi Bay following the #HungaTonga volcanic eruption.. 🌊 🇹🇴#Volcano #Tonga #HungaTonga #HungaTongaHungaHaapai #underwater #Tsunami #Oceania #MotherNature pic.twitter.com/Qptj4yf36q — Bryce Campbell🤷🏻♂️ (@BCampbell_24) January 15, 2022 Timelapse video of the #tsunami taken at Mogareeka inlet at 7-7:20am this morning. Tide is rising (flow left to right) but here is what happens as the waves come through. Mogareeka is usually very flat so the effects are amplified @anuearthscience @ourANU pic.twitter.com/y00Tj1iFb3 — Louis Moresi (@LouisMoresi) January 15, 2022 Urgente Marejadas destruyeron otro muelle en Las Coloradas sector Isla del Rey comuna de Corral, los ríos. — (@EarthquakeChil1) January 15, 2022 A #tsunami is occurring. Tsunami Advisories have been ended for portions of Southcentral and Southeast Alaska- they continue elsewhere. See https://t.co/npoUHxWBas for the latest. — NWS Tsunami Alerts (@NWS_NTWC) January 15, 2022 Some first pics coming out of #Tonga post #Tsunami #volcanoEruption This is in the outer islands Pangai, Haapai. Roads ripped up. Seems some of those massive chunks are pieces of the seawall. #tongatsunami #TongaVolcanoEruption — Josephine Latu-Sanft (@JoLatuSanft) January 16, 2022 https://t.co/Xw7BUtepv4 article with early news about what is happening inside Tonga. Communications are difficult. Tonga volcano: Photos and video give first glimpse of tsunami's impact https://t.co/j5LDZ3B6lP — Dr. Eric J Fielding, PhD (@EricFielding) January 16, 2022 We knew there would be tragedy associated with this event, but seeing it is dreadful. My thoughts are with the Tongan people. https://t.co/eFSbDYRzWE — Jackie Caplan-Auerbach (@geophysichick) January 17, 2022 1Hz microbarograph data from the @geoscope_ipgp seismographic station at Tamanrasset, Algeria https://t.co/2UcaNmFzvShttps://t.co/8PeWmn2OxL pic.twitter.com/tVyMeCnWZV — Anthony Lomax 😷💉🇪🇺🌍 (@ALomaxNet) January 17, 2022 Eruption update: Parts of the Hunga Tonga-Hunga Ha'apai conjoined island that sat atop the largely underwater volcano could be seen via satellite. In December, the eruption caused it to expand in size. Just prior to the blast, it shrank again. Today? It's all but vanished. https://t.co/k5IjZLq5cE — Dr Robin George Andrews 🌋 (@SquigglyVolcano) January 17, 2022 1/n Lot of damages and very complicated aftermath in Tonga islands. — Robin Lacassin (@RLacassin) January 18, 2022 Offical announcement from the Government of Tonga. Tragically, 3 people confirmed to have died. Also, while there are many satellite images coming out showing the awful eruption impact, please be compassionate and considerate to those impacted or awaiting news of loved ones. https://t.co/Vw2SfHEHjh — Mark Tingay (@CriticalStress_) January 18, 2022 Here is a map depicting damage in the islands of #Tonga from the huge eruption of Hunga Tonga-Hunga Ha’apei #volcano, derived from #sentinel1 #sar data. Our hearts are with the people of Tonga. More information and kml at https://t.co/uxKeZHJ0ix pic.twitter.com/shEl0xOV33 — EOS Remote Sensing (@eos_rs) January 18, 2022 .@patton_cascadia @VolcanoSimon 🤔 Can @CopernicusEU #Sentinel1 wave field and timing tell us any thing about what may have happened underwater around Hunga Tonga ? https://t.co/8yNbj5Lk0x — DPManchee (@DPManchee) January 19, 2022 Three days after the disastrous eruption of the #HungaTonga #volcano, #Tonga is still isolated@CopernicusEMS has been activated ⬇️The effects of the explosion on Nomuka Island are visible when comparing the #Sentinel2 🇪🇺🛰️images of — 🇪🇺 DG DEFIS #StrongerTogether (@defis_eu) January 18, 2022 Distance was no barrier to providing critical real-time #tsunami data following Saturday's #TongaEruption. 9000km from this rare underwater #volcano event, our #UVic #knowtheocean sensors informed @NWS_PTWC alerts and will inform future research. Read: https://t.co/FPECte9dP1 pic.twitter.com/DJX6z2pUPp — Ocean Networks 🇨🇦 (@Ocean_Networks) January 19, 2022 🇹🇴The miracle survival of a 57-year-old disabled man who survived in the ocean for 27 hours after being swept away by a tsunami wave is one of the first astonishing accounts to emerge from Tonga Thread🧵👇https://t.co/m5uaVTFnoT pic.twitter.com/87n3TUs0T0 — Telegraph World News (@TelegraphWorld) January 20, 2022 This map, based on #alos2 #sar satellite data, shows the devastating impact of the huge #Tonga volcanic eruption. Damaged areas are marked by yellow to red pixels, with red indicating the most damage. More info, GeoTIFF and KMZ files at https://t.co/uxKeZHJ0ix pic.twitter.com/2xSSZeYVbH — EOS Remote Sensing (@eos_rs) January 23, 2022 — Ailsa Naismith (@AilsaNaismith) February 1, 2022 Quite the day at the beach sampling the January 2022 Hunga tsunami deposits- if you squint there are ?3 slightly different grainsize layers here – plus thin black layer of ash near the top, western Tongatapu pic.twitter.com/oZcEPGxeO6 — Shane Cronin (@scronin70) April 6, 2022 Extracting oriented tubes of tsunami deposits will help colleagues figure out deposition histories using 3D magnetic and textural properties- Hunga tsunami deposits – western Tongatapu pic.twitter.com/ojcoi9kiSP — Shane Cronin (@scronin70) April 6, 2022 Tonga tsunami, quite impressive that it propagated all the way to stations in the coast of Mexico (Manzanillo over 1.4m) and California… Here is a order one attempt to model this tsunami @geosmx #geoclaw pic.twitter.com/drzz5GMHJK — angel ruiz (@angelruizangulo) January 15, 2022 Ash plume extent update for Hunga Tonga-Hunga Ha'apai eruption in Tonga. — Dr Janine Krippner (@janinekrippner) January 15, 2022 Truly incredible imagery from the Himawari meso sector of multiple shockwaves from a volcanic eruption on Tonga propagating through what was recently subtropical storm Cody. My back of the napkin math estimates put the shockwave speed somewhere in the vicinity of 500-600 mph. pic.twitter.com/lDyNXFpLbE — Isaac Schluesche (@SlushyWx) January 15, 2022 Find the eruption. 🌋 pic.twitter.com/0xUWE8spzh — Brian Brettschneider (@Climatologist49) January 15, 2022 Tonga's Hunga Tonga volcano just had one of the most violent volcano eruptions ever captured on satellite. pic.twitter.com/M2D2j52gNn — US StormWatch (@US_Stormwatch) January 15, 2022 This volcano eruption is producing some sights we won't see on satellite for a while after. The explosive updraft powers right into the stratosphere, and the warming with height there makes the blob appear warm/shallow. There's also the shockwave and condensation pushing NE pic.twitter.com/6ud79uws9w — Alex Boreham (@cyclonicwx) January 15, 2022 1.14.2021: Large volcanic eruption near Tonga (Hunga Tonga-Hunga Ha'apai volcano) today as seen from outer space. Shown on visible imagery using the Himawari satellite. #hiwx #tsunami #earthquake pic.twitter.com/zOTj6Qu1Wv — NWSHonolulu (@NWSHonolulu) January 15, 2022 Shock wave from the big eruption of Hunga-Tonga-Hunga-Ha'apai today seen on @raspishake infrasound station in Auckland. Time on bottom is UTC+8 – add 5 hours to get local time in New Zealand. pic.twitter.com/e6Ns7gLGS7 — Mark Tingay (@CriticalStress_) January 15, 2022 Fantastic #infrasound signals on the Australian IMS arrays from the #Tonga #volcano. Data courtesy of @GeoscienceAus and made available via @IRIS_EPO – these atmospheric waves travel much slower than seismic waves and over an hour separates the signals on mainland Australia. pic.twitter.com/7A8KUZdA22 — Dr. Steven J. Gibbons (@stevenjgibbons) January 15, 2022 The pressure wave from the Hunga Tonga-Hunga Ha'apai eruption arrived here in Anchorage at 3:30 a.m. AKST. This is exactly 7 hours after the eruption. The volcano is 5,820 miles away (9,360 km). That means it travelled at 830 mph (1,340 kmh). pic.twitter.com/R3rgzAbo6r — Brian Brettschneider (@Climatologist49) January 15, 2022 Seismogram from Monasavu, Fiji ~800km NW of Hunga Tonga-Hunga Ha'apai eruption. Assuming main eruption at ~04h15mUTC, shows P waves, seismic surface waves (Lq, Lr) and oceanic SOFAR acoustic waves (T). Signal from the eruption continues for 2+ hours.https://t.co/etU65z1wyq pic.twitter.com/2PublssOYm — Anthony Lomax 😷💉🇪🇺🌍 (@ALomaxNet) January 15, 2022 A number of folks have posted similar obs, but here are two pressure traces showing the #HungaTongaHungaHaapai shock wave observed at UNR in Reno and UoU in Salt Lake City this morning. The SLC data seem to show subsequent oscillations (sloshing) in the valley cold pool. #UTwx pic.twitter.com/ekDRXUUrq8 — Neil Lareau (@nplareau) January 15, 2022 A similar pressure bump was observed in Portland, Oregon early this morning as well. See the right hand column in the attached 5 minute data from the Portland Airport. #ThePowerOfTheVolcanoEruption #pdxtst #orwx #wawx https://t.co/ITFTtfbEwM pic.twitter.com/T2dXs2zqf5 — NWS Portland (@NWSPortland) January 15, 2022 Here's the latest eruption. Again ice detectable. This time ash signal appearing. Plume appears to be significantly stronger than the last one. I've set the colour bar and scale to try to highlight the tropospheric and stratospheric portions of the plume (top left plot). pic.twitter.com/zRaFvG2jvJ — Andy Prata (@andyprata) January 15, 2022 6 hours of infrared satellite in 4 seconds. You can see the atmospheric shock wave ripple out Pacific-wide after the initial #eruption in #Tonga (quite hard to see but it crosses #Hawaii and #Australia). People as far away as Southland in #NewZealand reported hearing the booms. pic.twitter.com/a0YHx4Q0q0 — WeatherWatch.co.nz (@WeatherWatchNZ) January 15, 2022 A @planet SkySat image appears to have been acquired ~2 hours *before* the 04:00 UTC 15 Jan 2022 #HungaTongaHungaHaapai. The whole central part of the island was missing, probably blown up in the 14 Jan 2022 explosions. @janinekrippner @SmithsonianGVP @rsimmon pic.twitter.com/5Vtuu1fOvV — Raphael Grandin (@RaphaelGrandin) January 15, 2022 #Tonga 🇹🇴🌋 Antes y después #HungaTongaHungaHaapai Una reciente imagen tomada por los satélites de #SkySat propiedad de Planet Labs. muestra que el corredor de tierra que existía desde 2014 entre las islas desapareció después de las erupciones cataclísmicas de ayer. pic.twitter.com/2fM8rwNPZS — Alejandro S. Méndez ⚒️ (@asalmendez) January 15, 2022 That map, created with April 2016 data from the R/V Falkor, showed details of the overall volcanic edifice. Measured on this quick Google Earth overlay, the diameter of the caldera rim is ~6 km. Recent eruptions have been on the N and NE sides. Red * is 2009 vent. pic.twitter.com/oPdKMR44G3 — Global Volcanism Program (@SmithsonianGVP) January 15, 2022 We now have some one-minute infrared imagery of the ongoing eruption, via GOES-17. pic.twitter.com/ZxdhVqxWqU — Dakota Smith (@weatherdak) January 15, 2022 Jumping on board pressure perturbation Twitter to share this animation of @okmesonet pressure data. Several pressure waves created by the Hunga Tonga–Hunga Ha'apai volcano eruption in Tonga passed from southwest to northeast across Oklahoma between 7 and 9 AM CST this morning. pic.twitter.com/aBpRXNbNeX — Tim Supinie (@plustssn) January 15, 2022 Shockwave from the #HungaTongaHungaHaʻapai eruption visible as an abrupt pressure change across the @UVicSEOS Climate Network at about 4 a.m. this morning https://t.co/J6FhLuG6C6 @edwiebe @AJWVictoriaBC @UVicScience pic.twitter.com/LIowFgAssj — Dr. Edwin Nissen (@faulty_data) January 15, 2022 A Planet SkySat captured an image of Hunga-Tonga Hunga-Ha’apai today at 2:25 UTC, just two hours before its violent eruption that triggered a tsunami. Read @tanyaofmars' latest blog for more details on our monitoring of the volcano: https://t.co/8MdAAnopeK pic.twitter.com/RG68ADVSEV — Planet (@planet) January 15, 2022 Tonga tsunami is arriving at BC! Last twelve hours of seafloor pressure data show: Series of waves, starting to arrive at @Ocean_Networks stations at 8:22 PST, and at the west coast about 9 AM PST. Height about 5 cm offshore. Coastal currents probably a bigger issue. #BCTsunami pic.twitter.com/VpEzXymHB3 — Martin Scherwath (@mscherwath) January 15, 2022 1-min CG lightning plot of #Tonga eruption pic.twitter.com/Dt0exOhvG7 — William Churchill (@ChurchillWx) January 15, 2022 Tonga Volcano eruption heard from Lakeba, Fiji 😢🇹🇴 #TongaVolcano pic.twitter.com/qc9ISL25QX — Portia Dugu (@portiajessene) January 15, 2022 Ionospheric total electron content (TEC) perturbations derived from a GNSS site on Samoa from the Hunga Tonga eruption were not small to say the least @IGSorg pic.twitter.com/bMa8MKCZ3o — Brendan Crowell (@bwcphd) January 15, 2022 Huge volcanic eruption near Tonga. Reports of tsunami there and it's gone pitch black. Lots of lightning too. #tonga pic.twitter.com/Eia4fidPRc — Rick Threlfall (@RickThrelfall) January 15, 2022 Putting the #Tonga #eruption into perspective. It's an astonishing event. Link to story/infographics here: https://t.co/HLIzcRI8eMhttps://t.co/Pm2OWgcGPf pic.twitter.com/oUrc71jcJf — WeatherWatch.co.nz (@WeatherWatchNZ) January 15, 2022 15 minute pressure altimeter change via ASOS NWS/MADIS 5 minute interval data. Shows the shockwave from the #Tongaeruption , feel free to use as you wish. pic.twitter.com/P31Aq1SYku — daryl herzmann (@akrherz) January 15, 2022 Longwave infrared channel via #GOESWest of the #Tonga eruption.. one of the most incredible satellite animations I've ever seen. The relative warmth of the ash cloud atop the very cold tropospheric convective anvil. Waves upon waves. Simply incredible. pic.twitter.com/MoBcIxkblW — William Churchill (@ChurchillWx) January 15, 2022 New data alert 🚨 We just overflew Hunga Tonga-Hunga Ha'apai volcano with #Sentinel1 🛰️🌋 The datatake didn't include #Tonga main island, where I desperately hope everyone is safe 🇹🇴❤️🩹Here's our last 3 passes over the volcano… pic.twitter.com/KD39030U5S — Thomas Ormston (@ThomasOrmston) January 15, 2022 <トンガの火山噴火の衝撃波か> — ウェザーニュース (@wni_jp) January 15, 2022 The evolution of the volcanic island of Hunga Tonga over time, with the last image having been taken just two hours before the massive eruption last night. Curious to see the scene after that… Images from Google Earth and @planet. pic.twitter.com/lOmca4Du7I — Alex Spahn (@spahn711) January 15, 2022 This is the most incredible #lightning loop that I have ever put together. #HongaTongaHungaHaapai #HungaTonga #Volcano eruption today with nearly 400k lightning events in just a few hours! pic.twitter.com/xqW70NLeVd — Chris Vagasky (@COweatherman) January 15, 2022 Looks to me like we see the seismic signal from the Tonga eruption at Weston, MA and Westport, CT. — Alan Kafka (@Weston_Quakes) January 15, 2022 Is it possible that we see pressure changes in Slovakia too? Graphs time UTC+1. pic.twitter.com/jD0gy3iflc — Blažej Krajňák (@BlazejKrajnak) January 15, 2022 Before and after photos show that the island of Hunga Tonga and Hunga Ha'apai is essentially gone following the explosive eruption of the volcano last night. https://t.co/6GvI5nNGV2 pic.twitter.com/wEjBhfmWFZ — Kaylan Patel (@WxPatel) January 15, 2022 If this estimation is correct, this is huge!!! https://t.co/7VKIsj5ovQ pic.twitter.com/NM5qeqeccB — Sarah Lambart (@Sarah_Lambart) January 15, 2022 A lot of talk about just how big the eruption at Hunga Tonga-Hunga Ha'apai was. It might be awhile before we know & we don't know if there is more to come. Questions abound about what caused the tsunami, why the eruption was so explosive, etc https://t.co/oXas1XevjC @DiscoverMag — Dr. Erik Klemetti Gonzalez (@eruptionsblog) January 15, 2022 With latest satellite imagery, we get a step closer to understand what happen with Hunga #Tonga leading to this ocean-wide #tsunami. Latest @sentinel_hub imagery shows the loss of a majority of the volcano's emerged landmass. However, most of its structure lies underwater. pic.twitter.com/odz5VcNphl — Andreas Schäfer (@DrAndreasS) January 15, 2022 The first #stratospheric #volcanic #eruption of 2022, at #HungaTongaHungaHaapai (#Tonga) on Jan 13-14. #Sentinel5P #TROPOMI & @NASA's Aura/OMI both measure ~0.05 Tg SO₂ in the #volcanic cloud – not enough for #climate impacts. @CopernicusEU @NASAEarth @volcanessa @MetService pic.twitter.com/f9tx76Z4Ow — Prof. Simon Carn (@simoncarn) January 15, 2022 Here’s a seismic record section of the Tonga volcanic eruption that’s causing the tsunami in the Pacific basin (h/t NEIC) pic.twitter.com/sljldhPFmh — Bill Barnhart (@SeismoSARus) January 15, 2022 Atmospheric wave response to Tonga eruption, from 4 UTC to 10:50 UTC. Slightly smoothed 10-minute change in GOES-17 band 13 (IR). Looks like some modest filtering would pull out a really clear signal. pic.twitter.com/CHZY7iv4HH — Dr. Mathew Barlow (@MathewABarlow) January 16, 2022 There are a lot of questions about VEI (Volcano Explosivity Index). I recognize that the want to compare this eruption is there, but there is so much information that we simply do not have. — Dr Janine Krippner (@janinekrippner) January 16, 2022 Pressure wave #2 passed here last night at about 11 p.m. This is the wave travelling from the opposite direction. Still had an impressive magnitude. pic.twitter.com/1fG4aKhWqs — Brian Brettschneider (@Climatologist49) January 16, 2022 Trying to understand why the weather stations at Stornaway on the Outer Hebrides measured the blast before us. Basically because the blast came from the north. Unbelievably the shortest distance between here and the South Pacific is over the North Pole. 🤯 #TongaVolcanoEruption pic.twitter.com/6MdZVJ4VWI — Dr David Boyce (@DrDavidBoyce) January 15, 2022 GNSS recordings (cm) at the IGS station TONG on the Tonga island by PRIDE PPP-AR (https://t.co/JOTbaSVeRq) during the Hunga Tonga volcano eruption on Jan 15, 2022. pic.twitter.com/tkNJd2mceC — Jianghui Geng (@GengJianghui) January 16, 2022 It appears that there is some minor activity ongoing at Hunga Tonga-Hunga Ha'apai, as expected. This is based purely on satellite data. No volcanic lightning detected.https://t.co/13uhR0353u — Dr Janine Krippner (@janinekrippner) January 17, 2022 Why does it take awhile to get satellite images of what's going on in #Tonga? We have to wait for satellites to fly over, or redirect them. Also, they "see" in different wavelengths, so night, clouds, and ash can obscure the view. But we should have updates soon! https://t.co/hWpCN8fe4R — Dr. Judith Hubbard (@JudithGeology) January 17, 2022 In Germany two main air pressure waves from the #Tonga eruption could be detection: The first wave traveled from north to south, while the second wave moved from south to north. The reason might be explained by the animation below, where I visualized an outgoing circular wave… pic.twitter.com/B57uRyy3ik — StefFun (@StefFun) January 16, 2022 A news story about Tonga. Most of the news in the U.S. is very American-centric, so you have to poke around the int’l news scene to get any news about Tonga.https://t.co/GXZlAIlsrQ — Pete R. Girguis (@pgirguis) January 16, 2022 Displacements measured at GPS/GNSS station TONG in Tonga about 70 km from #HungaTongaHungaHaapai shows large motion over about 10 minutes that returns close to previous position. Some kind of shock wave or seismic wave, probably. https://t.co/7Bpq2U8GsN — Dr. Eric J Fielding, PhD (@EricFielding) January 16, 2022 Copernicus Sentinel-1A radar imaged #HungaTongaHungaHaapai on 15 January 2022 after major eruption. Most of two islands and entire new cone was blown away, along with reef south of underwater caldera. @googleearth Engine HV radar polarization animation Aug-Jan by @TheHandwerger pic.twitter.com/gwnA52Q12e — Dr. Eric J Fielding, PhD (@EricFielding) January 17, 2022 So the Hunga Tonga and Hunga Ha'apai were two separate islands before an eruption in 2014-15, and they split up before the violent eruption last Saturday. And now, very little of the two islands are left. pic.twitter.com/5G7Zy3n0td — Annie Lau (@AYAnnieLau) January 17, 2022 SNPP/OMPS limb-profiler (OMPS-LP) aerosol vertical profiles from Jan 16 shown below captured the stratospheric #volcanic aerosol cloud reaching altitudes up to ~30 km (in same location as the highest SO₂ columns). h/t @NASAGoddard Ozone & Air Quality teamhttps://t.co/PBUPJCgEtJ pic.twitter.com/3eNIwouCfs — Prof. Simon Carn (@simoncarn) January 17, 2022 Don't know if anyone has plottet something similar already. — Felix Eckel (@FelixEckel) January 16, 2022 A THIRD pressure anomaly associated with the #TongaVolcano passed through #Miami on Sunday evening… the timing means that it was the first wave making a full trip around the globe! Absolutely mind-blowing power. pic.twitter.com/lpW9FY97Mw — Brian McNoldy (@BMcNoldy) January 17, 2022 Sure looks like we got a fourth passage of the Hunga Tonga – Hunga Ha'apai eruption shockwave in Utah. Timing is spot-on and signal is similar to previous passages. Interesting for sure but worried for the people of Tonga. pic.twitter.com/ZzZzTrIJcH — Michael Bunds (@cataclasite) January 17, 2022 Revisiting the Tonga volcanic shockwave: Here's the latest Eureka barograph showing the 1st shockwave, another distinctive shockwave just after midnight Sat night (the other side of the initial shockwave), & another possible shockwave just after noon today. #CAwx #Tongaeruption pic.twitter.com/c4bXjPcZrY — NWS Eureka (@NWSEureka) January 18, 2022 I’ve tried to annotate this here to help folks understand what it shows. pic.twitter.com/lCtuc4svaS — Mark Tingay (@CriticalStress_) January 18, 2022 The @EOS_SG blog post on the Hunga Tonga-Hunga Ha'apai eruption is up! Featuring the infrasound signal from the eruption as recorded in Singapore https://t.co/YMD56WZpqY — Anna Perttu (@InfraSaurus) January 18, 2022 I took a quick dive into the science of the volcanic eruption in Tonga. It was an extraordinary event that will keep researchers busy for a while… #TongaVolcano https://t.co/K0K3aQUv3s — Henry Fountain (@henryfountain) January 19, 2022 #HungaTonga #HungaTongaHungaHaapai #volcano #eruption effect on the #atmosphere thermal structure — Riccardo Biondi (@Richi_Biondi) January 19, 2022 Pressure waves from #HungaTongaHungaHaapai have travelled 3 times around the globe as of this morning. This pressure graph is from Iceland. It shows 6 peaks rather than just 3 because.. 1/n pic.twitter.com/W4WMOYswSV — Dr. Evgenia Ilyinskaya (@EIlyinskaya) January 19, 2022 Can we use the infrasound recordings of the #HungaTongaHungaHaapai eruption to estimate origin time and average sound velocity? Let's try with a semblance approach of the first arrival. Traces are time corrected for distance and velocity and stacked. pic.twitter.com/vjiqFLvmNm — Felix Eckel (@FelixEckel) January 20, 2022 Garvin et al. (2018) Fig.3 https://t.co/2MPkw4AGRe にある海底地形図をSentinel-2の衛星写真にジオリファレンスしてみた。黄色塗りつぶし箇所: 噴火後の島(17-Jan.) 黄色点線箇所: 噴火前の島(2-Jan.) pic.twitter.com/xcUtnVPJYv — F. IKGM🌏地球科学ニュース速報モード (@geoign) January 20, 2022 .@CopernicusEU @patton_cascadia @BBCAmos @Ifremer_fr @remi_wnd Wooooh ! Looks like #Sentinel1 Wave Mode products also caught the tsunami waves 🧐 – these from @Ifremer_fr XWaves The power of earth observation. pic.twitter.com/Dz3MCfFvmf — DPManchee (@DPManchee) January 20, 2022 Almost everything about Tonga's recent volcanic eruption has left scientists scratching their heads, from the sonic boom to the baffling tsunami. And it all happened from about an hour of volcanic fury. I dig into the many mysteries @NatGeohttps://t.co/y14NIIzEtk — Maya Wei-Haas, Ph.D. (@WeiPoints) January 20, 2022 (1/4) #CTBTO continues to analyze data from the Hunga Tonga-Hunga Ha'apai volcanic eruption. In terms of infrasound technology only, this is the largest event ever recorded by the #IMS infrasound network; much larger than the Chelyabinsk meteor in 2013. pic.twitter.com/T7y9Nk9Rhm — CTBTO (@CTBTO) January 21, 2022 #Copernicus for #volcano monitoring The eruption of the #HungaTonga volcano has released large amounts of SO2 into the atmosphere #Sentinel5P 🇪🇺🛰️captured the journey of the SO2 plume over Australia and the Indian Ocean ⬇️ Data from 15 January (before the 🌋) to 20 January pic.twitter.com/gDGUnilrvh — Copernicus EU (@CopernicusEU) January 22, 2022 衝撃波による津波,meteotsunamiというようです.今回のトンガの噴火はわからないことだらけです.長い記事ですが興味深いです.https://t.co/eye6fhiq3k — 遠田晋次 (Shinji Toda) (@EeWkKI8KqQLHUqz) January 22, 2022 Hunga Tonga, les travaux des communautés du pôle Terre solide de @dataterra #TongaVolcanoDataTerra: évolution de la morphologie de l'île volcanique avant et après l'explosion du 15/01 vue par satellite. Destruction de 90 % de l'île. https://t.co/kJhqZjVRtO pic.twitter.com/VM48FaQuMI — ForM@Ter (@ForMaTerre) January 25, 2022 The low-frequency signal from the Hunga Tonga-Hunga Ha'apai vulcanic eruption that generated the tsunami (15/01) was well captured by >400 #BMKG broadband seismic stations over the Indonesia region. The vertical record from five selected stations (bandpass filtered 0.01-0.05 Hz): pic.twitter.com/k2D3M6zClL — Dimas Sianipar (@SianiparDimas) January 27, 2022 Island nation of #Tonga is completely offline following a #tsunami triggered by a massive volcanic eruption in the Pacific Ocean. According to @kentikinc data, traffic volumes began to drop around 4:30 UTC (5:30pm local) before finally going to zero at 5:40 UTC (6:40pm local). pic.twitter.com/g4QZilBrd5 — Doug Madory (@DougMadory) January 15, 2022 Tonga shock wave converges and rebounds from antipodal point in North Africa. Faster than other animation because the wave front is harder to see. EUMETSAT IR data, 18 UTC 15 Jan – 2 UTC 16 Jan, 15-minute differences. pic.twitter.com/b4QHtnpxPd — Dr. Mathew Barlow (@MathewABarlow) January 17, 2022 Shockwave from Hunga Tonga-Hunga Haʻapai eruption plume, seen by pressure change at UK sites. Wave moves southward down the country 18-20Z 15Jan. The same wave, but travelling the other way around the globe, moves northward up the country 01-03Z 16Jan. @RoostWeather @Silkstiniho pic.twitter.com/2jXaWwyzih — Will Thurston (@imthursty) January 16, 2022 "The waves are red because of airglow, an aurora-like phenomenon caused by chemical reactions in the upper atmosphere. Airglow is usually too faint to see, but gravity waves from the volcano boosted the reaction rates." https://t.co/nntTFiBOrE https://t.co/qWinu9InSV — Justice (@Loveon999) January 18, 2022 Tonga volcano : This is shockwave as measured with the IASI satellite mission (temperature perturbation between the day of the eruption and the next day). First time we see this ! pic.twitter.com/7uTCwP3tNP — cathy clerbaux (@CathyClerbaux) January 19, 2022 Oopps! When a volcano erupts with such intensity in one part of the world and causes an #oilspill 10.000 km away. The Mare Doricum vessel was offloading at La Pampilla (Peru) refinery when the tsunami hit. Now, one of the worst oil disasters in the region. https://t.co/7nBNtWgX01 pic.twitter.com/MVPFGyIFWe — ᴄʀɪꜱᴛɪɴᴀ ᴠʀɪɴᴄᴇᴀɴᴜ 🌍🛰️ 🇪🇺 (@cavrinceanu) January 21, 2022 First simulation of the atmospheric pressure disturbances generated by the #Tonga volcano explosion compared with observations from different locations. Not bad results for a first guess.@IMEDEA_UIB_CSIC @UIBuniversitat pic.twitter.com/d26wmGiDJY — Angel Amores (@an_amores) January 21, 2022 Intriguing "halo" visible in @capellaspace radar image of #HungaTongaHungaHaapai submarine volcano. 🧐 Image acquired on 21 Jan. 2022 (03:32 UTC). Possible explanations: a/ submarine topography 🌋🌊 b/ winds & currents 💨 c/ residual heat 🔥 Thread! 🧵 (1/15) pic.twitter.com/tQOJj96lHu — Raphael Grandin (@RaphaelGrandin) January 25, 2022 Still going… https://t.co/6UCJJulbMh — Harold Tobin (@Harold_Tobin) January 25, 2022 Gemini Cloudcam Gravity Waves from Earth to Sky Calculus on Vimeo. Below is an interactive map that displays a network of publicly accessible webcams that could be used to observe tsunami waves. In the middle of the night (my time) I got a notification from the EMSC earthquake notification service. I encourage everyone to download and use this app. I don’t always have the time to write a proper Earthquake Report. However, I prepare interpretive posters for these events.
Earthquake Report M 7.0 Philippines
Because of this, I present Earthquake Report Lite. (but it is more than just water, like the adult beverage that claims otherwise). I will try to describe the figures included in the poster, but sometimes I will simply post the poster here.Below is my interpretive poster for this earthquake
I include some inset figures.
Philippines | Western Pacific
Earthquake Reports
References:
Basic & General References
Specific References
Social Media: Here is my thread for this event.
This has potential to be quite devastatingReturn to the Earthquake Reports page.
Earthquake Report M 6.9 Macquarie Island
Below is my interpretive poster for this earthquake
I include some inset figures.
New Zealand | Australia
General Overview
Earthquake Reports
References:
Basic & General References
Specific References
Return to the Earthquake Reports page.
Earthquake Report M 6.7 in Taiwan
Below is my interpretive poster for this earthquake
I include some inset figures.
India | Asia Earthquake Reports
Earthquake Reports
References:
Basic & General References
Specific References
Return to the Earthquake Reports page.
Earthquake Report M 7.3 offshore of Japan
Below is my interpretive poster for this earthquake
I include some inset figures.
Japan | Izu-Bonin | Mariana Earthquake Reports
General Overview
Earthquake Reports
References:
Basic & General References
Specific References
Return to the Earthquake Reports page.
Earthquake Report: M 6.2 along the Great Sumatra fault
Below is a low-angle oblique view cut into the Earth showing this plate configuration from the Earth Observatory Singapore.
Because the convergence is at an angle oblique to the plate boundary, we can imagine that this convergence can be subdivided into two components of motion:
Below is my interpretive poster for this earthquake
I include some inset figures. Some of the same figures are located in different places on the larger scale map below.
Some Relevant Discussion and Figures
Earthquake Stress Triggering
Shaking Intensity
Potential for Ground Failure
There are many different ways in which a landslide can be triggered. The first order relations behind slope failure (landslides) is that the “resisting” forces that are preventing slope failure (e.g. the strength of the bedrock or soil) are overcome by the “driving” forces that are pushing this land downwards (e.g. gravity). The ratio of resisting forces to driving forces is called the Factor of Safety (FOS). We can write this ratio like this:
Seismic Hazard and Seismic Risk
Tsunami Hazard
Indonesia | Sumatra
General Overview
Earthquake Reports
Social Media
historical analogueshttps://t.co/Se0jsMEvGO
Hope everybody is OK in the epicentral area.https://t.co/0cddTk78dK pic.twitter.com/MW9G6IwTje
Padang Gempa Sumbar pic.twitter.com/cBBQka8hkj
References:
Basic & General References
Specific References
Return to the Earthquake Reports page.
Earthquake Report: M 5.7 & 6.2 Mendocino triple junction
I got home about 3 am the next morning and did not have energy to prepare an earthjay report. Though I started working on it the next day. However, I soon learned that this was a complicated earthquake and I decided to await additional analyses by the Berkeley Seismmo Lab and the USGS.
https://earthquake.usgs.gov/earthquakes/eventpage/nc73666231/executive
The interpretation for the type of earthquake for the M 6.2 is a little more complicated.
There are two reasons why I interpret the M 6.2 to be right-lateral (of course, I could be wrong).
Below is my interpretive poster for this earthquake
I include some inset figures. Some of the same figures are located in different places on the larger scale map below.
Other Report Pages
Shaking Intensity and Potential for Ground Failure
Some Relevant Discussion and Figures
I have compiled some literature about the CSZ earthquake and tsunami. Here is a short list that might help us learn about what is contained within the core that I collected.
Cascadia subduction zone
General Overview
Earthquake Reports
Gorda plate
Blanco transform fault
Mendocino fault
Mendocino triple junction
North America plate
Explorer plate
Uncertain
Social Media
References:
Basic & General References
Specific References
Return to the Earthquake Reports page.
Tsunami Report: Hunga Tonga-Hunga Ha’apai Volcanic Eruption & Tsunami
There was a large volcanic eruption in the Tonga region. This eruption was observable from satellites and has generated a modest but observable tsunami from Australia to the United States.
This event is still unfolding and it will take months until we have a deeper understanding of the causes for the tsunami. We know it is related to the explosive volcanic eruption from Hunga Tonga-Hunga Ha’apai, about 55 kms (35 miles) northwest of the largest island of the Kingdom of Tonga, Tongatapu.
I will continue to fill in details. I am currently busy trying to manage our tsunami event response and am learning lots in the process. However, this delays my time available here.
Summary of effects in California, and the state's response – Visit the DOC’s CGS @CalConservation @CAGeoSurvey website to learn more about the impact to #California and to stay updated over time: https://t.co/Fp42JRXYmz pic.twitter.com/ldJ7QTKeI2
Below there are many tweets etc. and one may feel like they are scrolling forever. These tweets are loosely organized into several sections.
Background Material
Tsunami Notifications
"If a tsunami does impact California, it is unlikely it will be a large tsunami but possibly in the Advisory range (0.3m to 1m) and it could arrive at about 0700AM Pacific time according to the NTWC." https://t.co/ioUmU0Yrd3 https://t.co/0b8aE12CV5
However, based on the latest information, there is NO TSUNAMI THREAT for American Samoa at this time.
Because this volcano remains active, please stay tuned for further updates.
Tsunami | Volcano Education
What boaters should know brochure for CA:https://t.co/OWXiUYuAhg
> Strong and unpredictable currents, especially where there are narrow entrances, narrow openings, and other narrow parts of harbor.
3. Much tsunami damage happens in ports because of the currents. Moving water has huge momentum.
[2/2]
A few sample sites for information:#EMBC: https://t.co/nbn6eGEhye
CRD #yyj: https://t.co/6yVbOlZeRD
Alberni: https://t.co/VWxLMdPtF1
Tofino: https://t.co/lvoZGmhTK8
Most important – check with, and follow the advice of your local emergency managers! pic.twitter.com/LURr5aFH3S
Tsunami Observations
USA (CA)
The first surge may not be the largest. In other locations today, the largest surge came much later than the first arrival time. In Monterey, CA it may have 2.5 feet above high-tide conditions, similar to a King Tide event. pic.twitter.com/3h7cpXiPZr
A Tsunami is occurring. Remember- the first wave may not be that largest. Move away from the shore and head to high ground. https://t.co/npoUHxEZLS pic.twitter.com/HmXl5cyIkr
(L) Sat. morning Jan 15
(R) Thurs. afternoon Jan 20 pic.twitter.com/XAAnzYK8GH
From here a resort on Tongatapu.
Don’t do what the videographer here did. This was unsafe and they are incredibly lucky.
Some videos on Youtube: Santa Cruz
Crescent City
Oregon
21 cm (.7 ft) at Newport, OR
6 cm (.2 ft) at Astoria, OR
15 cm (.5 ft) at Westport, WA
34 cm (1.1 ft) at La Push, WAPacific
El oleaje arrasó con al menos dos muelles uno que aparentemente sería de acceso público y otro privado, se mantiene alerta de tsunami en la zona.pic.twitter.com/ChYMvIM2wr
Port San Luis, CA: 4.3 ft
King Cove, AK: 3.3 ft
Crescent City, CA: 3.7 ft
Point Reyes, CA: 2.9 ft pic.twitter.com/HeZJldZlxZ
Photos: Haloti Ulufonua, FB pic.twitter.com/QndVbTYtgo
Hopefully aerial views by New Zealand Defence Force suggest #tsunami height of only few meters and limited inundation distance.
Here Nomuka island 70km NE of Hunga Tonga volcano. Google earth 2016 image follows pic.twitter.com/bUgwtsJ7f8
↙️18 Dec. 2021 ↘️17 Jan. pic.twitter.com/rtrWOXgpC4
Tsunami Modeling
Volcano Eruption | Atmospheric Observations
For more information on volcanic ash go here: https://t.co/AKigF7Zcwy
The health hazards here: https://t.co/30JBdoEpgMhttps://t.co/KSH2fr1tNR
今日15日(土)の20時から21時過ぎにかけて、日本全国で一時的な気圧変化が見られました。火山島フンガトンガ・フンガハアパイが午後に噴火した時の衝撃波が到達した可能性があります。https://t.co/p4ofQT1pC8 pic.twitter.com/yEVBFzVxCH
The spectrum shows signal at <0.06 Hz (>17 sec) & at 0.1 to 0.2 Hz (5 to 10 sec), which fits for ocean & continental Rayleigh waves.@jpulli @stevenjgibbons @KaseyAderhold pic.twitter.com/hJZJvO59PM
More important is how the people of Tonga are and is this over? We do not know. https://t.co/YiJ4vahkPu
Here is the pressure wave from the #HungaTongaHungaHaapai eruption in the infrasound section. The wave taking the path the other way around Earth is also clearly visible a few hours later.
Dashes: speed of sound#Tonga pic.twitter.com/ukkm1AXZCx
❄️cooling of the upper #troposphere by some degrees and 🔥warming the lower #stratosphere
the #tropopause pushed up by 600m in a 10°x15° area and by more then 1km locally pic.twitter.com/l1oHod0Apz
Fascinating | Sad Observations
Tsunami Webcam Network
Earthquake Report: M 7.5 in Peru
There was an intermediate depth magnitude M 7.5 earthquake in Peru. The tectonics in this region of the world are dominated by the convergent plate boundary, a subduction zone formed by the convergence of the oceanic Nazca and continental South America plates.
https://earthquake.usgs.gov/earthquakes/eventpage/us7000fxq2/executive
As the Nazca plate subducts, it dips below the South America plate at different dip angles. In this region of Peru, the dip angle is shallow and we term this flat-slab subduction.
This M 7.5 earthquake occurred in the downgoing Nazca plate, so was not a subduction zone megathrust event, but a “slab” event (for being in the Nazca slab).
I prepared a much more extensive report for a M 8.0 earthquake in a nearby location that happened on 26 May 2019. Read more about the tectonics of this region in that report here.
Was this M 7.5 an aftershock of the M 8.0? Probably not, based on the USGS M 8.0 slip model. However this M 7.5 could have been triggered by changes in static coulomb stress following the M 8.0.
I don’t always have the time to write a proper Earthquake Report. However, I prepare interpretive posters for these events.
Because of this, I present Earthquake Report Lite. (but it is more than just water, like the adult beverage that claims otherwise). I will try to describe the figures included in the poster, but sometimes I will simply post the poster here.Below is my interpretive poster for this earthquake
I include some inset figures.
Chile | South America
General Overview
Earthquake Reports
Social Media
References:
Basic & General References
Specific References
Return to the Earthquake Reports page.
Earthquake Report Lite: M 7.0 near Acapulco, Mexico
Because of this, I present Earthquake Report Lite. (but it is more than just water, like the adult beverage that claims otherwise). I will try to describe the figures included in the poster, but sometimes I will simply post the poster here.
Last afternoon (my time) there was an M 7.0 earthquake near Acapulco, Mexico. This event generated a tsunami, landslides, building damage, casualties (one fatality as I write this), and many emotions.
https://earthquake.usgs.gov/earthquakes/eventpage/us7000f93v/executive
I present my interpretive poster and a few figures. Read more about the tectonics of this region here, in a report for an M 7.4 earthquake in 2020.Below is my interpretive poster for this earthquake
I include some inset figures.
Tide Gage Data – Acapulco
Earthquake Intensity
Mexico | Central America
General Overview
Earthquake Reports
References:
Basic & General References
Specific References
Return to the Earthquake Reports page.