We just had an earthquake in Argentina! Here is the USGS web page for this earthquake.
At first, I thought, “oh, another deep earthquake.” I looked at the hypocentral depth The hypocenter is the 3-D location of the earthquake, while the epicenter is the map location of the earthquake. The depth was really shallow (9.6 km). I initially thought that this was a default depth, but that is typically set at 10 km (so I was unconvinced of my interpretation). I loaded the USGS kml file in google earth and plotted the MMI contours (Modified Mercalli Intensity, a measure of ground shaking intensity). The MMI contours present a great opportunity for a lesson, which I will detail below. I was refreshing the web page to see if the depth would change. It did not.
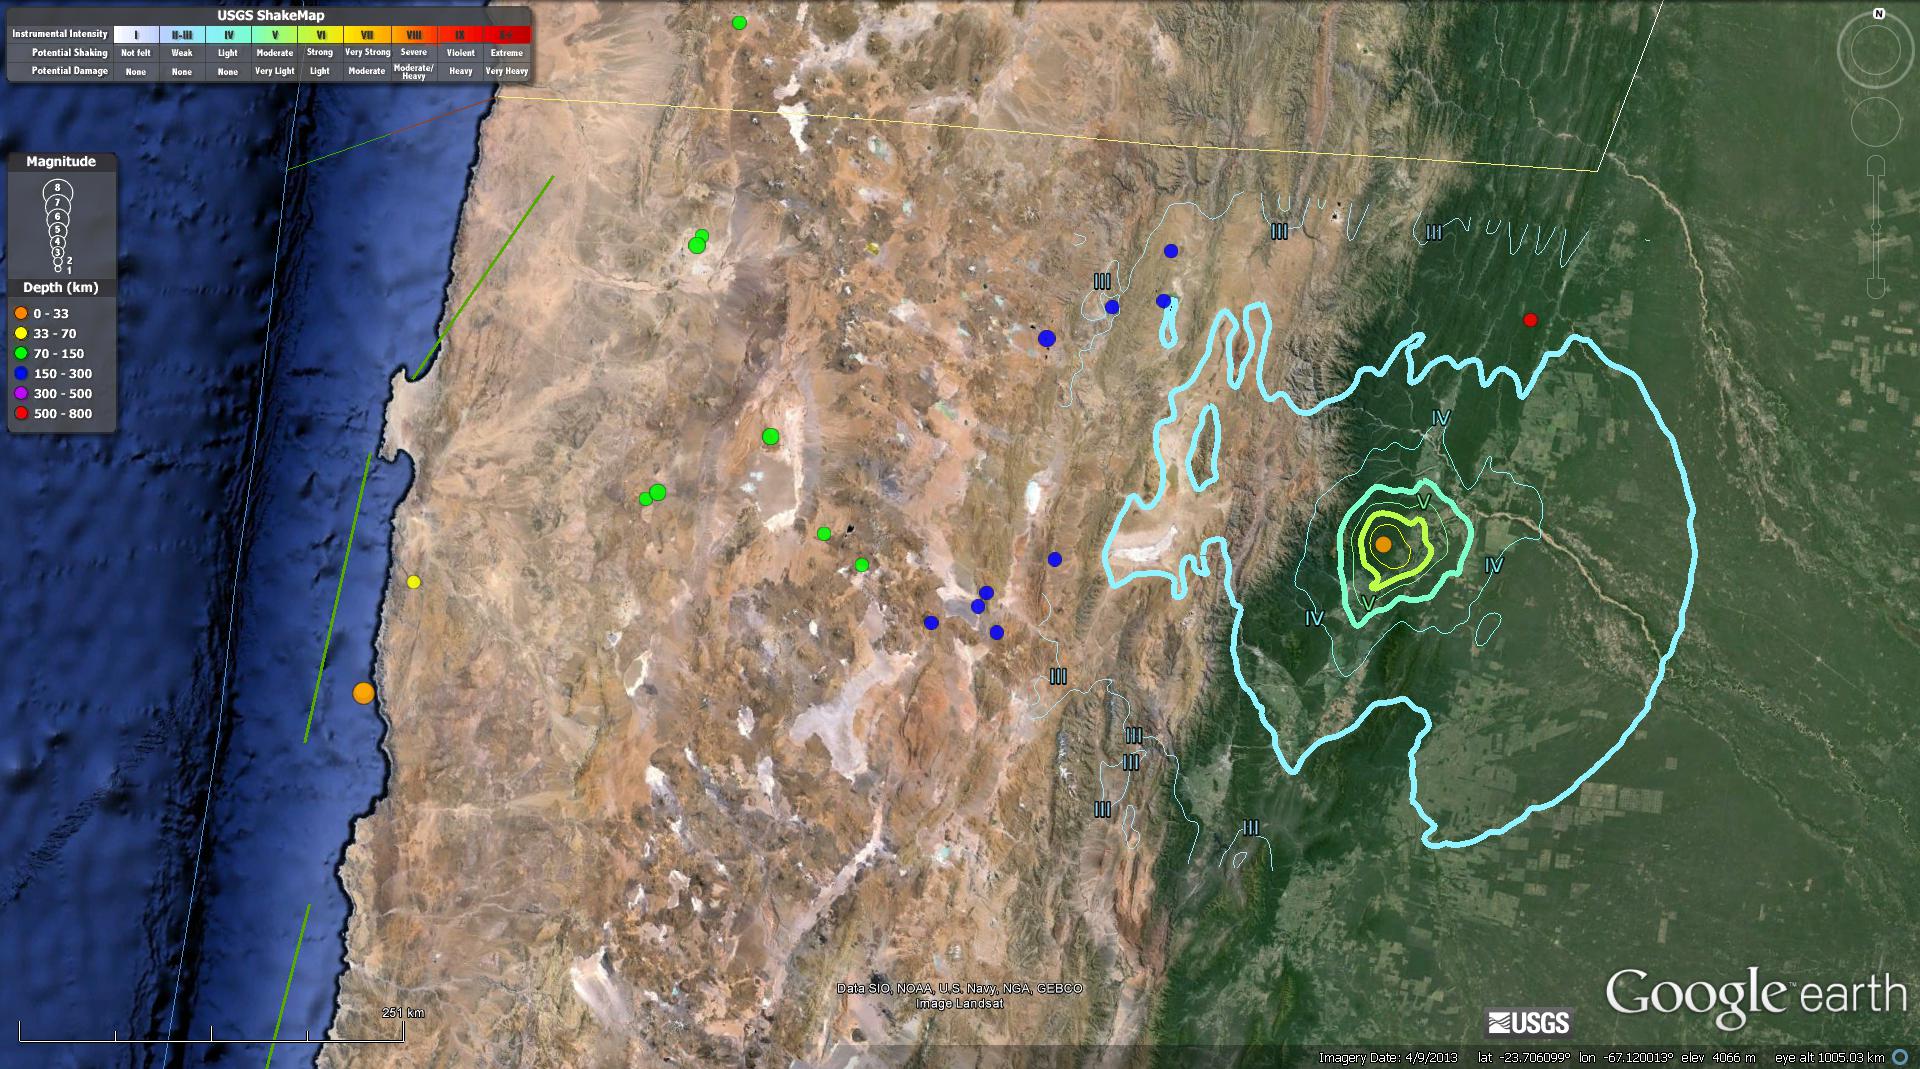
Here is a map showing the epicenter and the MMI contours. Note how there are some MMI III thin blue contours on the north side of the earthquake (plotted as an orange circle, based on depth and magnitude). These MMI III contours look like a row of “u” or “v” symbols plotted. In this area, there are a series of ridges and valleys that are formed by a fold and thrust belt. This F&T belt is the result of a back thrust related to the subduction zone. The ridges and valleys bring the ground surface further and closer to the earthquake, respectively. Ground motions from earthquakes attenuate (get absorbed and diminish) with distance from the earthquake. There are other factors that modify how ground motions are felt at Earth’s surface, but distance has a first order control on this (as evidenced by this map).
Note the earthquake at the coast to the west of today’s earthquake. This is an earthquake that plots at the southern end of the M 8.1 1995 subduction zone earthquake slip region.

I thought that as soon as the depth were updated, there would be a revised estimate of ground shaking (and a new kml file, with new MMI contours to plot). However, as I refreshed the pages, the “Did You Feel It?” map showed a report with a location close to the epicenter. This report, which is based on real observations (in contrast to the MMI contours, which are generated by a numerical model) had a large intensity. The DYFI system also uses the MMI scale, so it is easy to compare with the model based results. This DYFI report with a large MMI value confirmed that the original estimate for ground shaking, and the hypocentral depth, were generally correct. In other words, this is a shallow earthquake and not a deep one.
If someone were to produce a moment tensor, it would probably have a compressional solution.
Here is the DYFI map that shows the report with a small epicentral distance.
.jpg)
Here are the two “attenuation with distance plots,” before and after the near distance report. Note how the near-distance report confirms that the model is generally ok (especially the one in green, that uses attenuation relations from thousands of earthquakes in California).

.jpg)
Here is a web page that presents research about the thrust faults on the eastern boundary of the Andes. Below I present a few of their figures. First is a map and second is a cross section. This is to the south of today’s earthquake, but is probably a relevant model.
Here is a map showing this region, with the Juan Fernandez ridge near the northern boundary of this oblique map. The recent subduction zone earthquakes in November 2015 to the west have been on the northern side of the JFR.

Here is a cross section showing the detachment fault that has a series of thrust faults the reach the surface on the eastern boundary of the Andean Cordillera.

Earthquake Report: Argentina!
1 thought on “Earthquake Report: Argentina!”