We just had an earthquake located along the Kamchatka Peninsula. Here is the USGS website for this M 7.2 earthquake. This earthquake was fairly deep and approximately east of a large and very deep earthquake from 2013.
Here is my earthquake report for the 2013 M 8.3 earthquake and a second report for some triggered earthquakes updip of the M 8.3.
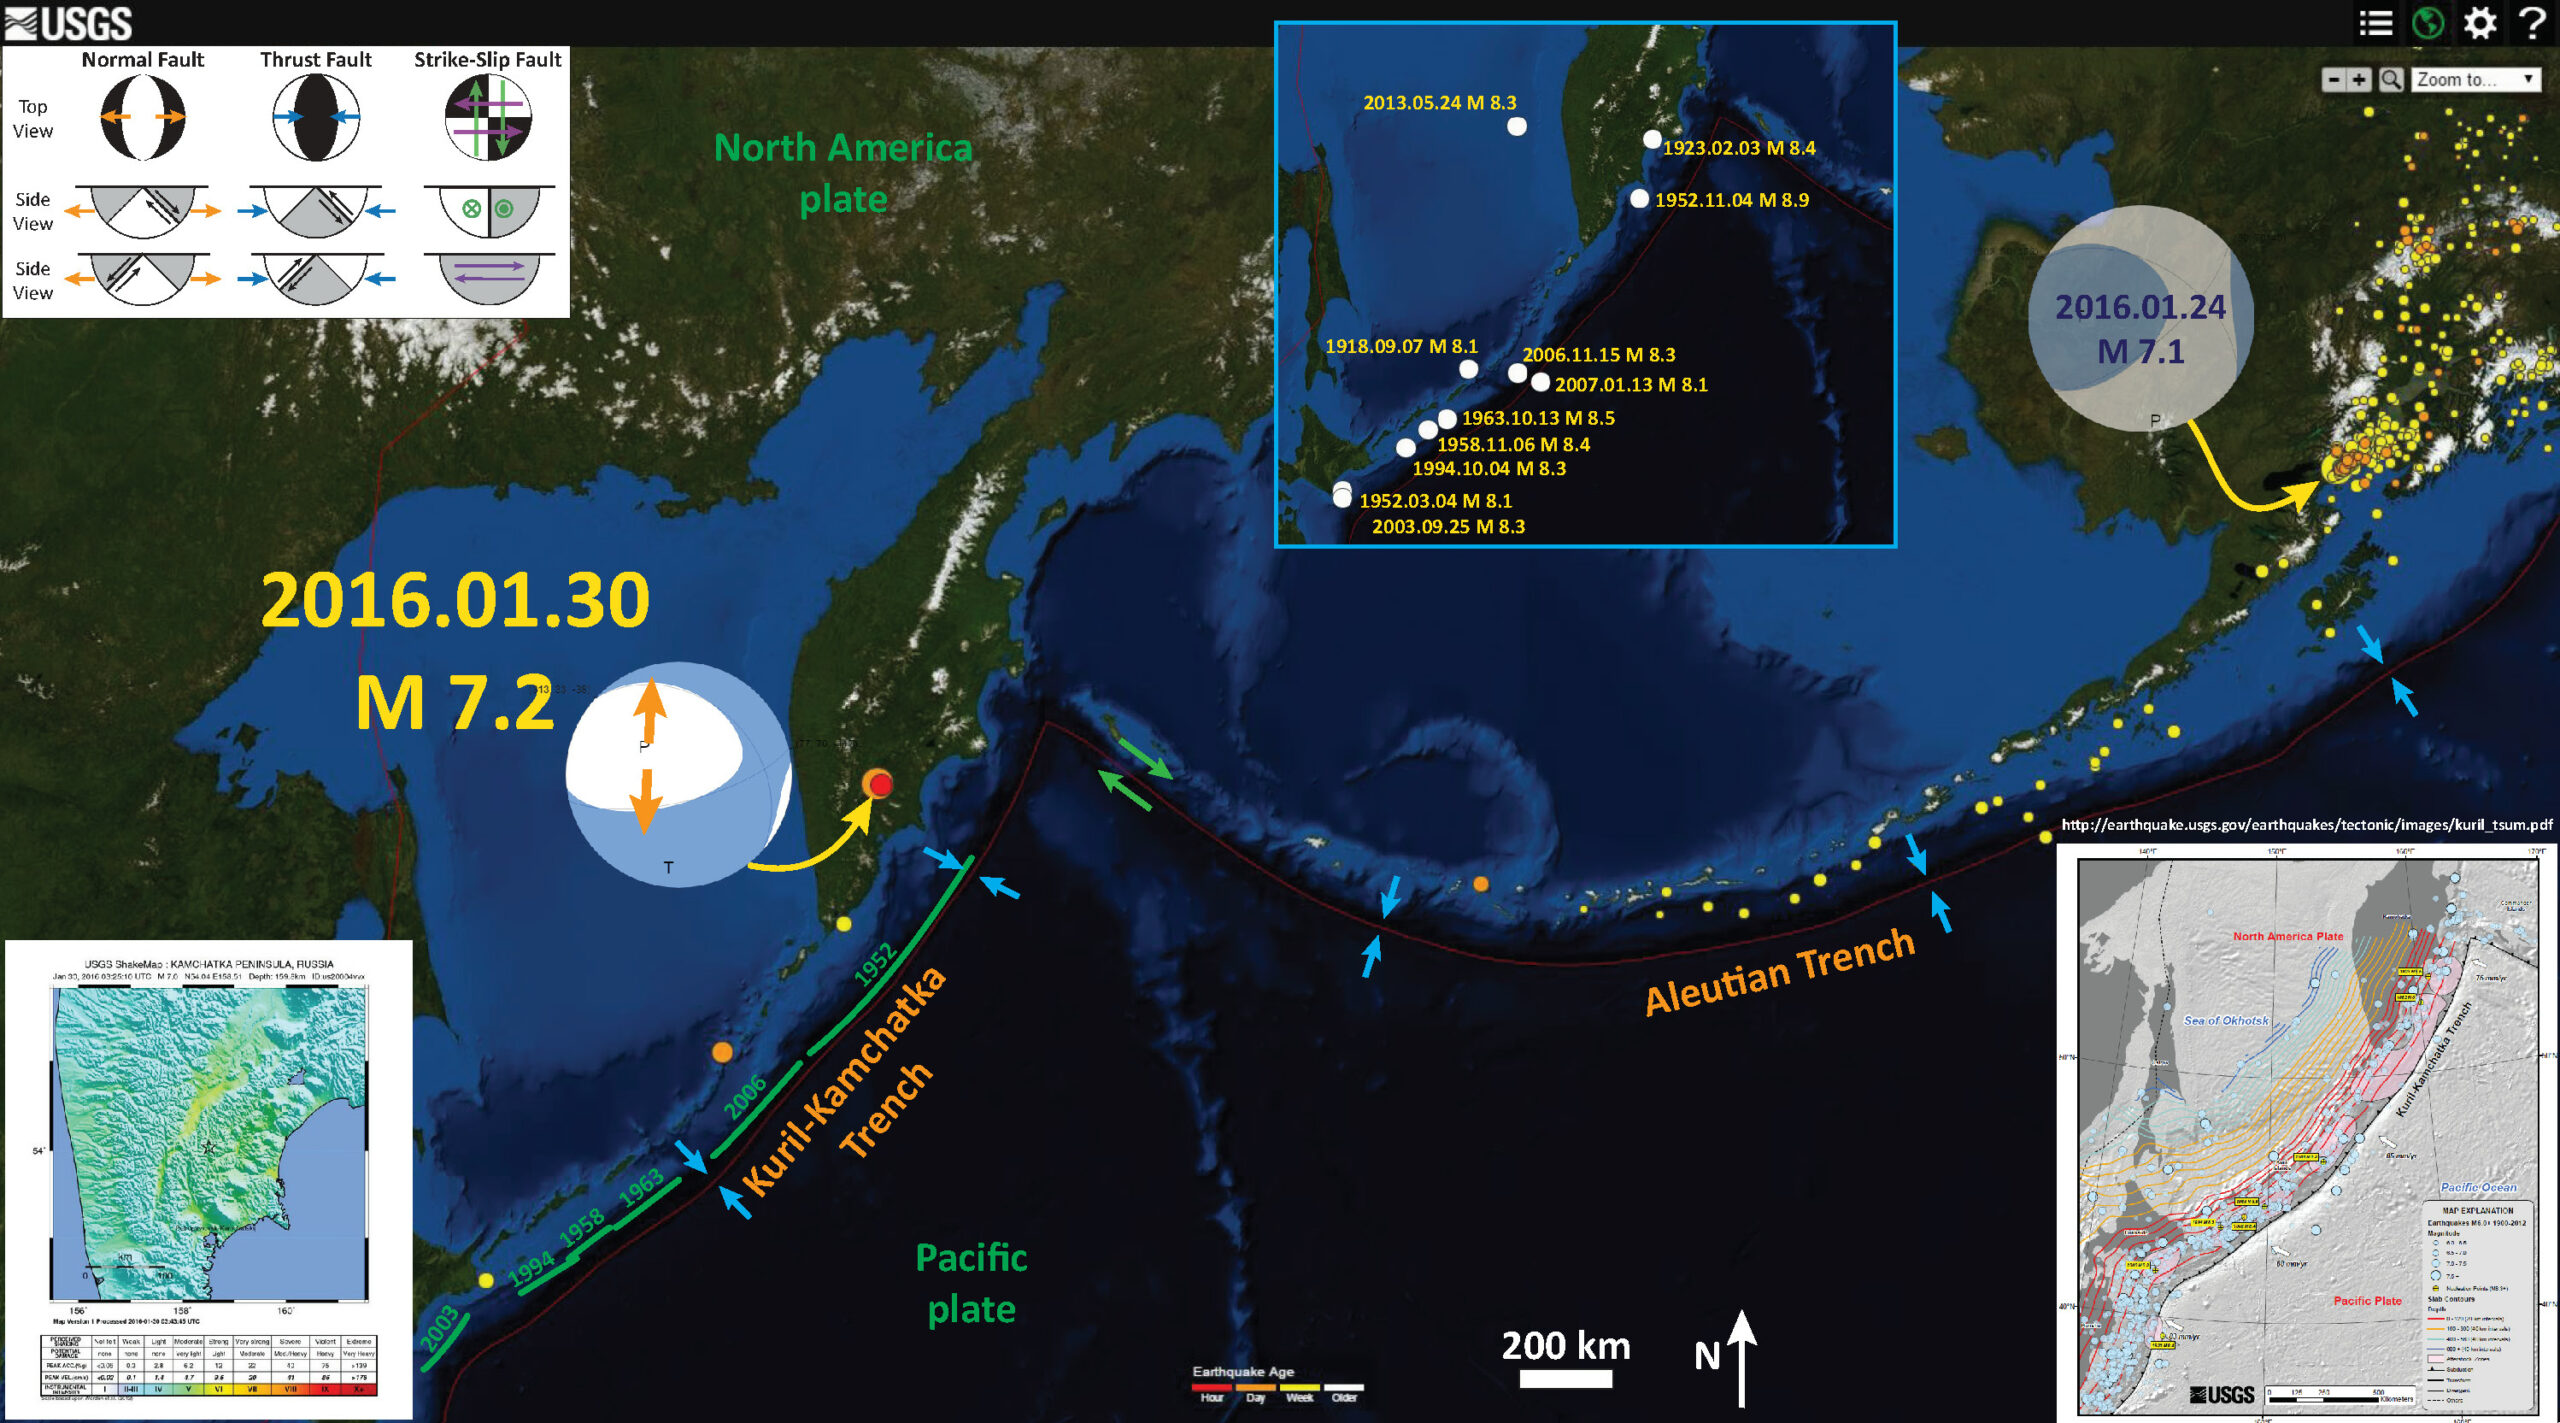
Below I present a summary poster for this earthquake. This earthquake appears to have occurred in the downgoing Pacific plate. Below is my interpretive poster where I plot the USGS moment tensor. This earthquake is an extensional earthquake with extension in the north-south direction. The downgoing plate experiences extension in two ways, from bending in the upper part of the plate and from tension due to slab pull (as the downgoing oceanic lithosphere is pulling the plate into the mantle). The orientation of the extension during this earthquake is interesting because it is not perpendicular to the plate boundary. The 2013.05.24 M 8.3 deep earthquake was oriented in the expected direction. I also include the region of Alaska that just had a M 7.1 earthquake. Here is my Earthquake Report for the Alaska earthquake.
I include labels for the plate boundary fault systems in the region and include generic focal mechanisms for these fault systems. There is a legend that shows how moment tensors can be interpreted. Moment tensors are graphical solutions of seismic data that show two possible fault plane solutions. One must use local tectonics, along with other data, to be able to interpret which of the two possible solutions is correct. The legend shows how these two solutions are oriented for each example (Normal/Extensional, Thrust/Compressional, and Strike-Slip/Shear). There is more about moment tensors and focal mechanisms at the USGS.
I include an inset map from the USGS (also included below). This map shows slip patches for some historic earthquakes. I used these slip patches to approximately place labels in green for these historic earthquakes.
I also include an inset map that shows the epicenters for historic earthquakes with USGS magnitudes greater than or equal to M 8.0. I label the dates and magnitudes of these earthquakes. Here is the query that I used to create this map. There is an interesting earthquake pair from 2006 and 2007. In 2006 there was a M 8.3 subduction zone earthquake that generated a Pacific-wide tsunami. The 2006 tsunami caused about $20 million in damage in Crescent City, CA. About a year later, there was a M 8.1 earthquake in the downgoing Pacific plate that was southeast of the trench. Dr. Erica Emery worked on this for her research.

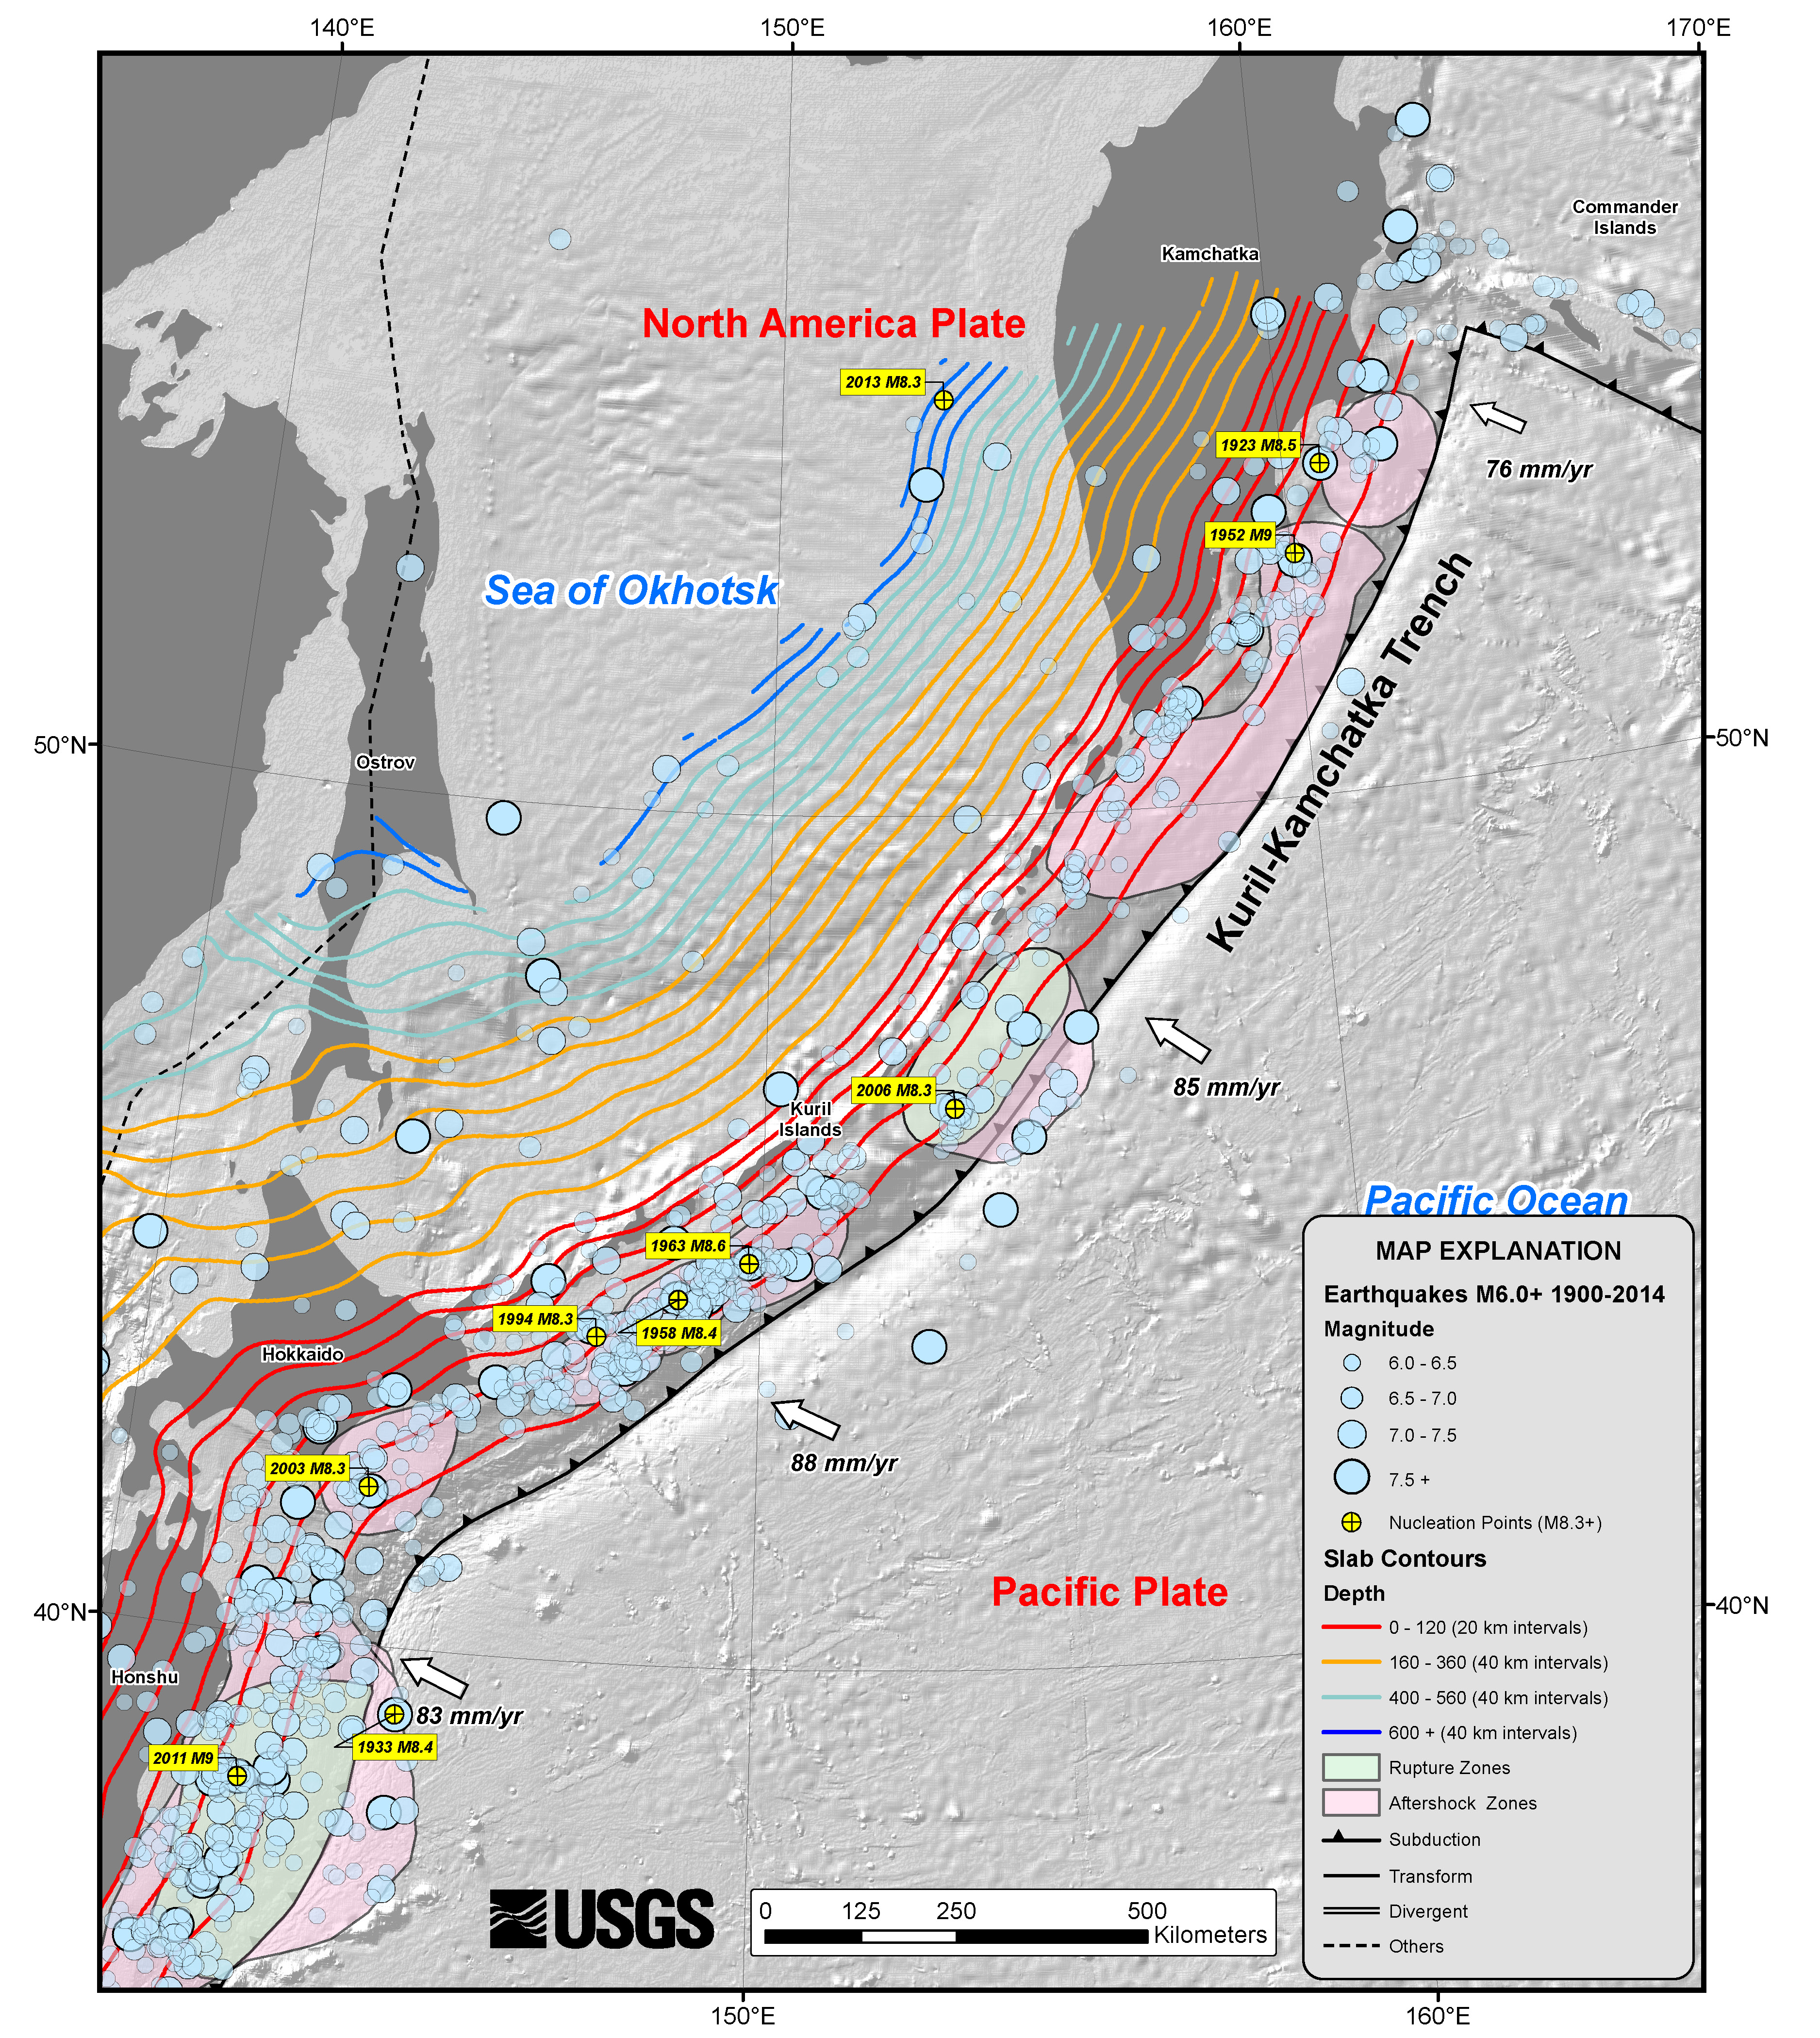
Here is the tectonic summary poster from the USGS. This shows epicenters for earthquakes from 1900-2014, plus the slab contours from Hayes et al. (2012). These slab contours are estimate for the location of the subduction zone fault and it is based upon the 3-D location of earthquakes. There is considerable uncertainty with this model, but it is the best that we have. Hayes and his colleagues are currently updating these global slab models.
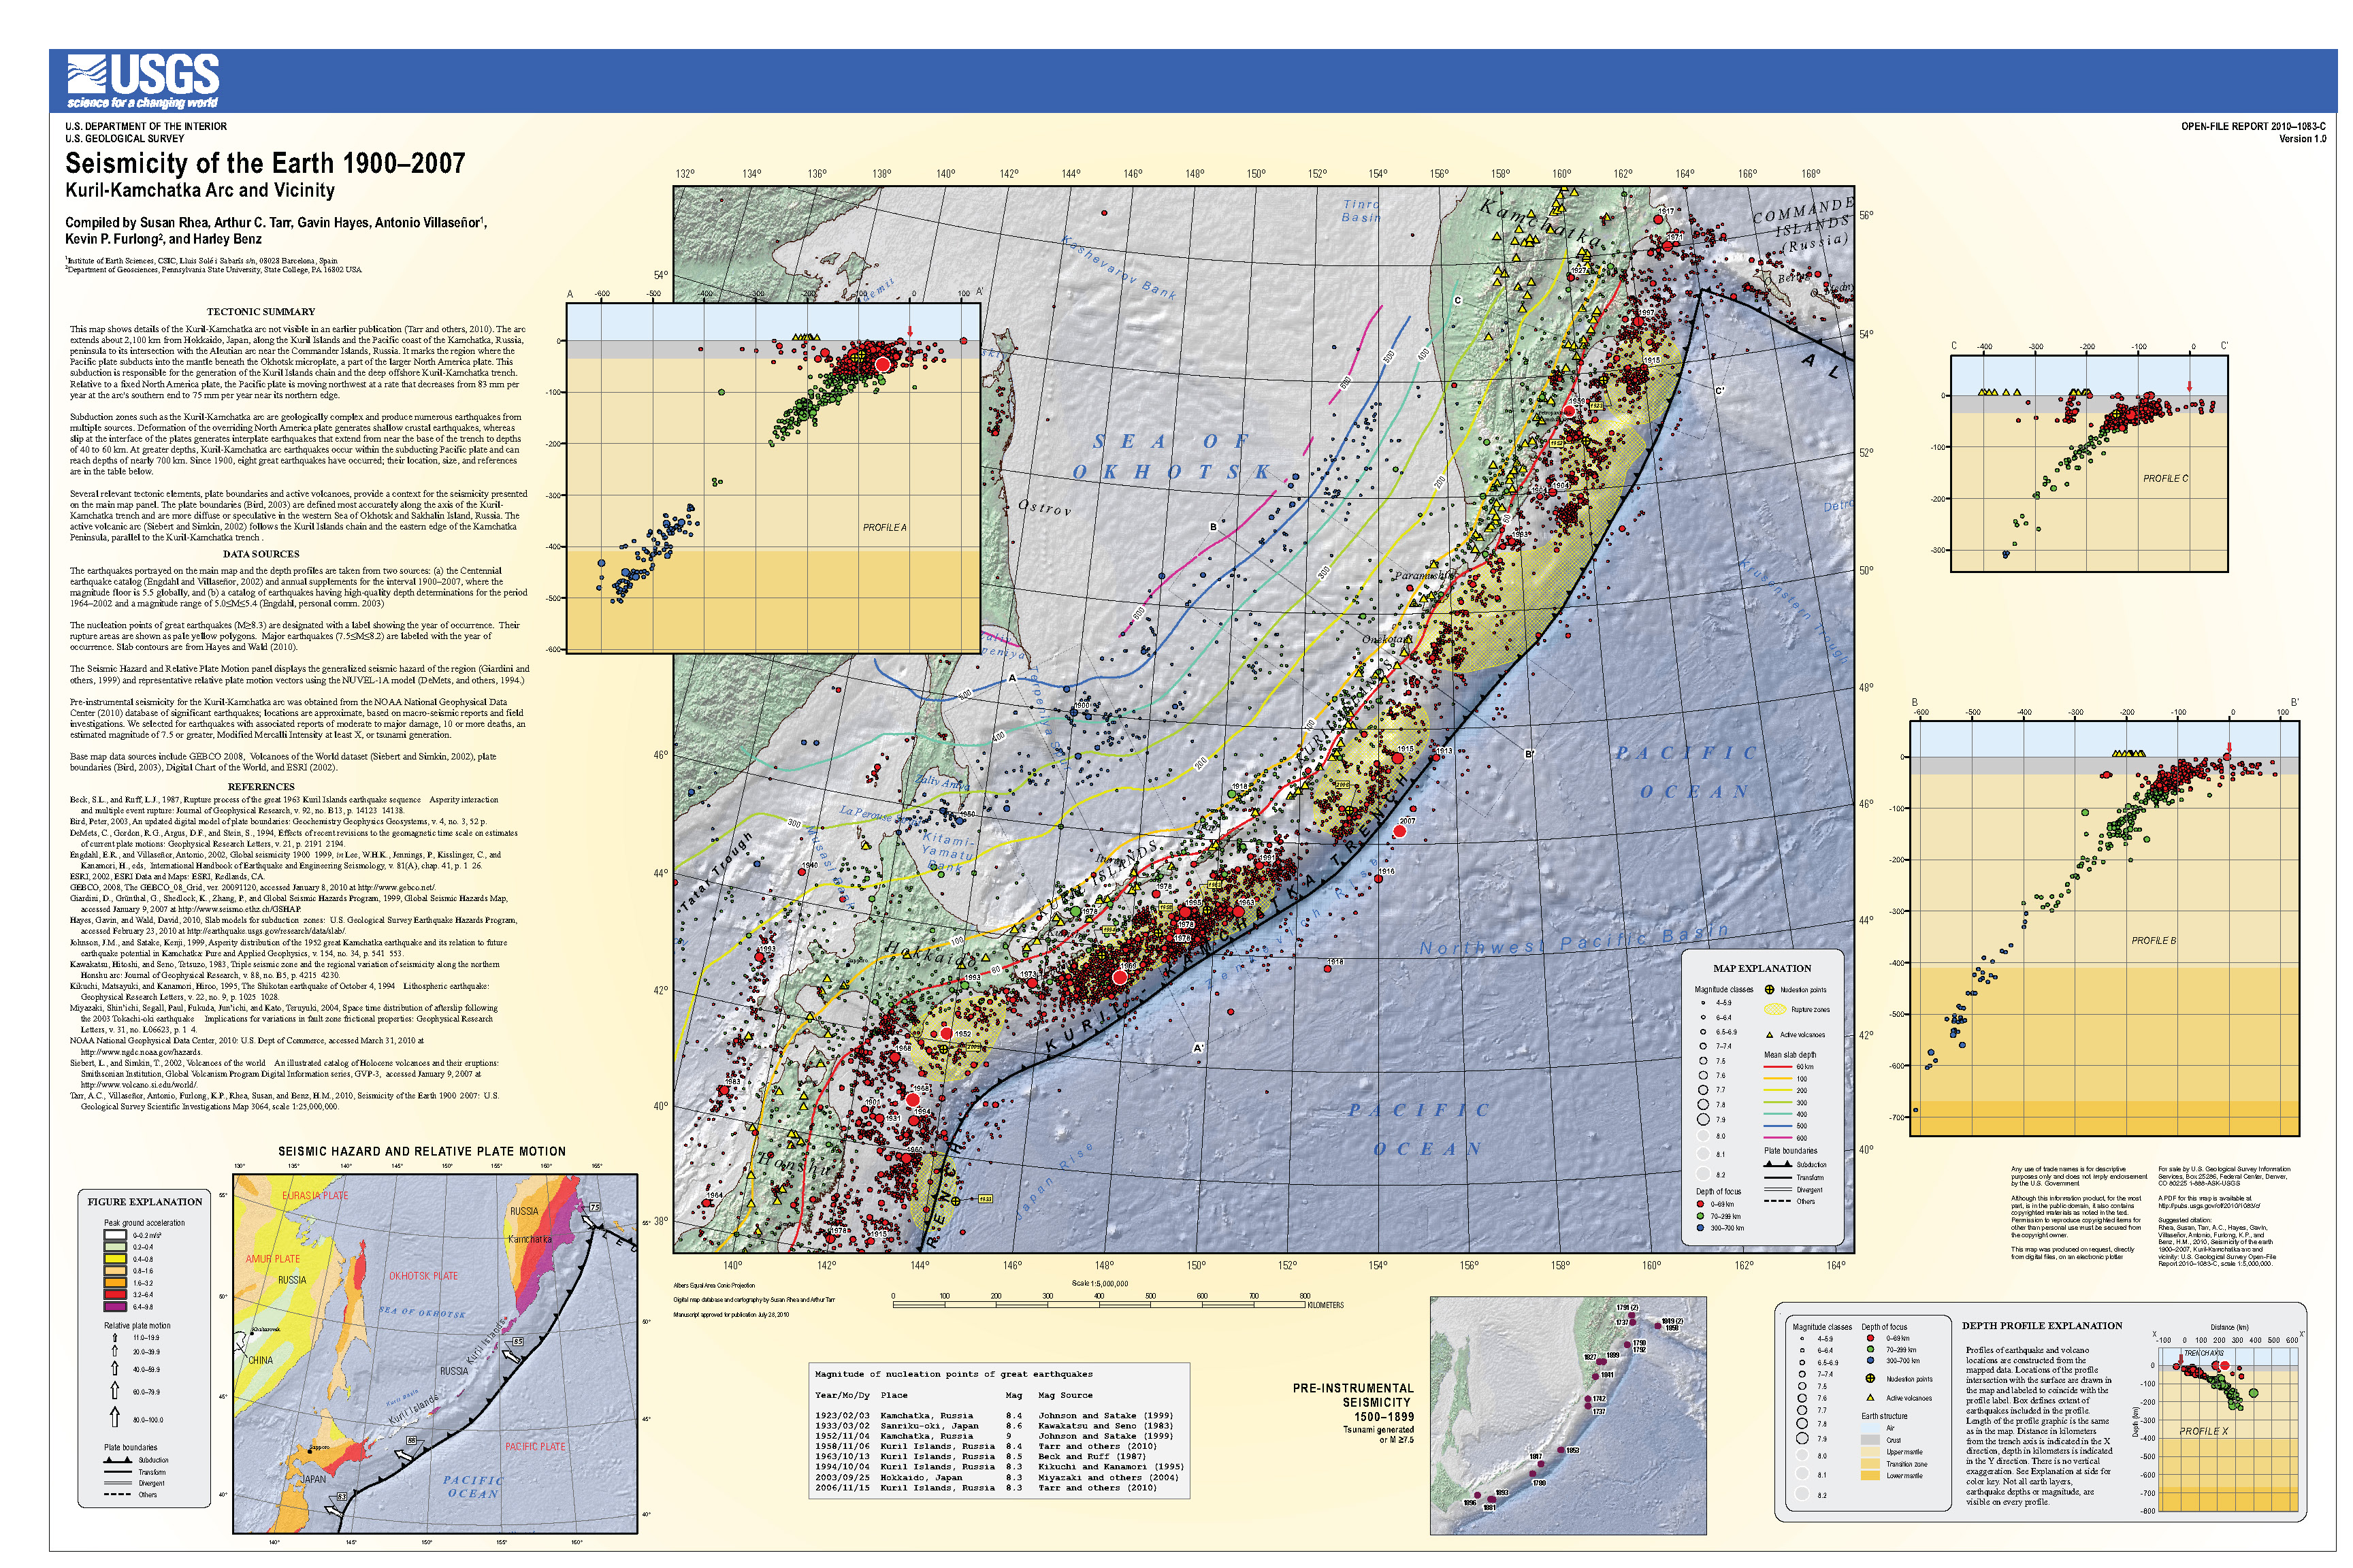
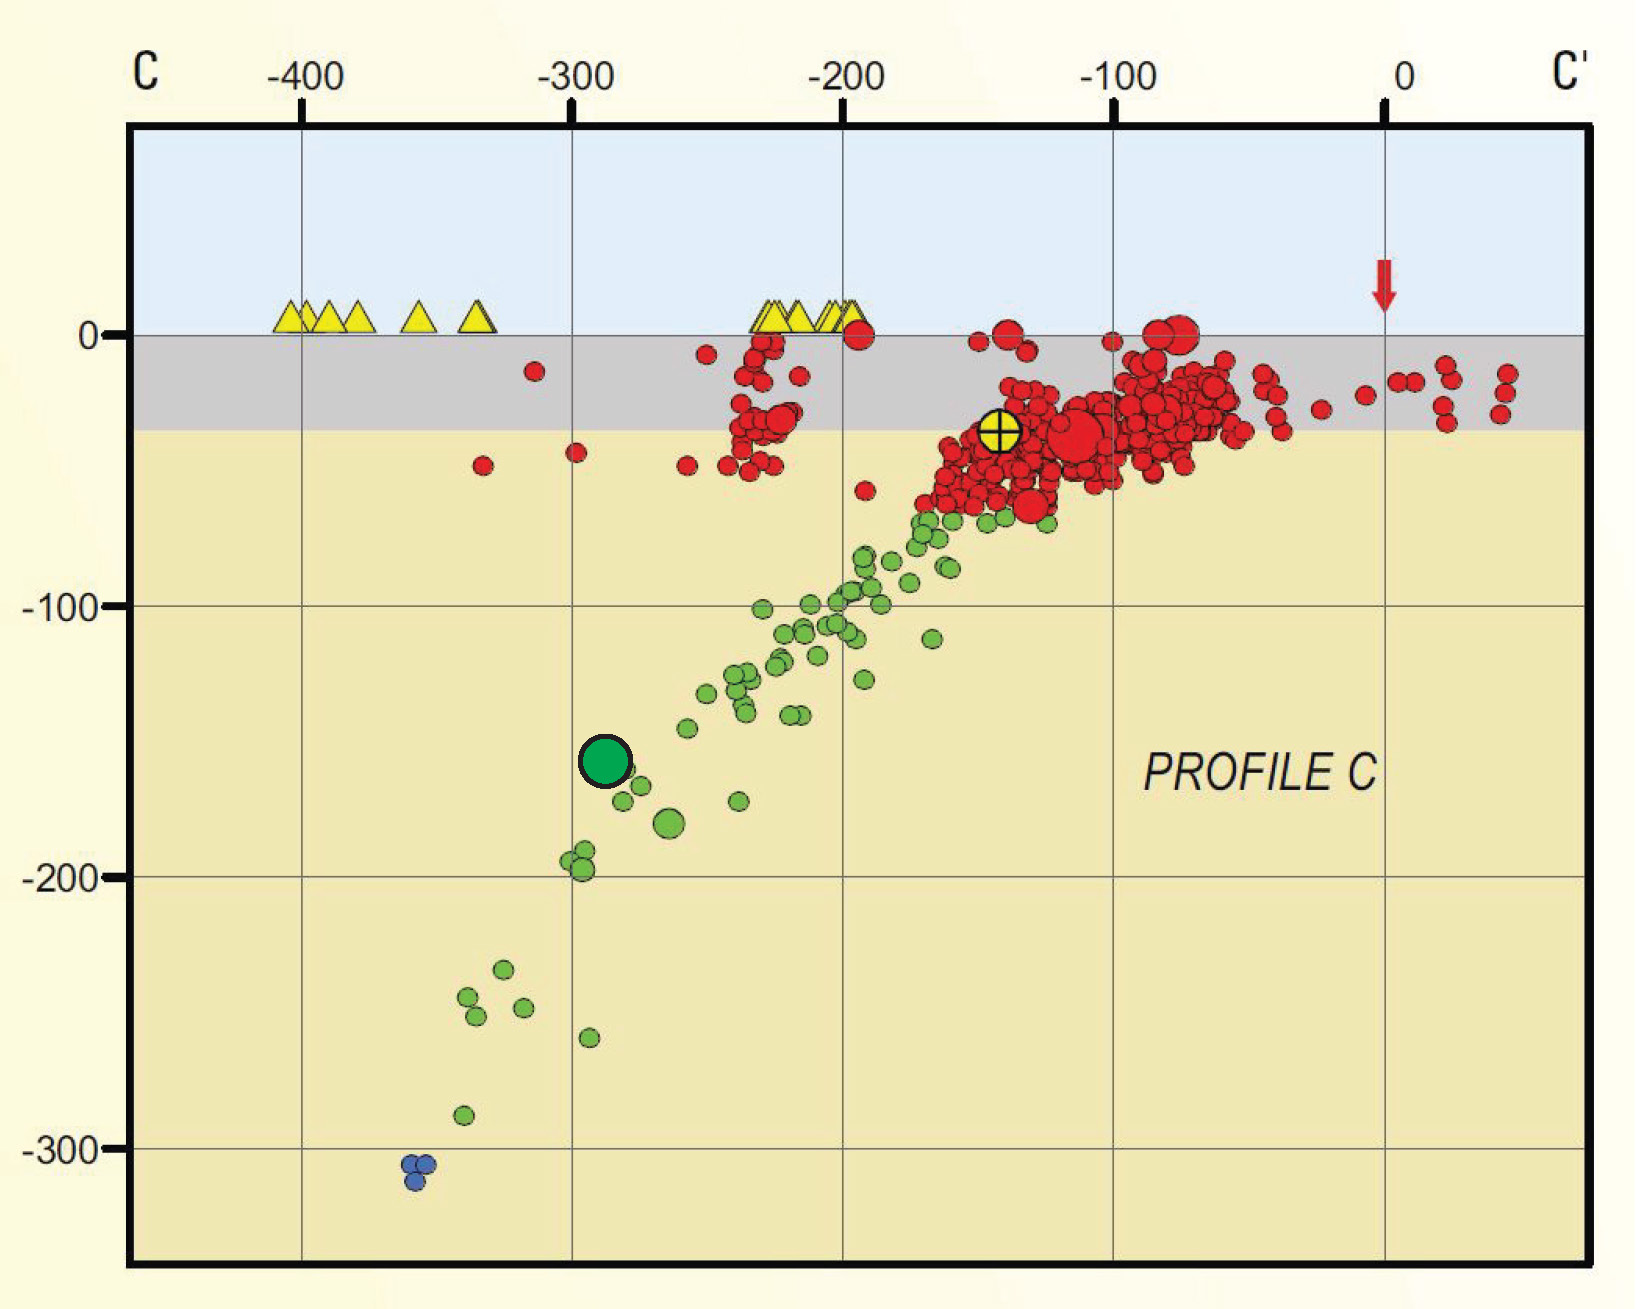
The USGS prepared a more comprehensive summary poster for this region. This poster has some plots of seismicity in cross sectional view. Here is the poster, but I include some sections of the poster below that are relevant for this earthquake.
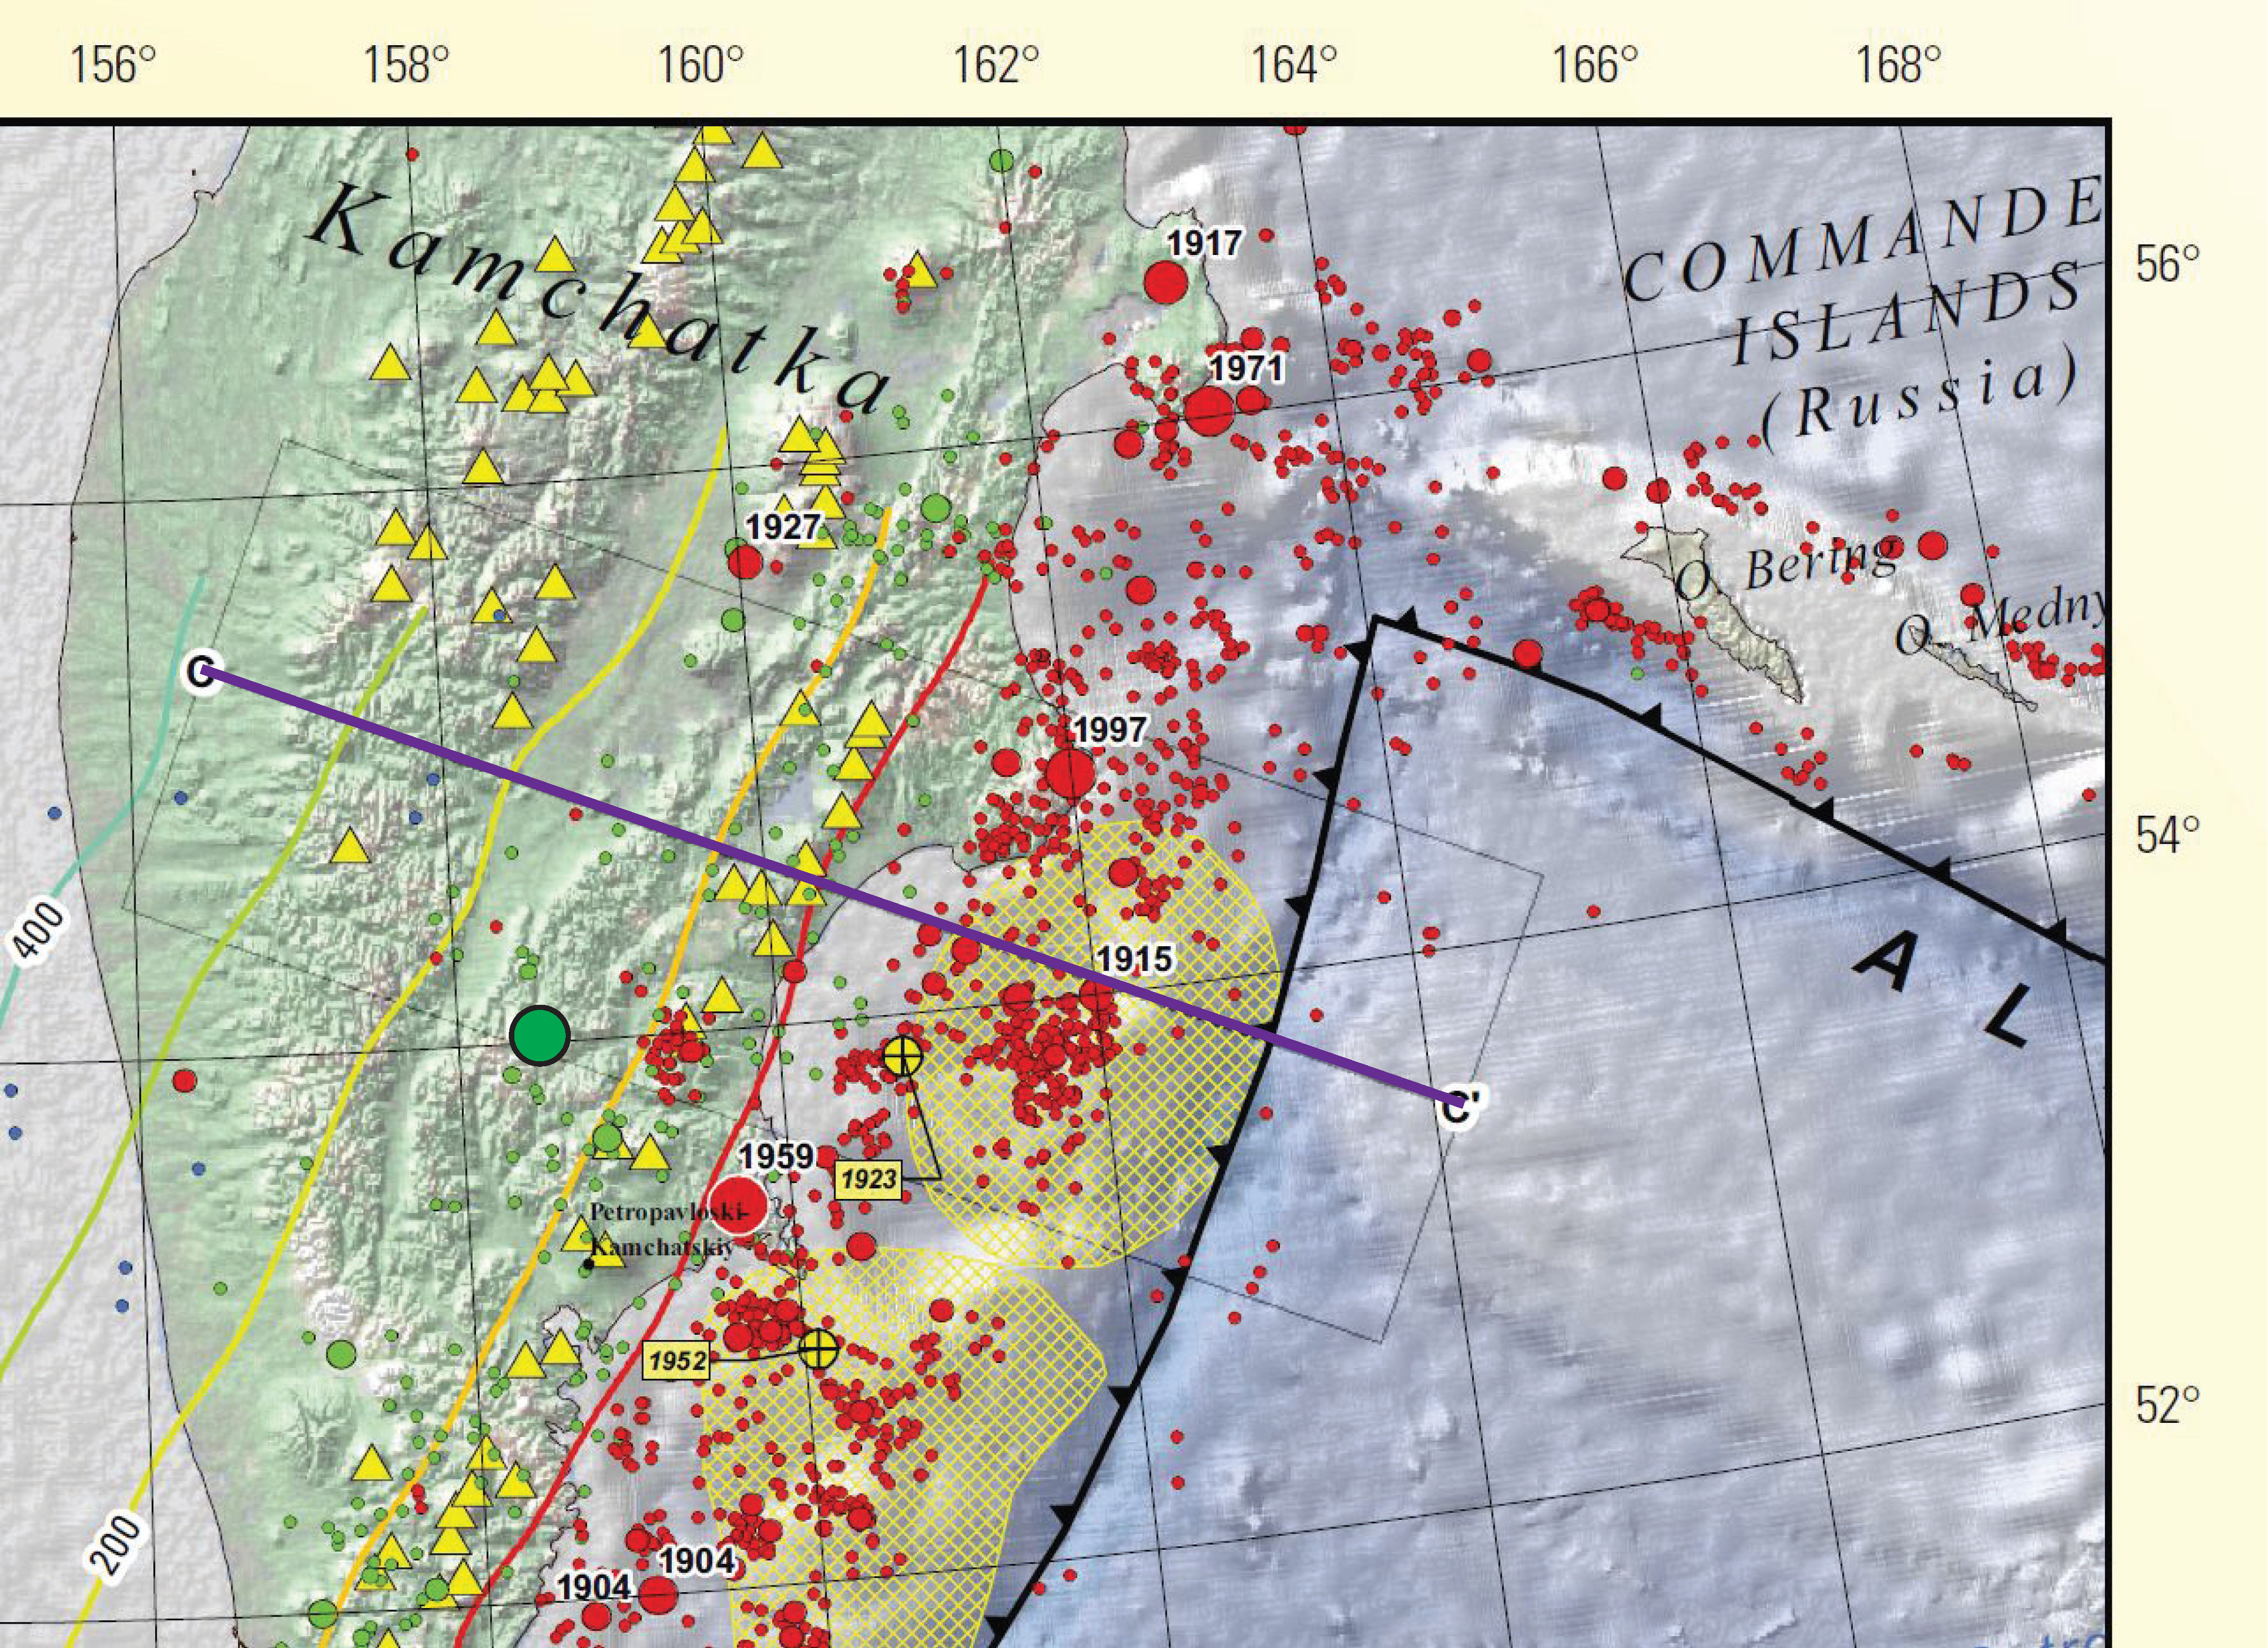
Here is a map for the southern Kamchatka Peninsula. Earthquakes are plotted with diameter scaled to magnitude. The cross section C-C’ is labeled, as are the Hayes et al. (2012) slab contours. I place the epicenter for this earthquake as a green circle. The diameter is scaled approximately to magnitude and the location is approximate.
Here I place the hypocenter for this earthquake on the cross section from the USGS poster. The location is approximate.
Even though this is a very deep earthquake, due to its magnitude, it may lead to some casualties. Here is the PAGER alert, which is an estimate of the damage to people and their belongings (e.g. infrastructure). This is generated from a numerical model which overlays estimates of ground shaking with a geospatial database of people and infrastructure. This is only an estimate and it helps organizations plan for aid and assistance.

Here is a map from Lay et al. (2009) where they plot focal mechanisms for the 2006-2007 Kuril earthquake series. Note how the earthquakes in the Pacific plate are generally extensional. These earthquakes are in the outer rise, where the plate is flexed upward due to the forces exerted from subduction. The other interesting thing is that in 2009, there was a compressional earthquake in this same region. I include their figure caption as a blockquote.

Map showing regional bathymetry and tectonic features, along with global centroid moment tensor (CMT) solutions for the larger earthquakes in the 2006 –2007 Kuril Islands sequence (focal mechanisms), and NEIC epicenters of activity prior to the doublet (gray circles) between the two largest events (yellow circles), and following the 13 January 2007 event (orange circles). The gray shaded focal mechanisms are CMT solutions for foreshocks of the 15 November 2006 event, the red-shaded mechanisms occurred after the 15 November 2006 event, and events after 13 January 2008, including the trench slope 15 January 2009 event are green shaded. Focal mechanisms are plotted at the NEIC epicenters. The white stars indicate the CMT centroid locations for the two main shocks, which are shifted seaward relative to the NEIC locations. The arrow shows the estimated plate motion direction with a rate of 80 mm/yr computed using model NUVEL-1 [De Mets et al., 1990] with North America fixed.
Here is a map from Lay et al. (2009) that shows their interpretation of the tectonic regime of the outer rise of the Pacific plate prior to the 2006-2007 series. I include their figure caption as a blockquote.

Shallow seismicity distribution (NEIC epicenters) and all CMT solutions for events along the central Kuril Island region prior to the 15 November 2006 event. CMT centroid locations have an overall location bias somewhat toward the southeast. The approximate aftershock zones of the great 1963 Kuril Islands (Mw = 8.5) and 1952 Kamchatka (Mw = 9.0) earthquakes are outlined in red, and the epicenter of the 1915 (MS 8.0) event is shown by a red asterisk. The alongstrike extent of the 2006 –2007 great doublet is shown by the dashed red line with arrowheads. Outer rise activity of extensional or compressional nature is highlighted. The outer rise compressional mechanisms in red are from Christensen and Ruff [1988] with the 16 March 1963 event being labeled.
This shows their slip models for this earthquake pair, projected to the surface of the seafloor. I include their figure caption as a blockquote.

Surface map projection of coseismic slip for the 15 November 2006 (average slip 6.5 m) and the northwest dipping plane for 13 January 2007 (average slip 6.7 m at depths less than 25 km) events (NEIC epicenters, yellow circles, and CMT centroid epicenters, stars). Figure 15 indicates the relative position of the slip surfaces at depth. CMT mechanisms (centered on NEIC epicenters) for large events between June 2006 and May 2007 are shown; enlarged versions with first motions for the doublet events. Gray mechanisms indicate events before the 15 November 2006 event; red mechanisms indicate events after that rupture. The focal mechanism and epicenter of the 16 March 1963 (blue mechanism) and 15 January 2009 (green mechanism) compressional trench slope events (hexagons) are included. The arrow indicates the direction of the Pacific plate motion at 80 mm/yr.
Here Lay et al. (2009) present their interpretation for the earthquake cycle and how the tectonic regime changed during this period of a few decades. I include their figure caption as a blockquote.

Strain accumulation and release scenario for the great Kuril doublet. (a) During the interseismic period, the Pacific –North America (Okhotsk) plate interface is locked along the megathrust. Because of relative strength contrast between subducting and overriding plates, the elastic strain may preferentially accumulate within the elastic layer of the Pacific plate. Below the elastic layer, viscous strain accommodates the deformation and there is along-strike loading by underthrusting of the adjacent region of the arc. (b) During the 2006 earthquake, slip along the megathrust interface allows that segment of the Pacific plate to recover the accumulated slip deficit, and relaxation of accumulated compression or slab pull places the updip shallow region into an extensional strain environment causing the great 2007 extensional event. The region at the elastic-ductile transition (dotted line) deforms by viscous processes during the low strain rate interearthquake period, but will behave elastically during the high strain rate underthrusting event, helping to delay strain release in the overlying elastic lithosphere.
-
References:
- Hayes, G. P., D. J. Wald, and R. L. Johnson, 2012. Slab1.0: A three-dimensional model of global subduction zone geometries in J. Geophys. Res., 117, B01302, doi:10.1029/2011JB008524.
- Lay, T., H. Kanamori, C. J. Ammon, A. R. Hutko, K. Furlong, and L. Rivera, 2009. The 2006 – 2007 Kuril Islands great earthquake sequence in J. Geophys. Res., 114, B11308, doi:10.1029/2008JB006280.
- Rhea, S., Tarr, A.C., Hayes, G., Villaseñor, A., Furlong, K.P., and Benz, H.M., 2010. Seismicity of the Earth 1900-2007, Kuril-Kamchatka arc and vicinity: U.S. Geological Survey Open-File Report 2010-1083-C, 1 map sheet, scale 1:5,000,000.
2 thoughts on “Earthquake Report: Kamchatka!”