I present material about the Cascadia subduction zone for the Friends of the Arcata Marsh (FOAM) held on 7/22/16 at the Arcata Marsh Interpretive Center. This page has some supporting material from this presentation, including the digital presentation file.
Jay is available at: quakejay at gmail.com or Jason.Patton at humboldt.edu
- 2016.07.21 M 4.7 Gorda plate p-1
- 2016.07.21 M 4.7 Gorda plate p-2
Here are my earthquake reports for the M 4.7 earthquake that occurred a day before this talk.

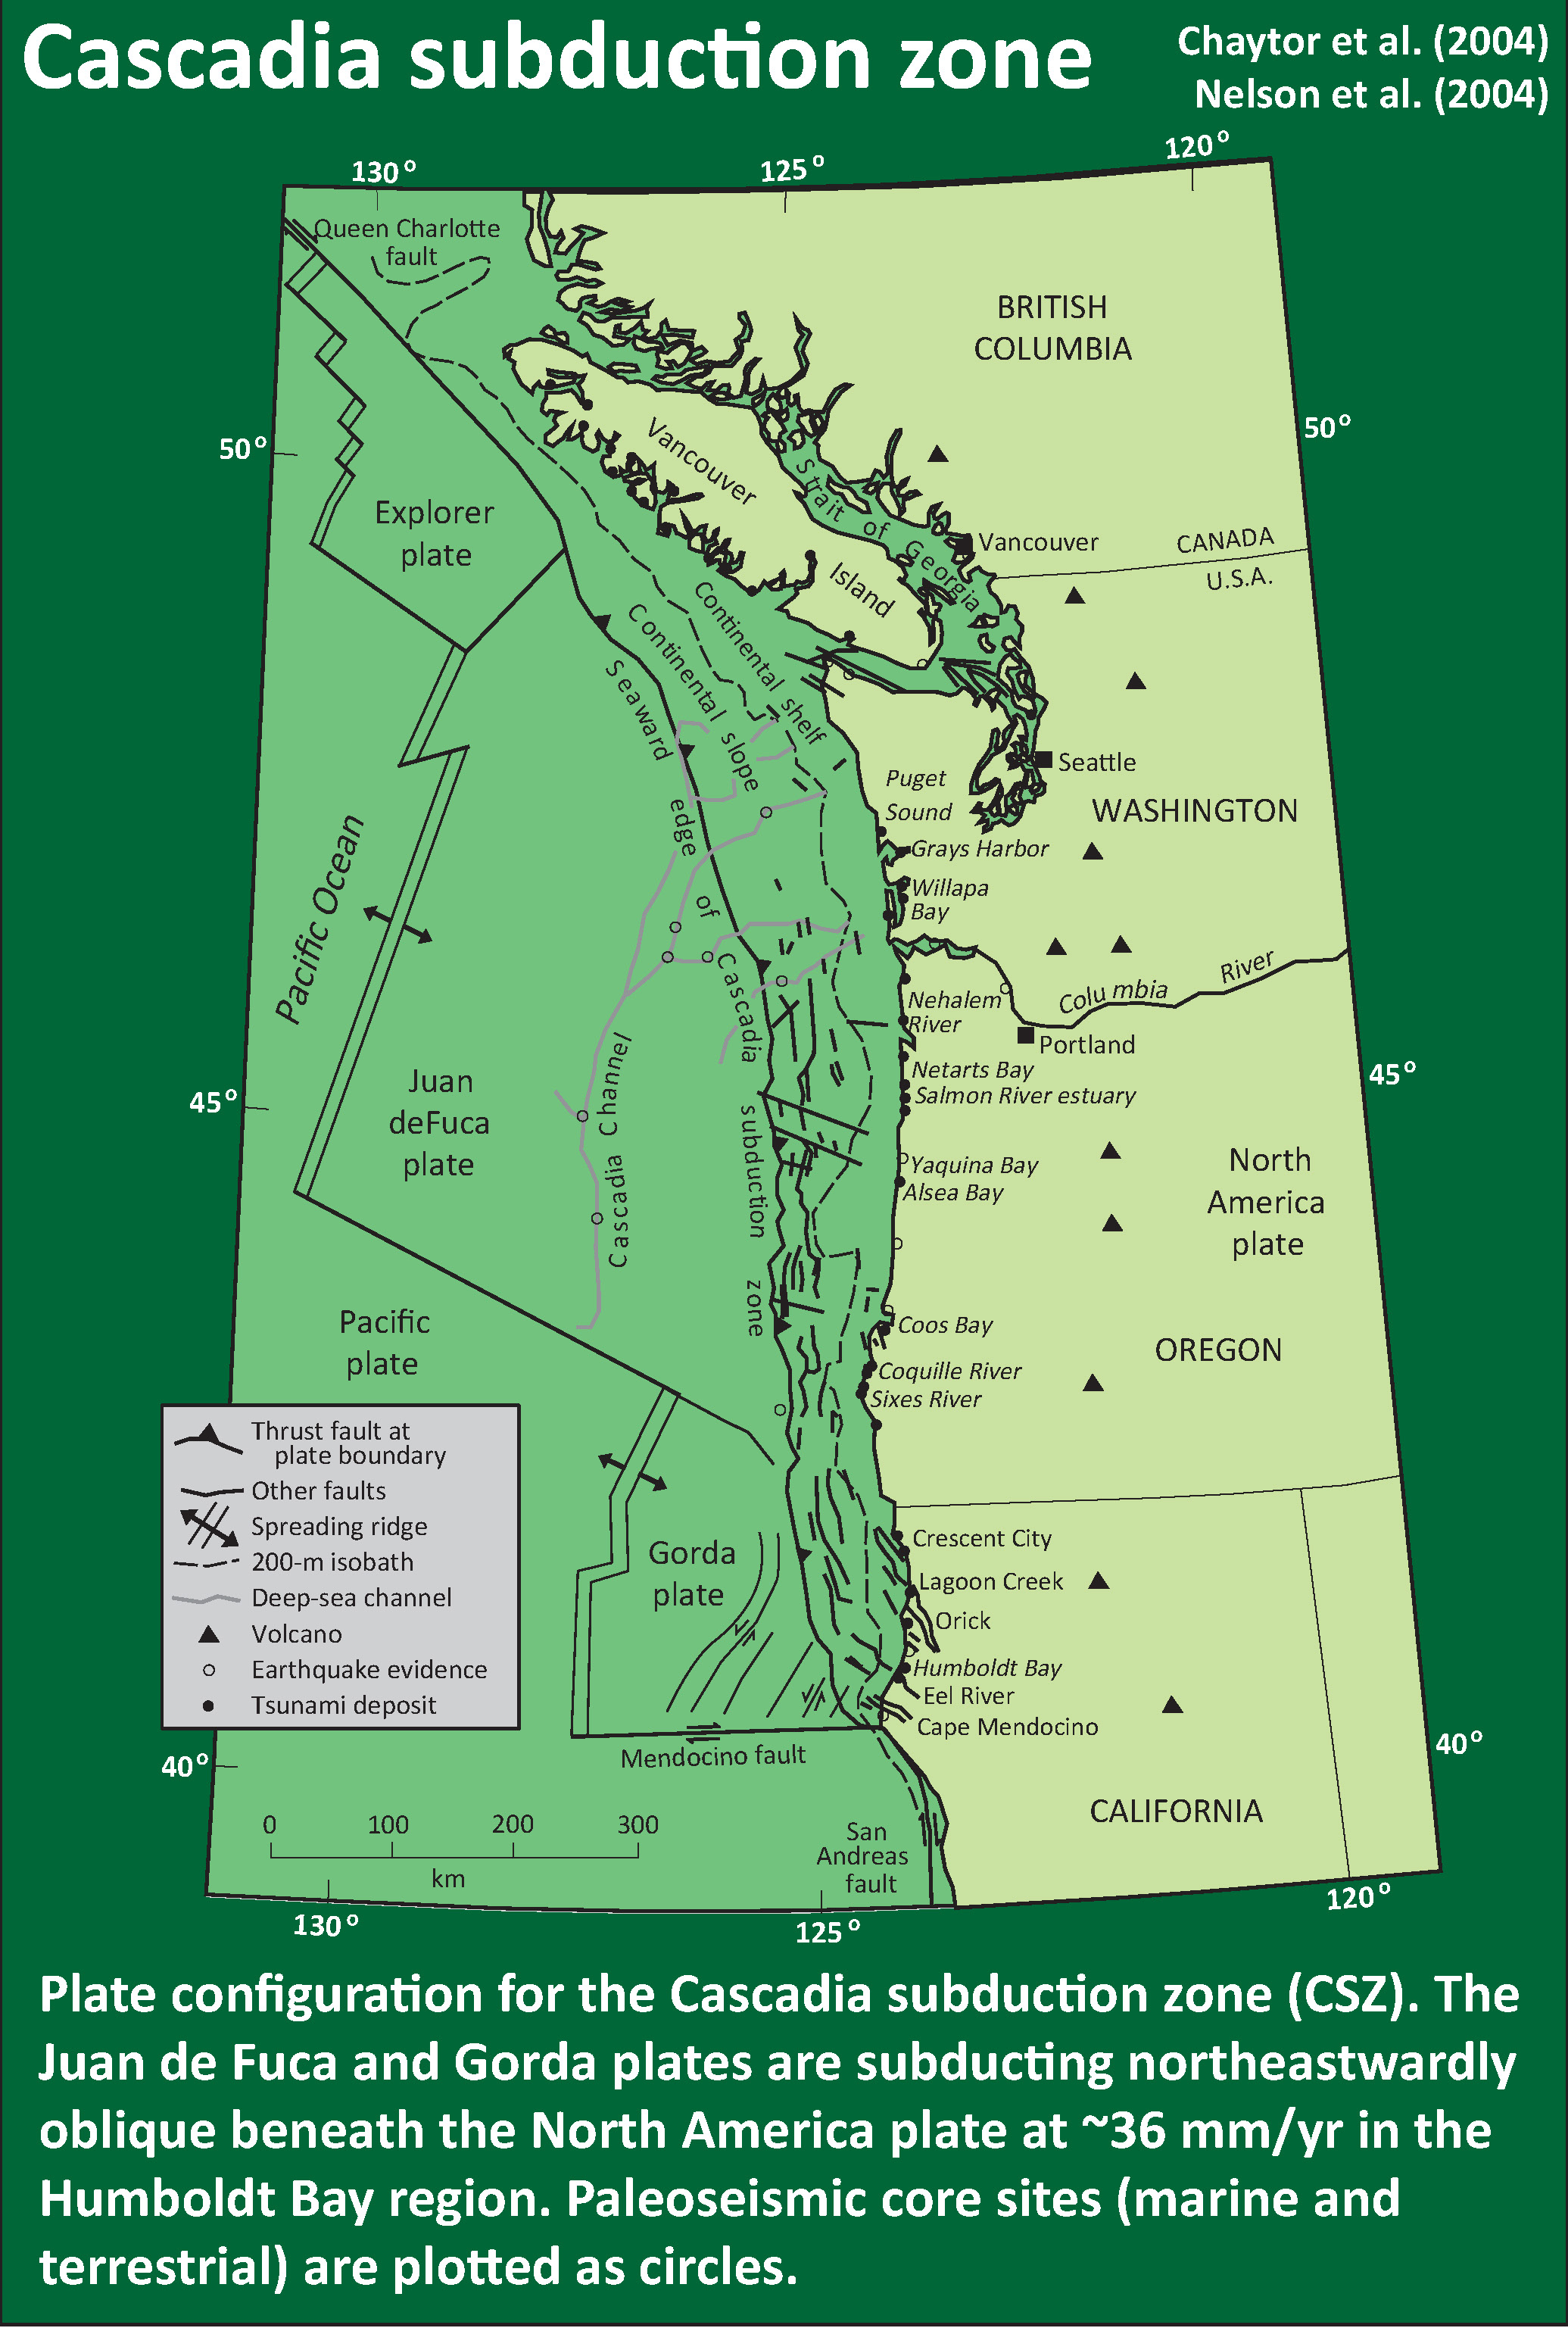
Here is a map of the Cascadia subduction zone (modified from Nelson et al., 2004; Chaytor et al., 2004). I discuss this in my talk and also on this page.

- Biographical Sketch
- Outline of talk
- Overview of the Cascadia subduction zone
- Here is Jay’s Twitter page
Here is some background material about Jay and the talk.
- Here is the digital presentation (50 MB pptx). A draft presentation is in place and will be updated the day of the presentation.
This is the digital presentation
- This is the yt link to the embedded video below.
- This is the link to a downloadable version of the the embedded video below. (275 MB mp4)
This is a video of the presentation
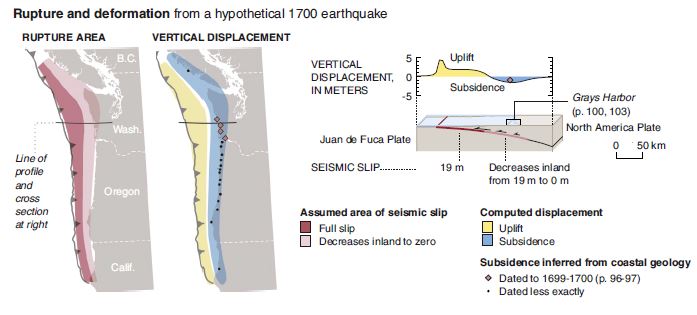
- For the 315th anniversary of the most recent full rupture CSZ earthquake I put together a summary of our state of knowledge about the CSZ and that 1700 A.D. Jan. 26 earthquake. 2015.01.26
- The USGS (and others) put together an educational video about the CSZ. I post this video and other supporting information online here: 2015.10.08
Here are some sources of information about the Cascadia subduction zone
Here is a map of the Cascadia subduction zone, modified from Nelson et al. (2004). The Juan de Fuca and Gorda plates subduct norteastwardly beneath the North America plate at rates ranging from 29- to 45-mm/yr. Sites where evidence of past earthquakes (paleoseismology) are denoted by white dots. Where there is also evidence for past CSZ tsunami, there are black dots. These paleoseismology sites are labeled (e.g. Humboldt Bay). Some submarine paleoseismology core sites are also shown as grey dots. The two main spreading ridges are not labeled, but the northern one is the Juan de Fuca ridge (where oceanic crust is formed for the Juan de Fuca plate) and the southern one is the Gorda rise (where the oceanic crust is formed for the Gorda plate).
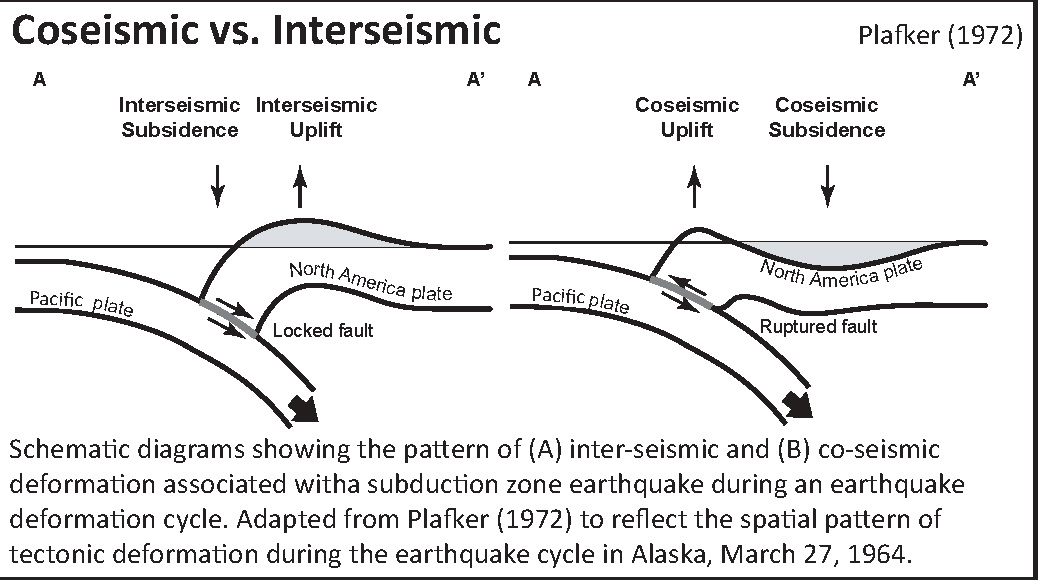
Here is a version of the CSZ cross section alone (Plafker, 1972). This shows two parts of the earthquake cycle: the interseismic part (between earthquakes) and the coseismic part (during earthquakes). Regions that experience uplift during the interseismic period tend to experience subsidence during the coseismic period.
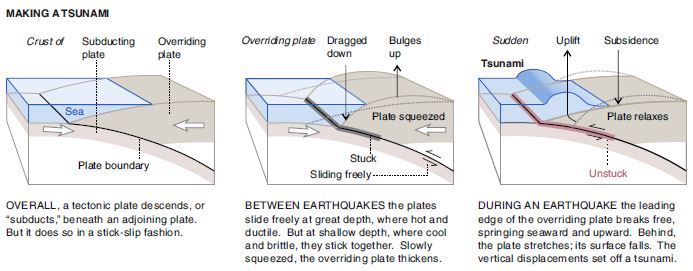
This figure shows how a subduction zone deforms between (interseismic) and during (coseismic) earthquakes. We also can see how a subduction zone generates a tsunami. Atwater et al., 2005.
Here is an animation produced by the folks at Cal Tech following the 2004 Sumatra-Andaman subduction zone earthquake. I have several posts about that earthquake here and here. One may learn more about this animation, as well as download this animation here.
This figure shows the regions that participate in this interseismic and coseismic deformation at Cascadia. Atwater et al., 2005. Black dots on the map show sites where evidence for coseismic subsidence has been found in coastal marshes, lakes, and estuaries.
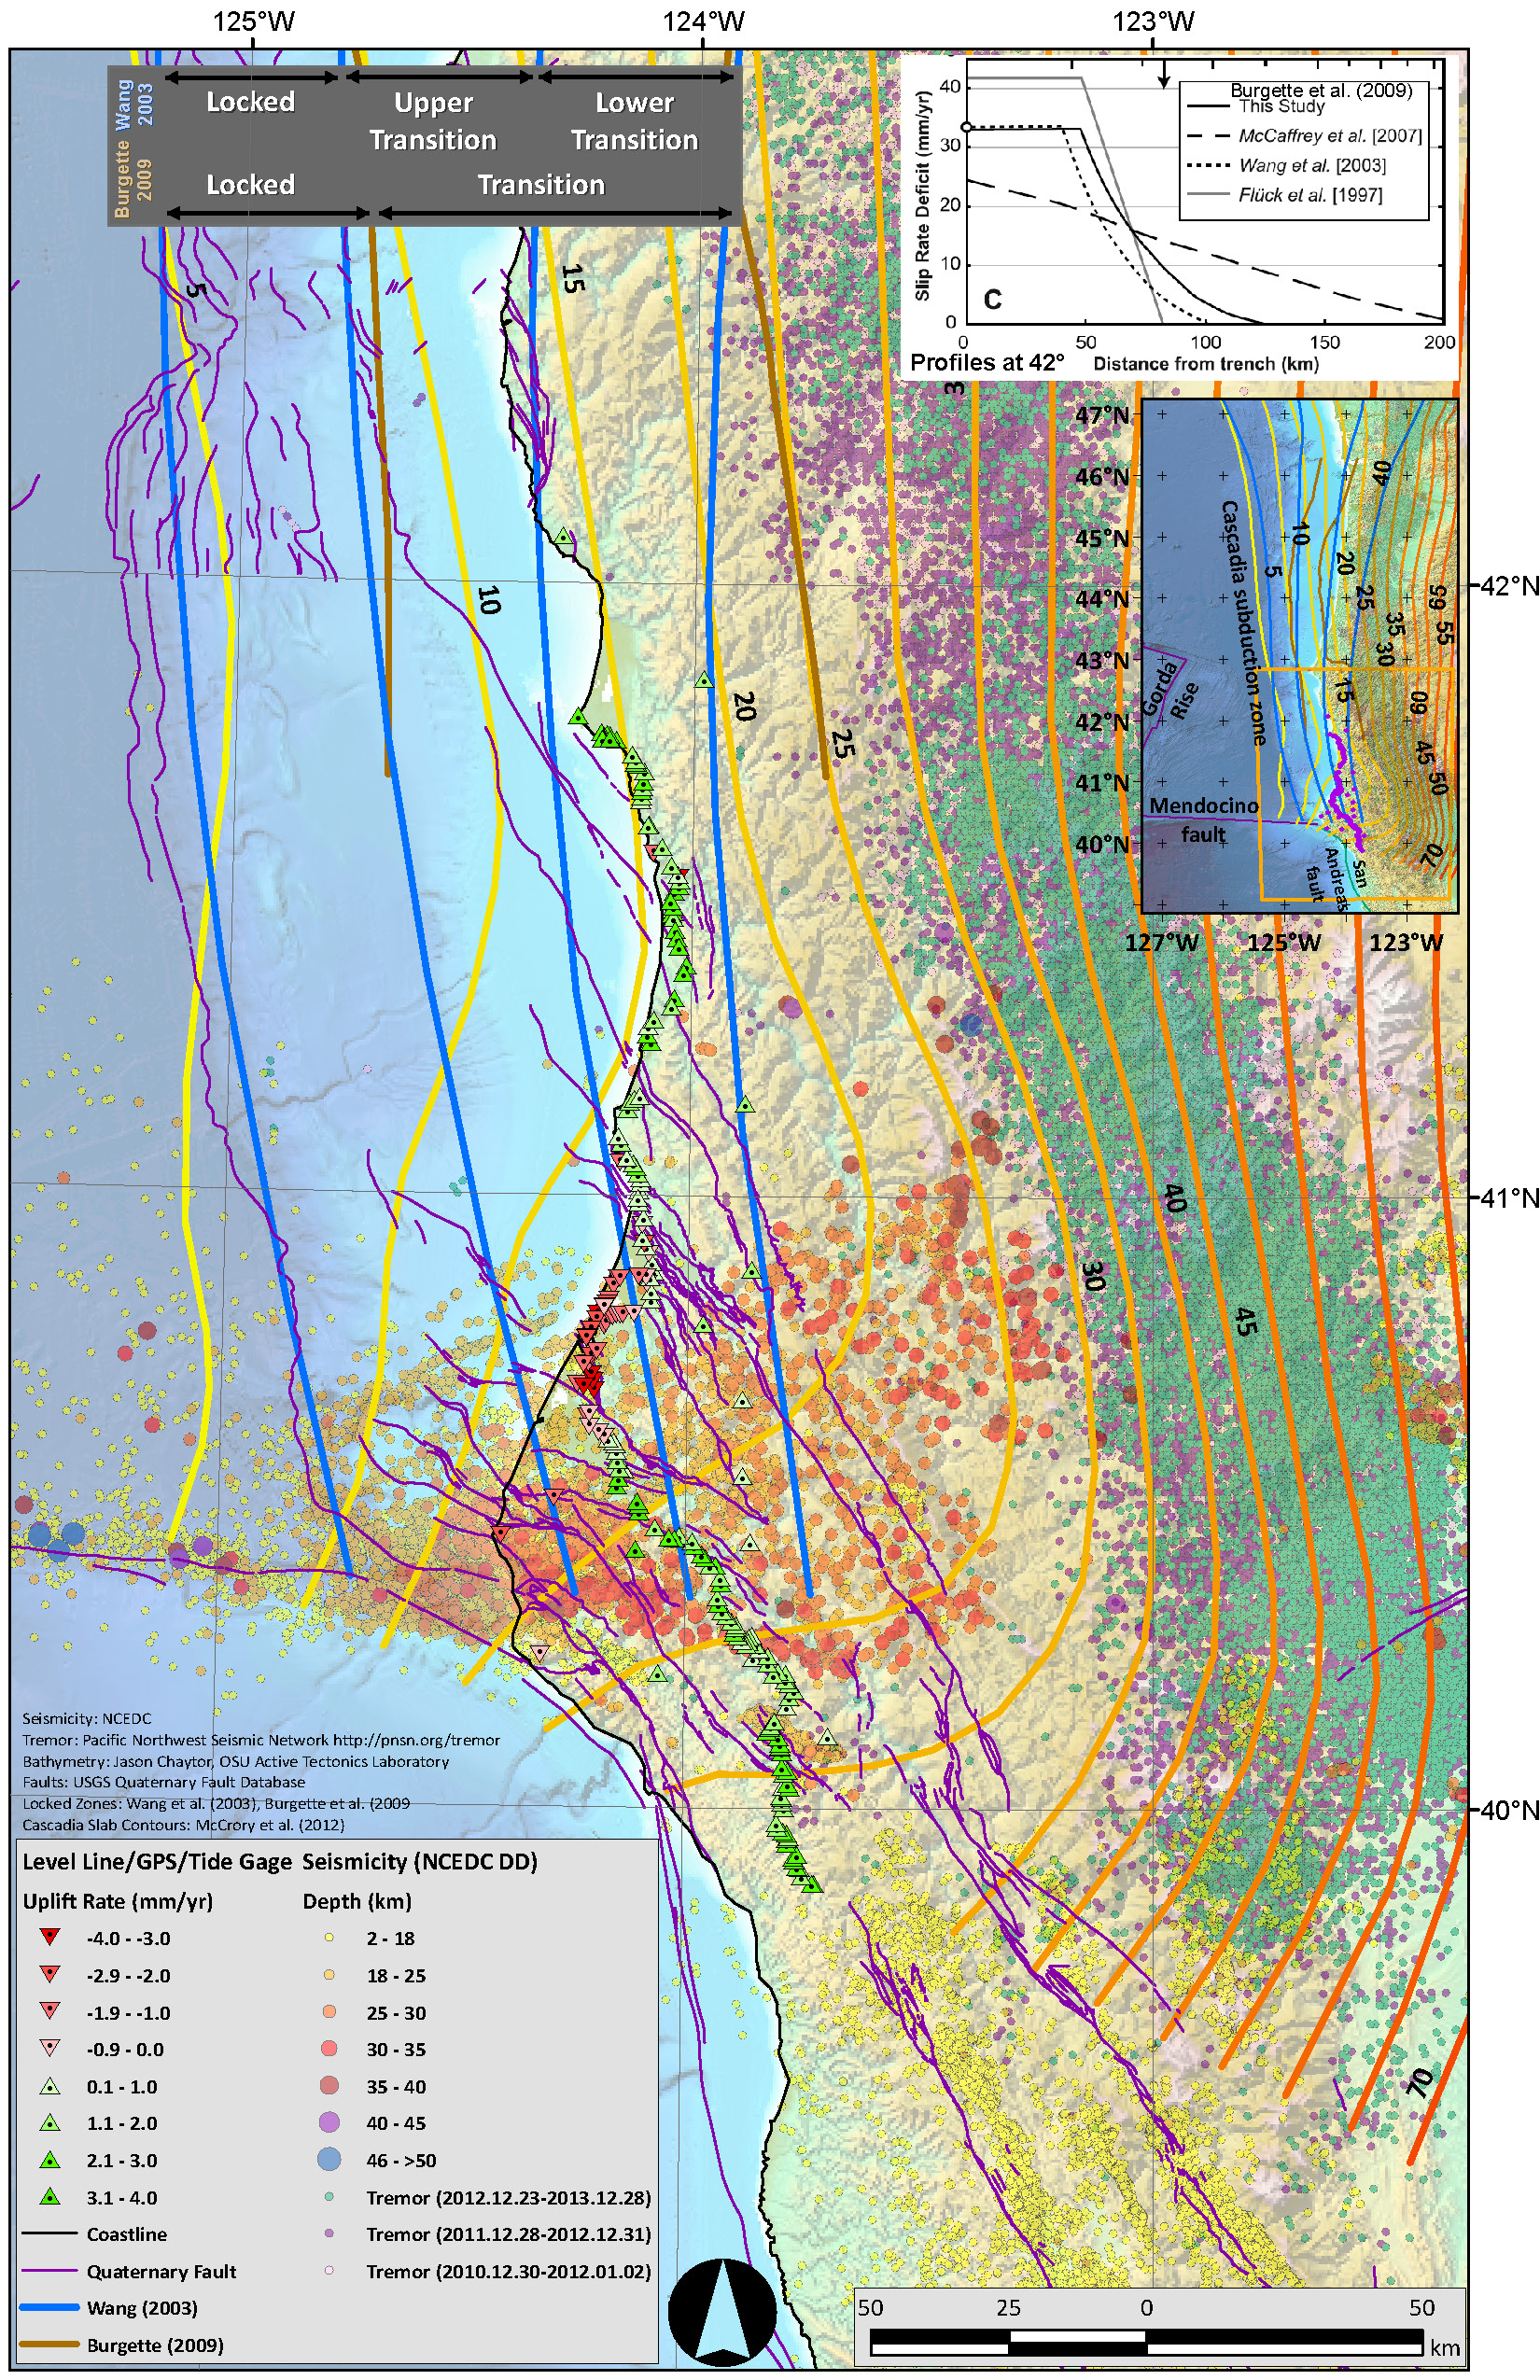
Here is a map showing a number of data sets. Seismicity is plotted versus depth (NCEDC). Tremor is plotted (Pacific Northwest Seismic Network). Vertical Deformation rates are plotted (unpublished). Slab depth contours (km) are plotted (McCrory et al., 2006). Fault locking zones are plotted (Wang et al., 2003; Burgette et al., 2009). Bob McPherson (Humboldt State University, Department of Geology) is currently working on a research paper where he will discuss how the seismicity reveals the location of the seismogenically locked fault zone.
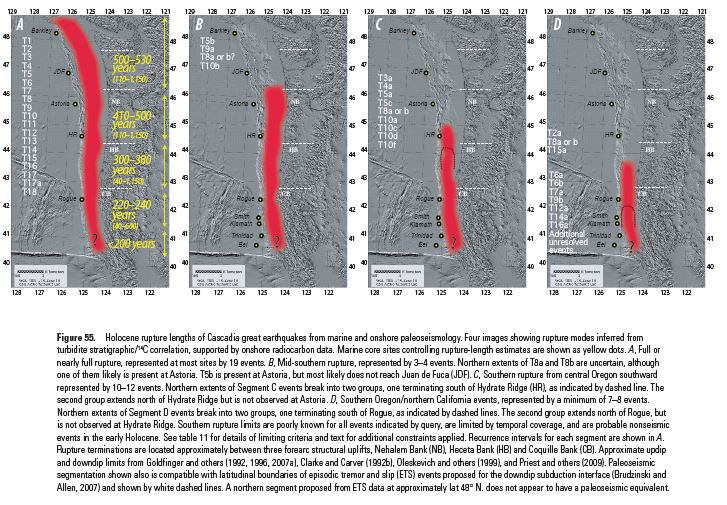
This map shows the various possible prehistoric earthquake rupture regions (patches) for the past 10,000 years. Goldfinger et al., 2012. These rupture scenarios have been adopted by the USGS hazards team that determines the seismic hazards for the USA.
-
Here are some links to other online resources about the Cascadia subduction zone:
- The Redwood Coast Tsunami Work Group Living on Shaky Ground: Preparing for the next Cascadia subduction zone earthquake and tsunami
- USGS: Atwater et al. (2005): The Orphan Tsunami
- USGS: Prehistoric Earthquakes along the Cascadia subduction zone: Goldfinger et al. (2012): The Turbidite Record
- Tsunami Hazard Maps for the entire state of Oregon: Oregon Tsunami Hazard Mitigation Program
- NOAA Center for Tsunami Research: Pacific Marine Environmental Laboratory
Here is an educational video about Cascadia subduction zone earthquakes and tsunamis.
Here is a tsunami hindcast for the Jan 26, 1700 Cascadia subduction zone megathrust earthquake that may have ruptured all the way south to Humboldt Bay. This is the download link for the embedded video below (35 MB mp4).
Here is an animation showing the Holocene record of earthquakes along the Cascadia subduction zone (Goldfinger et al., 2012).
Here is an animation of a Cascadia subduction zone earthquake generated tsunami. This is the download link for the embedded video below (15 MB mp4).
Here is an animation of the numerical simulation for tsunami inundation at Cannon Beach (Ecola Creek).
This was prepared by Rob Witter (Witter, 2008 ).
- 2014.03.09 M 6.8 Gorda plate p-1
- 2014.03.23 M 6.8 Gorda plate p-2
- 2014.03.13 M 5.2 Gorda Rise
- 2015.11.18 M 3.2 Gorda plate
- 2015.06.01 M 5.8 Blanco fracture zone p-1
- 2015.06.01 M 5.8 Blanco fracture zone p-2 (animations)
- 2015.01.28 M 5.7 Mendocino fault
- 2015.11.01 M 4.3 Mendocino fault
Earthquake Reports
Elsewhere on my website, I summarize these reports by region here. I also post some of the earthquake reports associated with different regions of Cascadia here:
Gorda plate
Blanco fracture zone
Mendocino fault
-
References:
- Atwater, B.F., Musumi-Rokkaku, S., Satake, K., Tsuju, Y., Eueda, K., and Yamaguchi, D.K., 2005. The Orphan Tsunami of 1700—Japanese Clues to a Parent Earthquake in North America, USGS Professional Paper 1707, USGS, Reston, VA, 144 pp.
- Chaytor, J.D., Goldfinger, C., Dziak, R.P., and Fox, C.G., 2004. Active deformation of the Gorda plate: Constraining deformation models with new geophysical data: Geology v. 32, p. 353-356.
- Goldfinger, C., Nelson, C.H., Morey, A., Johnson, J.E., Gutierrez-Pastor, J., Eriksson, A.T., Karabanov, E., Patton, J., Gràcia, E., Enkin, R., Dallimore, A., Dunhill, G., and Vallier, T., 2012. Turbidite Event History: Methods and Implications for Holocene Paleoseismicity of the Cascadia Subduction Zone, USGS Professional Paper # 1661F. U.S. Geological Survey, Reston, VA, 184 pp.
- McCrory, P. A., Blair, J. L., Oppenheimer, D. H., and Walter, S. R., 2006. Depth to the Juan de Fuca slab beneath the Cascadia subduction margin; a 3-D model for sorting earthquakes U. S. Geological Survey
- Nelson, A.R., Kelsey, H.M., Witter, R.C., 2006. Great earthquakes of variable magnitude at the Cascadia subduction zone. Quaternary Research 65, 354-365.
- Patton, J. R., Goldfinger, C., Morey, A. E., Romsos, C., Black, B., Djadjadihardja, Y., and Udrekh, 2013. Seismoturbidite record as preserved at core sites at the Cascadia and Sumatra–Andaman subduction zones, Nat. Hazards Earth Syst. Sci., 13, 833-867, doi:10.5194/nhess-13-833-2013, 2013.
- Plafker, G., 1972. Alaskan earthquake of 1964 and Chilean earthquake of 1960: Implications for arc tectonics in Journal of Geophysical Research, v. 77, p. 901-925.
- Wang, K., Wells, R., Mazzotti, S., Hyndman, R. D., and Sagiya, T., 2003. A revised dislocation model of interseismic deformation of the Cascadia subduction zone Journal of Geophysical Research, B, Solid Earth and Planets v. 108, no. 1.
- Witter, R.C., 200. Prehistoric Cascadia tsunami inundation and runup at Cannon Beach, Clatsop County, Oregon, Department of Geology and Mineral Industries, Open File Report O-08-12, 46 pp.