
There was a large thrust earthquake along the Scotia plate today. Here is the USGS website for this M 7.4 earthquake. This is a very interesting region of the world with a very cool history.
There is an east verging (dips to the west) subduction zone where the South America plate subducts beneath the Sandwich plate (mmmmm, sandwiches). The USGS convergence rate shown on Google Earth is 7.8 cm/yr (for reference, this is about twice that of the Cascadia subduction zone). There is a volcanic arc associated with this subduction zone (the Islands west of the Scotia subduction zone). To the east, there is a spreading ridge that separates the Sandwich and Scotia plates. On the northern and southern boundaries of the Scotia plate are left-lateral strike-slip plate boundary transform faults. In the past several years, there have been earthquakes in most of these regions. I list some of these below.
-
Recent seismicity accounted for in earthjay.com Earthquake Reports
- 2013.07.15 M 7.3 Sandwich Islands USGS site
- 2013.07.15 M 7.3 Sandwich Islands USGS site
- 2013.11.17 M 6.8 Scotia Sea USGS site (southern strike-slip boundary; foreshock to the 7.8)
- 2013.11.17 M 7.8 Scotia Sea USGS site (southern strike-slip boundary)
- 2013.11.25 M 7.0 Scotia Sea USGS site (northern strike-slip boundary; possibly related to the earthquakes from a week earlier)
- 2014.03.12 M 6.4 south Sandwich Islands USGS site (along transform fault to the east of the Scotia subduction zone)
- 2014.06.29 M 6.9 Scotia subduction zone USGS site
- 2015.02.16 M 6.2 Scotia subduction zone USGS site (nice thrust earthquake southeast of today’s M 7.4 earthquake)
- 2015.05.25 M 5.8 Sandwich Islands USGS site (nice thrust earthquake I incorrectly labeled on my interpretive poster)
- 2016.05.28 M 7.2 Scotia subduction zone USGS site (happened while I was at sea, so I did not make a report for this EQ)
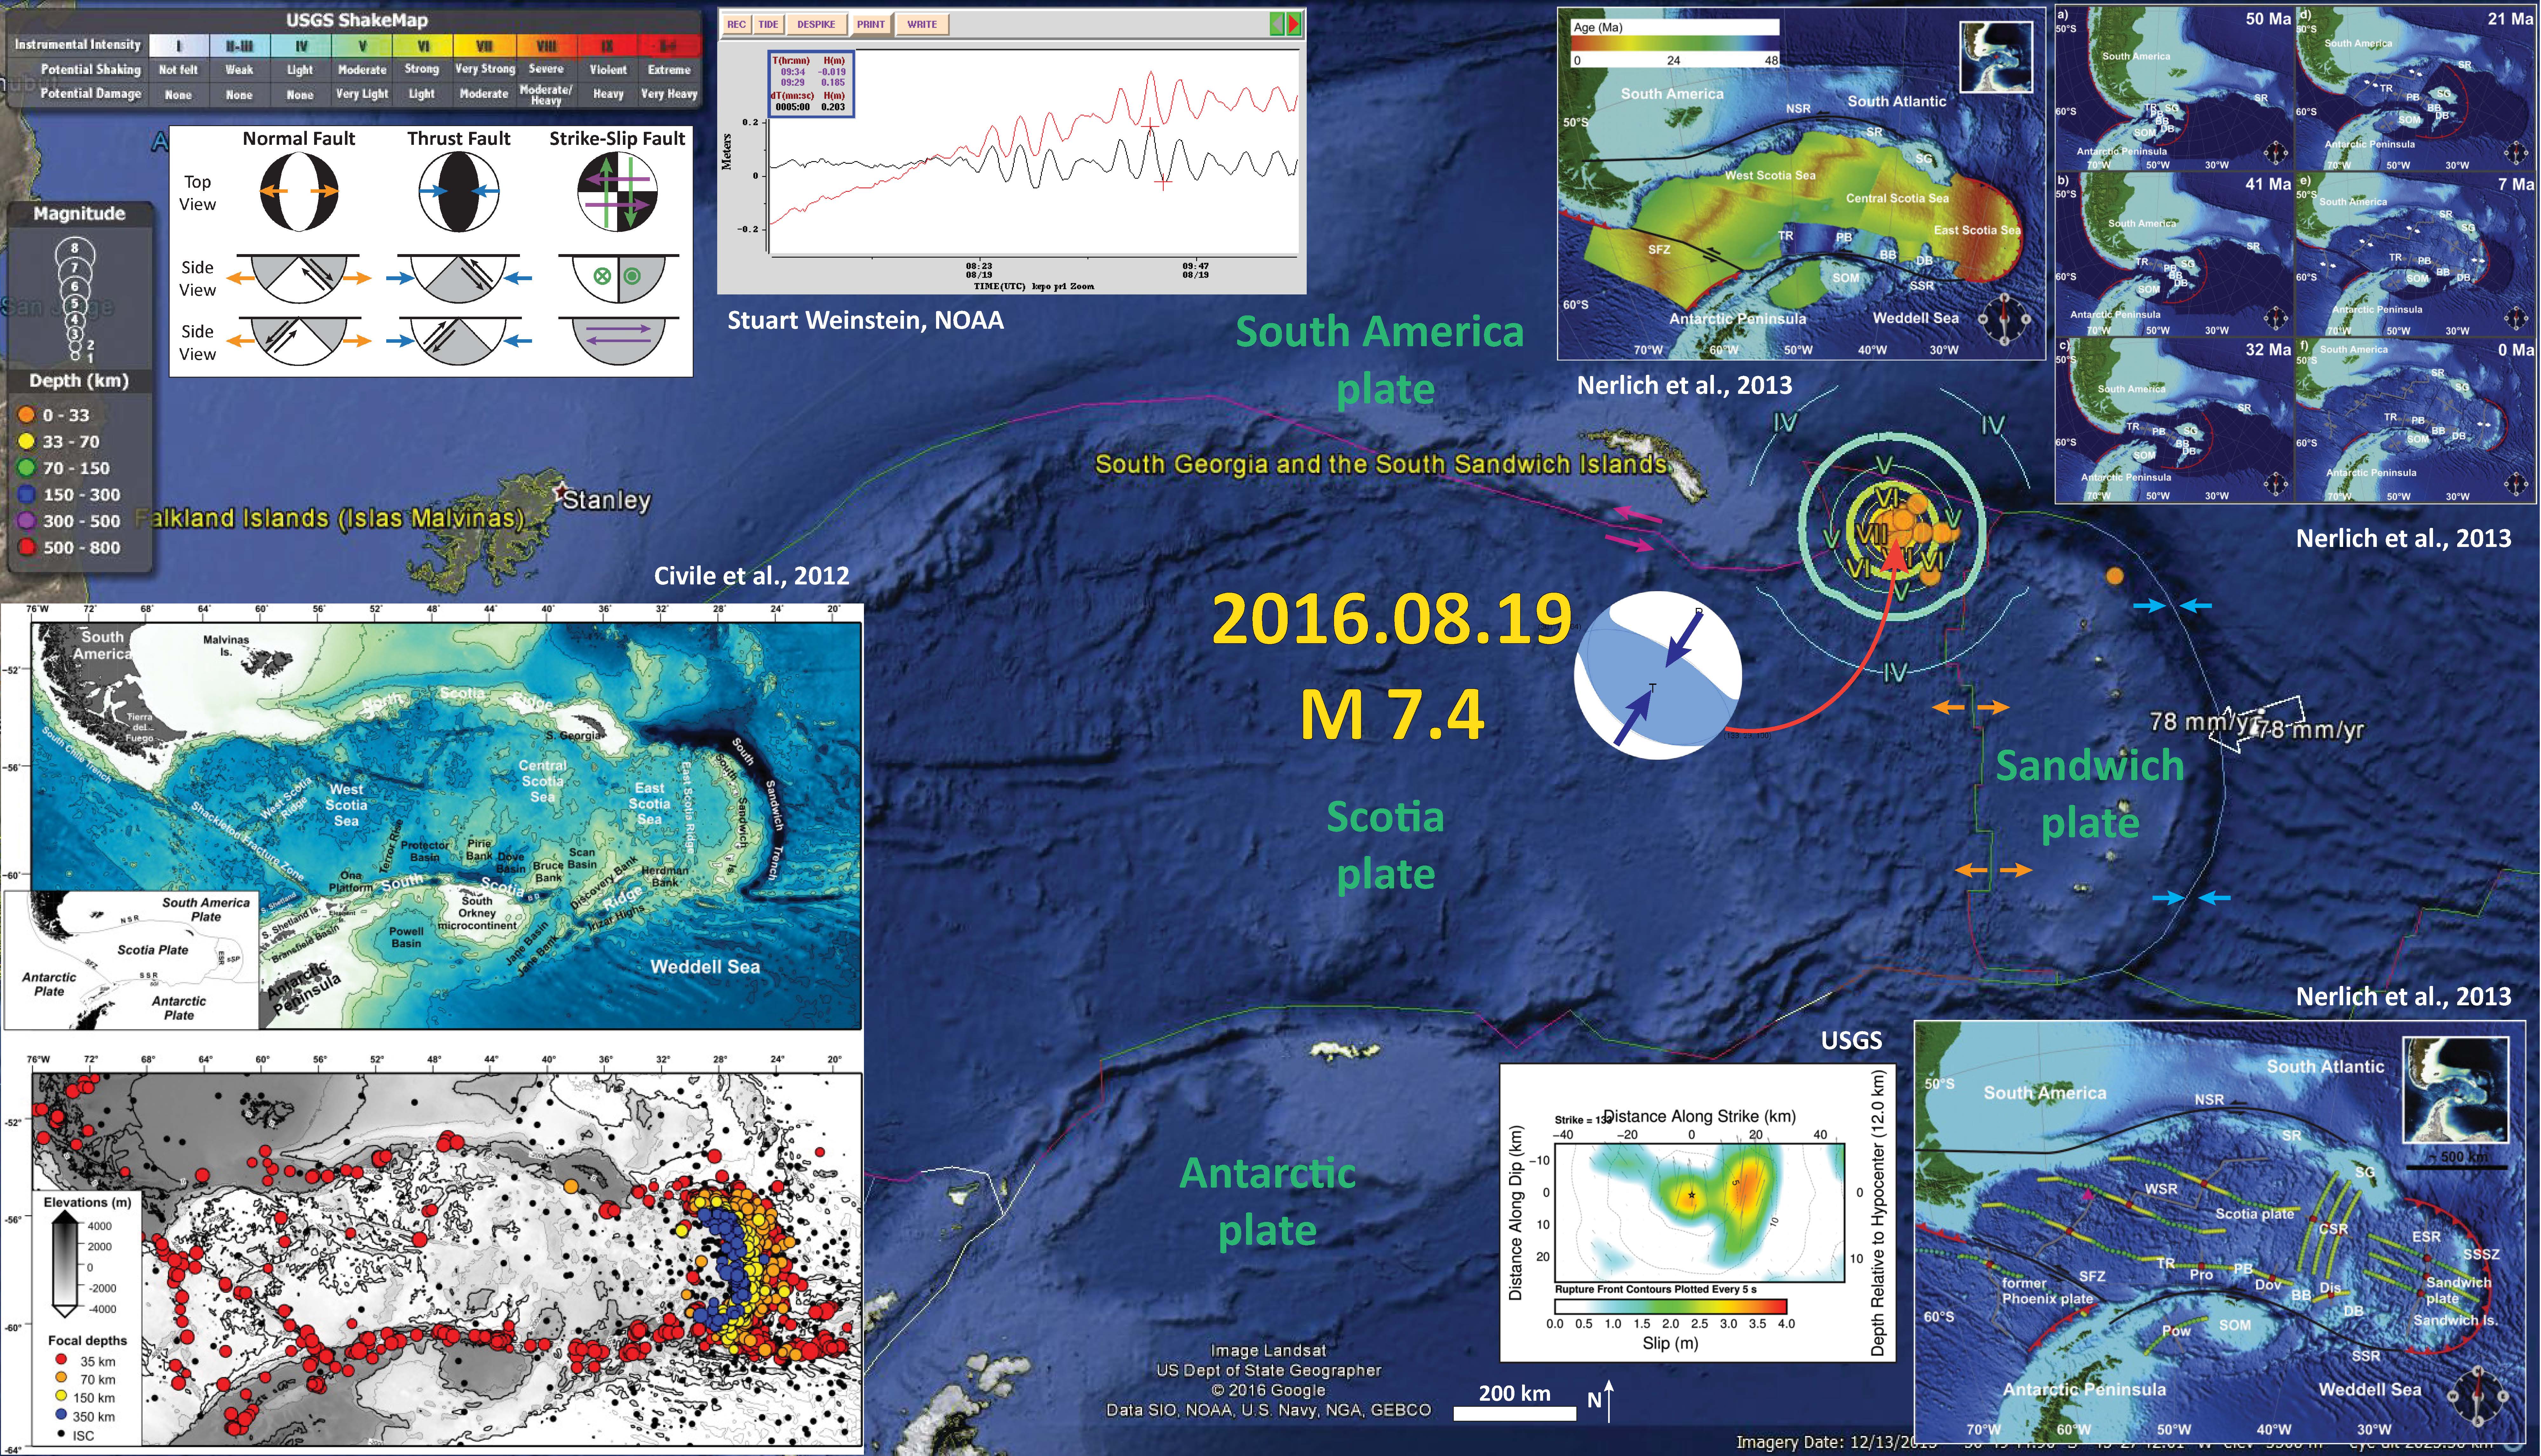
Here is my interpretive map that shows the epicenter, along with the shaking intensity contours. These contours use the Modified Mercalli Intensity (MMI) scale. The MMI is a qualitative measure of shaking intensity. More on the MMI scale can be found here and here. This is based upon a computer model estimate of ground motions, different from the “Did You Feel It?” estimate of ground motions that is actually based on real observations.
-
Here are some Google Earth kml/kmz files relevant to today’s earthquake.
- with the earthquakes plotted on the interpretive poster below
- the USGS event file I used for the interpretive poster below
I placed a moment tensor / focal mechanism legend on the poster. There is more material from the USGS web sites about moment tensors and focal mechanisms (the beach ball symbols). Both moment tensors and focal mechanisms are solutions to seismologic data that reveal two possible interpretations for fault orientation and sense of motion. One must use other information, like the regional tectonics, to interpret which of the two possibilities is more likely. This is an earthquake that occurred along a northwest striking thrust or reverse fault. The fault may be dipping in the northeast or southwest direction. My guess, based upon the orientation of the subduction zone, that this fault is dipping in the southwest direction. However, it could be antithetic to the megathrust (a back thrust), so we cannot be sure without more information or analyses.
-
I include some inset figures and maps.
- In the lower left corner, there are two figures from Civile et al. (2012). The upper panel is a map of the region that shows different geographical names and locations labeled upon a basemap that displays water depth (bathymetry) as different shades of blue (darker blue = deeper). The lower panel uses a basemap with generalized elevation as gray scale, but with historic seismicity plotted as dots with colors representing depth.
- To the right of the moment tensor legend is a plot of water surface elevation observations from a tide gage as reported by NOAA (Stu Weinstein).
- In the lower right corner there is a map that shows the tectonics of this region (Nerlich et al., 2013). There are colored lines with red in the middle that turns into yellow and then green. These colors represent the age of the lithospere (red = youngest). The red regions are generally associated with spreading ridges, where oceanic lithosphere is created (I love making statements about creation in an earthquake report).
- To the left of that is the fault plane solution from the USGS (see link to the USGS site above to find out more about this solution). The USGS uses seismic wave data and estimates of the fault location to iteratively estimate the magnitude and spatial distribution of slip along the fault. Color represents the magnitude and there are vectors that represent the direction (also magnitude) of the slip during this earthquake. This is just an estimate.
- In the upper right corner is a figure from Nerlich et al. (2013) that shows their interpretation of the tectonic evolution of this region. I show this figure below and include their figure caption as a blockquote.
- To the left of that is a map that shows an estimate of plate age as calculated/modeled by Nerlich et al. (2013). Red colors represent the youngest lithosphere and green colors represent older lithosphere.
-
Here are some of the figures included in my interpretive poster above.
- Here is the physiographic map and the map that shows historic seismicity. Note how the earthquakes get deeper from east to west along the Scotia subduction zone (as the South America plate subducts westward beneath the Sandwich plate, the megathrust fault gets deeper. The Civile et al. (2012) paper is particularly relevant to the strike-slip faults on the southern boundary of the Scotia plate. I include their figure caption below as a blockquote.
- The tectonic setting for this region from Nerlich et al. (2013). I include their figure caption below as a blockquote.
- Here is the kinematic tectonic reconstruction from Nerlich et al. (2013). The panel begins in the upper left at 50 million years ago. I include their figure caption below as a blockquote.
- Nerlich et al. (2013) used asthenospheric flow estimates, their kinematic history model, and a dynamic topography deconvoloution method (using 4DPlates; Clark et al., 2012) to model the age of the oceanic lithosphere in this region. I include their figure caption below as a blockquote.

(top panel) Physiographic map of the Scotia Arc, with the main geological provinces discussed in the text. Bathymetric contours from satellite-derived data (Smith and Sandwell, 1997). Box shows the present-day plate tectonic sketch for the Scotia Sea and surrounding regions. NSR, North Scotia Ridge; SSR, South Scotia Ridge; ESR, East Scotia Ridge; SFZ, Shackleton Fracture Zone; BD, Bruce Deep; SSP, South Shetland plate; sSP, South Sandwich plate. (bottom panel) Distribution of earthquakes in the Scotia Arc region. Epicenters and focal depths are obtained from EHB Bulletin (Engdahl et al., 1998). EHB shallow (red), intermediate (orange and yellow), and deep (blue), earthquakes are shown as circles. Smaller black circles represent earthquakes located by ISC (http://www.isc.ac.uk).

View of Scotia Sea consisting of the Scotia and Sandwich plates, located in between the Antarctic Peninsula and South America (see also insert map, where the red dot indicates the center of the top view map). The region is framed by transform boundaries in the north (North Scotia Ridge (NSR)), south (South Scotia Ridge (SSR)), west (Shackelton Fracture Zone (SFZ)), and the South Sandwich subduction zone (SSSZ) in the east. Other features are Shag Rocks (SR), South Georgia (SG), and the South Orkney Microcontinent (SOM). Flowlines displaying motion paths of different continental fragments are shown in green. Active spreading (East Scotia Ridge (ESR)) exists in the East Scotia Sea. Extinct spreading ridges are found in theWest Scotia Sea (West Scotia Ridge (WSR)), Central Scotia Sea (Central Scotia Ridge (CSR) which remains controversial; see Subsection 2.2) and in the Protector (Pro), Dove (Dov), and Discovery Basins (Dis), respectively, which are bounded by presumably — as some discussion on their origin persists — South American continental fragments (Terror Rise (TR), Pirie Bank (PB), Discovery Bank (DB)). Extinct ridges are also found on the boundary between the Antarctic plate and former Phoenix plate as well as in the Powell Basin (Pow). Location of the dredge sample with Pacific mantle type signature (Pearce et al., 2001) [see discussion] is marked by a triangle.

Tectonic reconstructions corresponding to 50 (a), 41 (b), 32 (c), 21 (d), 7 (e) and 0 Ma (f); labels as in Fig. 1; present-day bathymetry is shown (i.e. no age-masking). White/grey arrows indicate active/inactive spreading. 50 Ma ago, South America and Antarctica are connected by a coherent bridge of continental fragments. At 41 Ma, separation between South America and Antarctica and subduction behind Discovery Bank and South Georgia has started, as suggested by Barker (2001). Protector Basin has opened. 32 Ma ago, active spreading occurs along the West Scotia Ridge but has ceased in Dove Basin. At 21 Ma, further subduction behind Discovery Bank leads to opening of Discovery Basin. Moreover, subduction behind South Georgia is about to cause back-arc spreading in the Central Scotia Sea. Powell Basin is already fully open, placing the South Orkney Microcontinent to its present position relative to Antarctica. Seafloor spreading lasts along the West Scotia Ridge. 7 Ma ago spreading occurs along the West and East Scotia Ridges and ceases along the Central Scotia Ridge.

Synthetic age-grid based on the reconstruction model as shown in Fig. 2.
-
References
- Civile, D., Lodolo, E., Vuan, A., and Loreto, M.F., 2012. Tectonics of the Scotia–Antarctica plate boundary constrained from seismic and seismological data in Tectonophysics, v. 550-553, p. 17-34.
- Clark, S.R., Skogseid, J., Stensby, V., Smethurst, M.A., Tarrou, C., Bruaset, A.M., Thurmond, A.K., 2012. 4DPlates: on the fly visualization of multilayer geoscientific datasets in a plate tectonic environment in Computers & Geosciences 45, 46–51 http://dx.doi.org/10.1016/j.cageo.2012.03.015.
- Nerlich, R., Clark, S.R., and Bunge, H-P., 2013. The Scotia Sea gateway: No outlet for Pacific mantle in Tectonophysics, v. 604, p. 41-50.