We just had a large magnitude earthquake offshore of El Salvador. Here is the USGS web page for the earthquake. Based on the magnitude and depth, it is not expected to have triggered a tsunami that would reach the coast of CA, OR, nor WA.
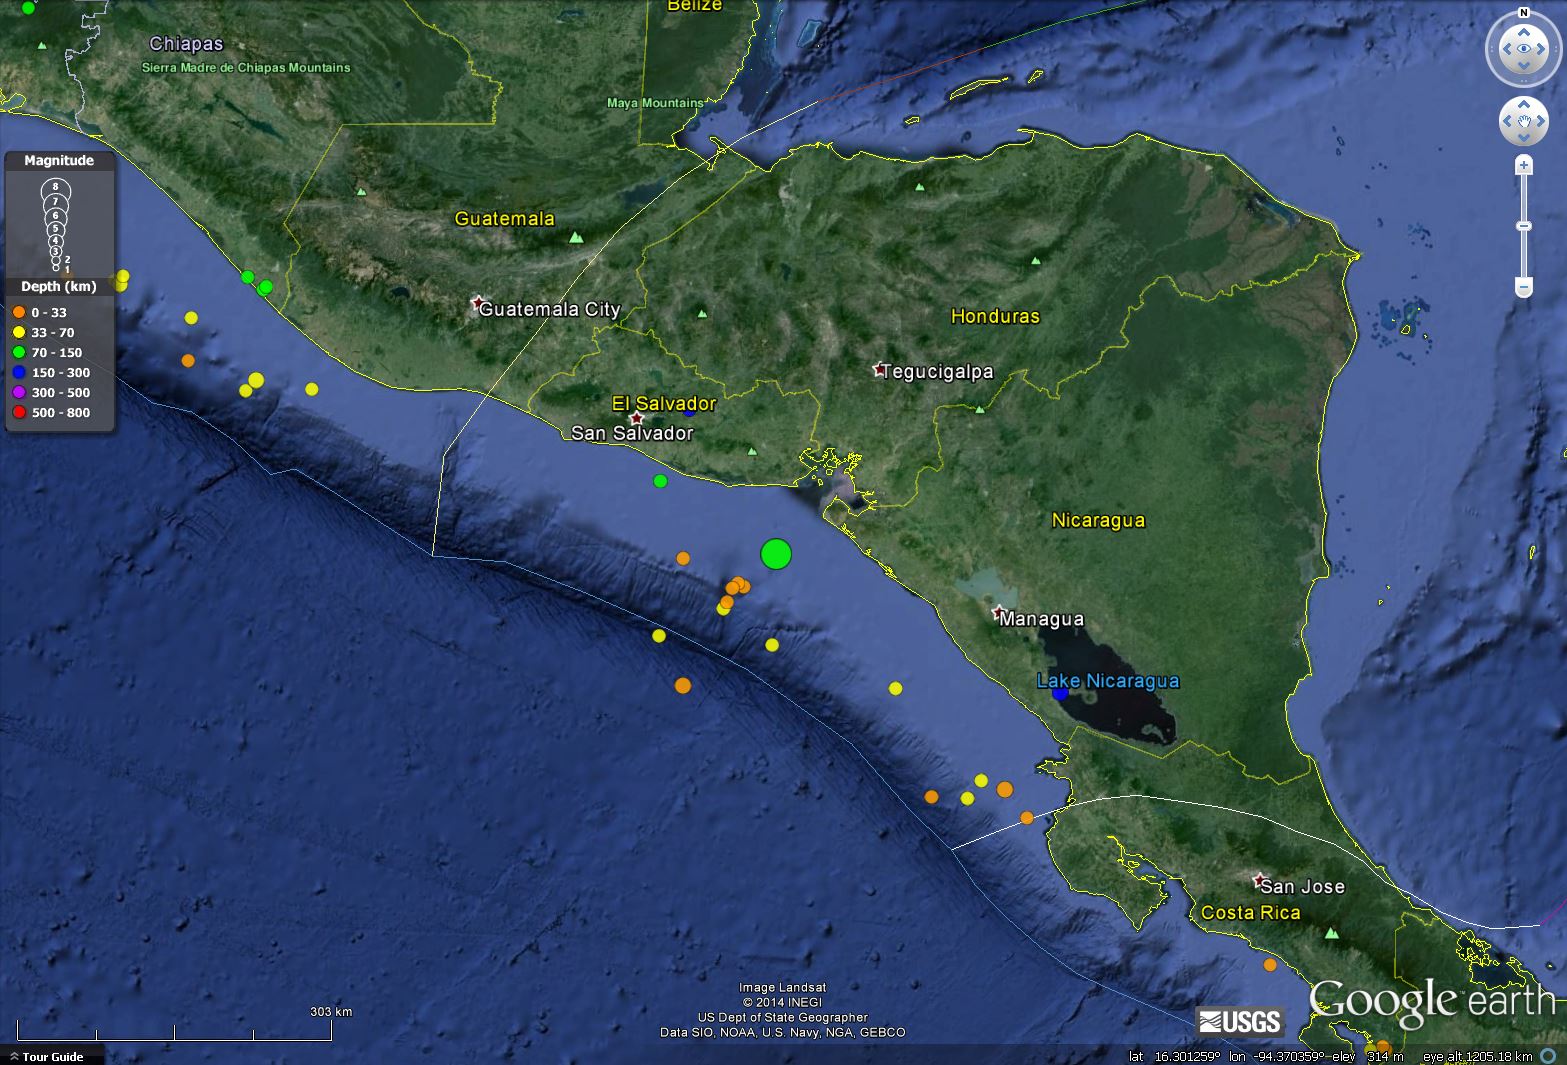
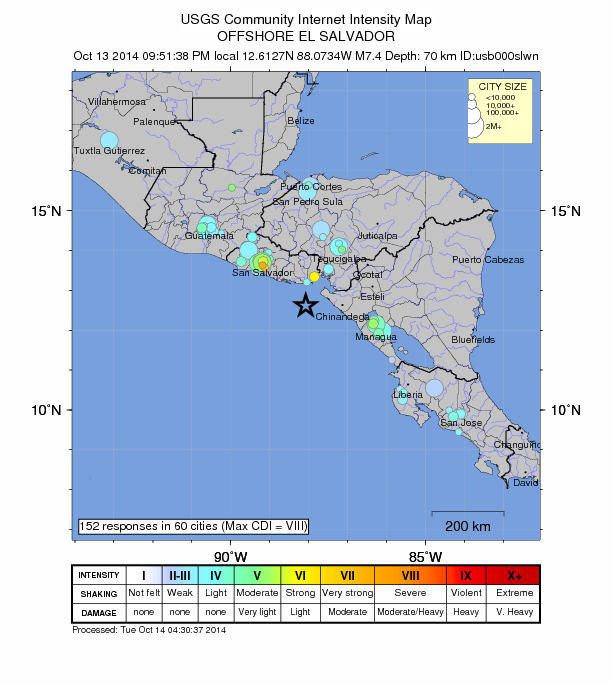
Here is a map that shows the region. The epicenter is plotted in green (the initial depth was set at 70 km, so it plotted in green. the depth was updated to 40 km, so will plot in yellow in other maps.).
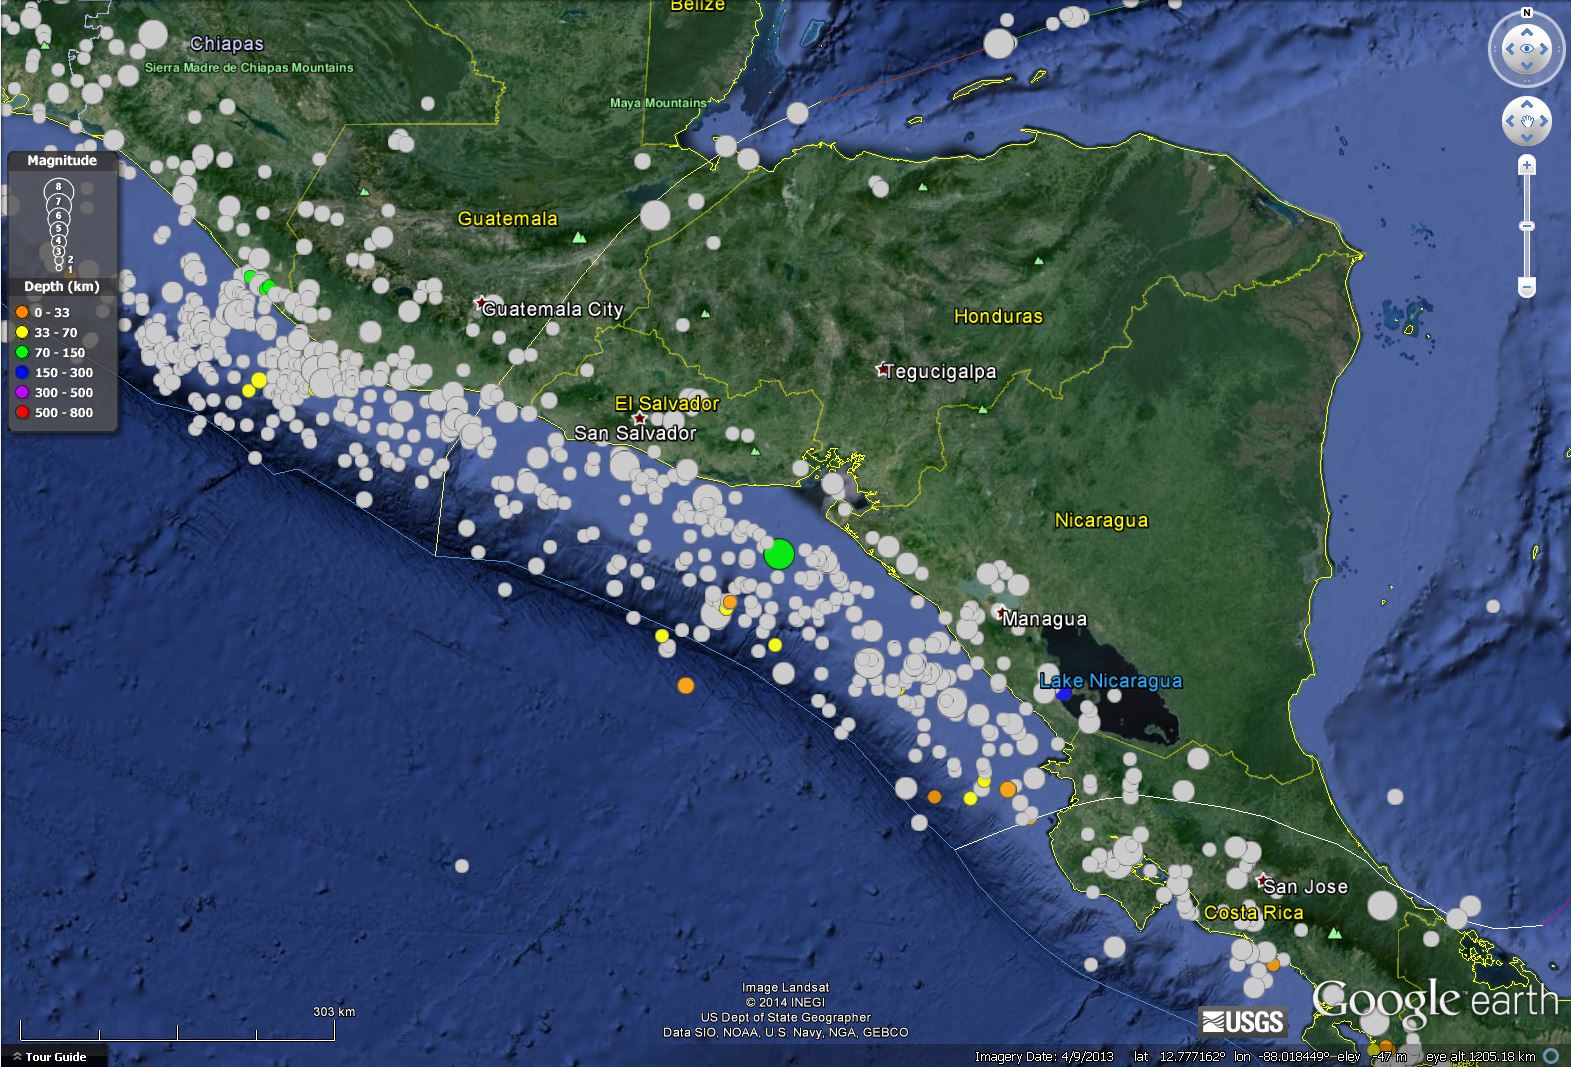
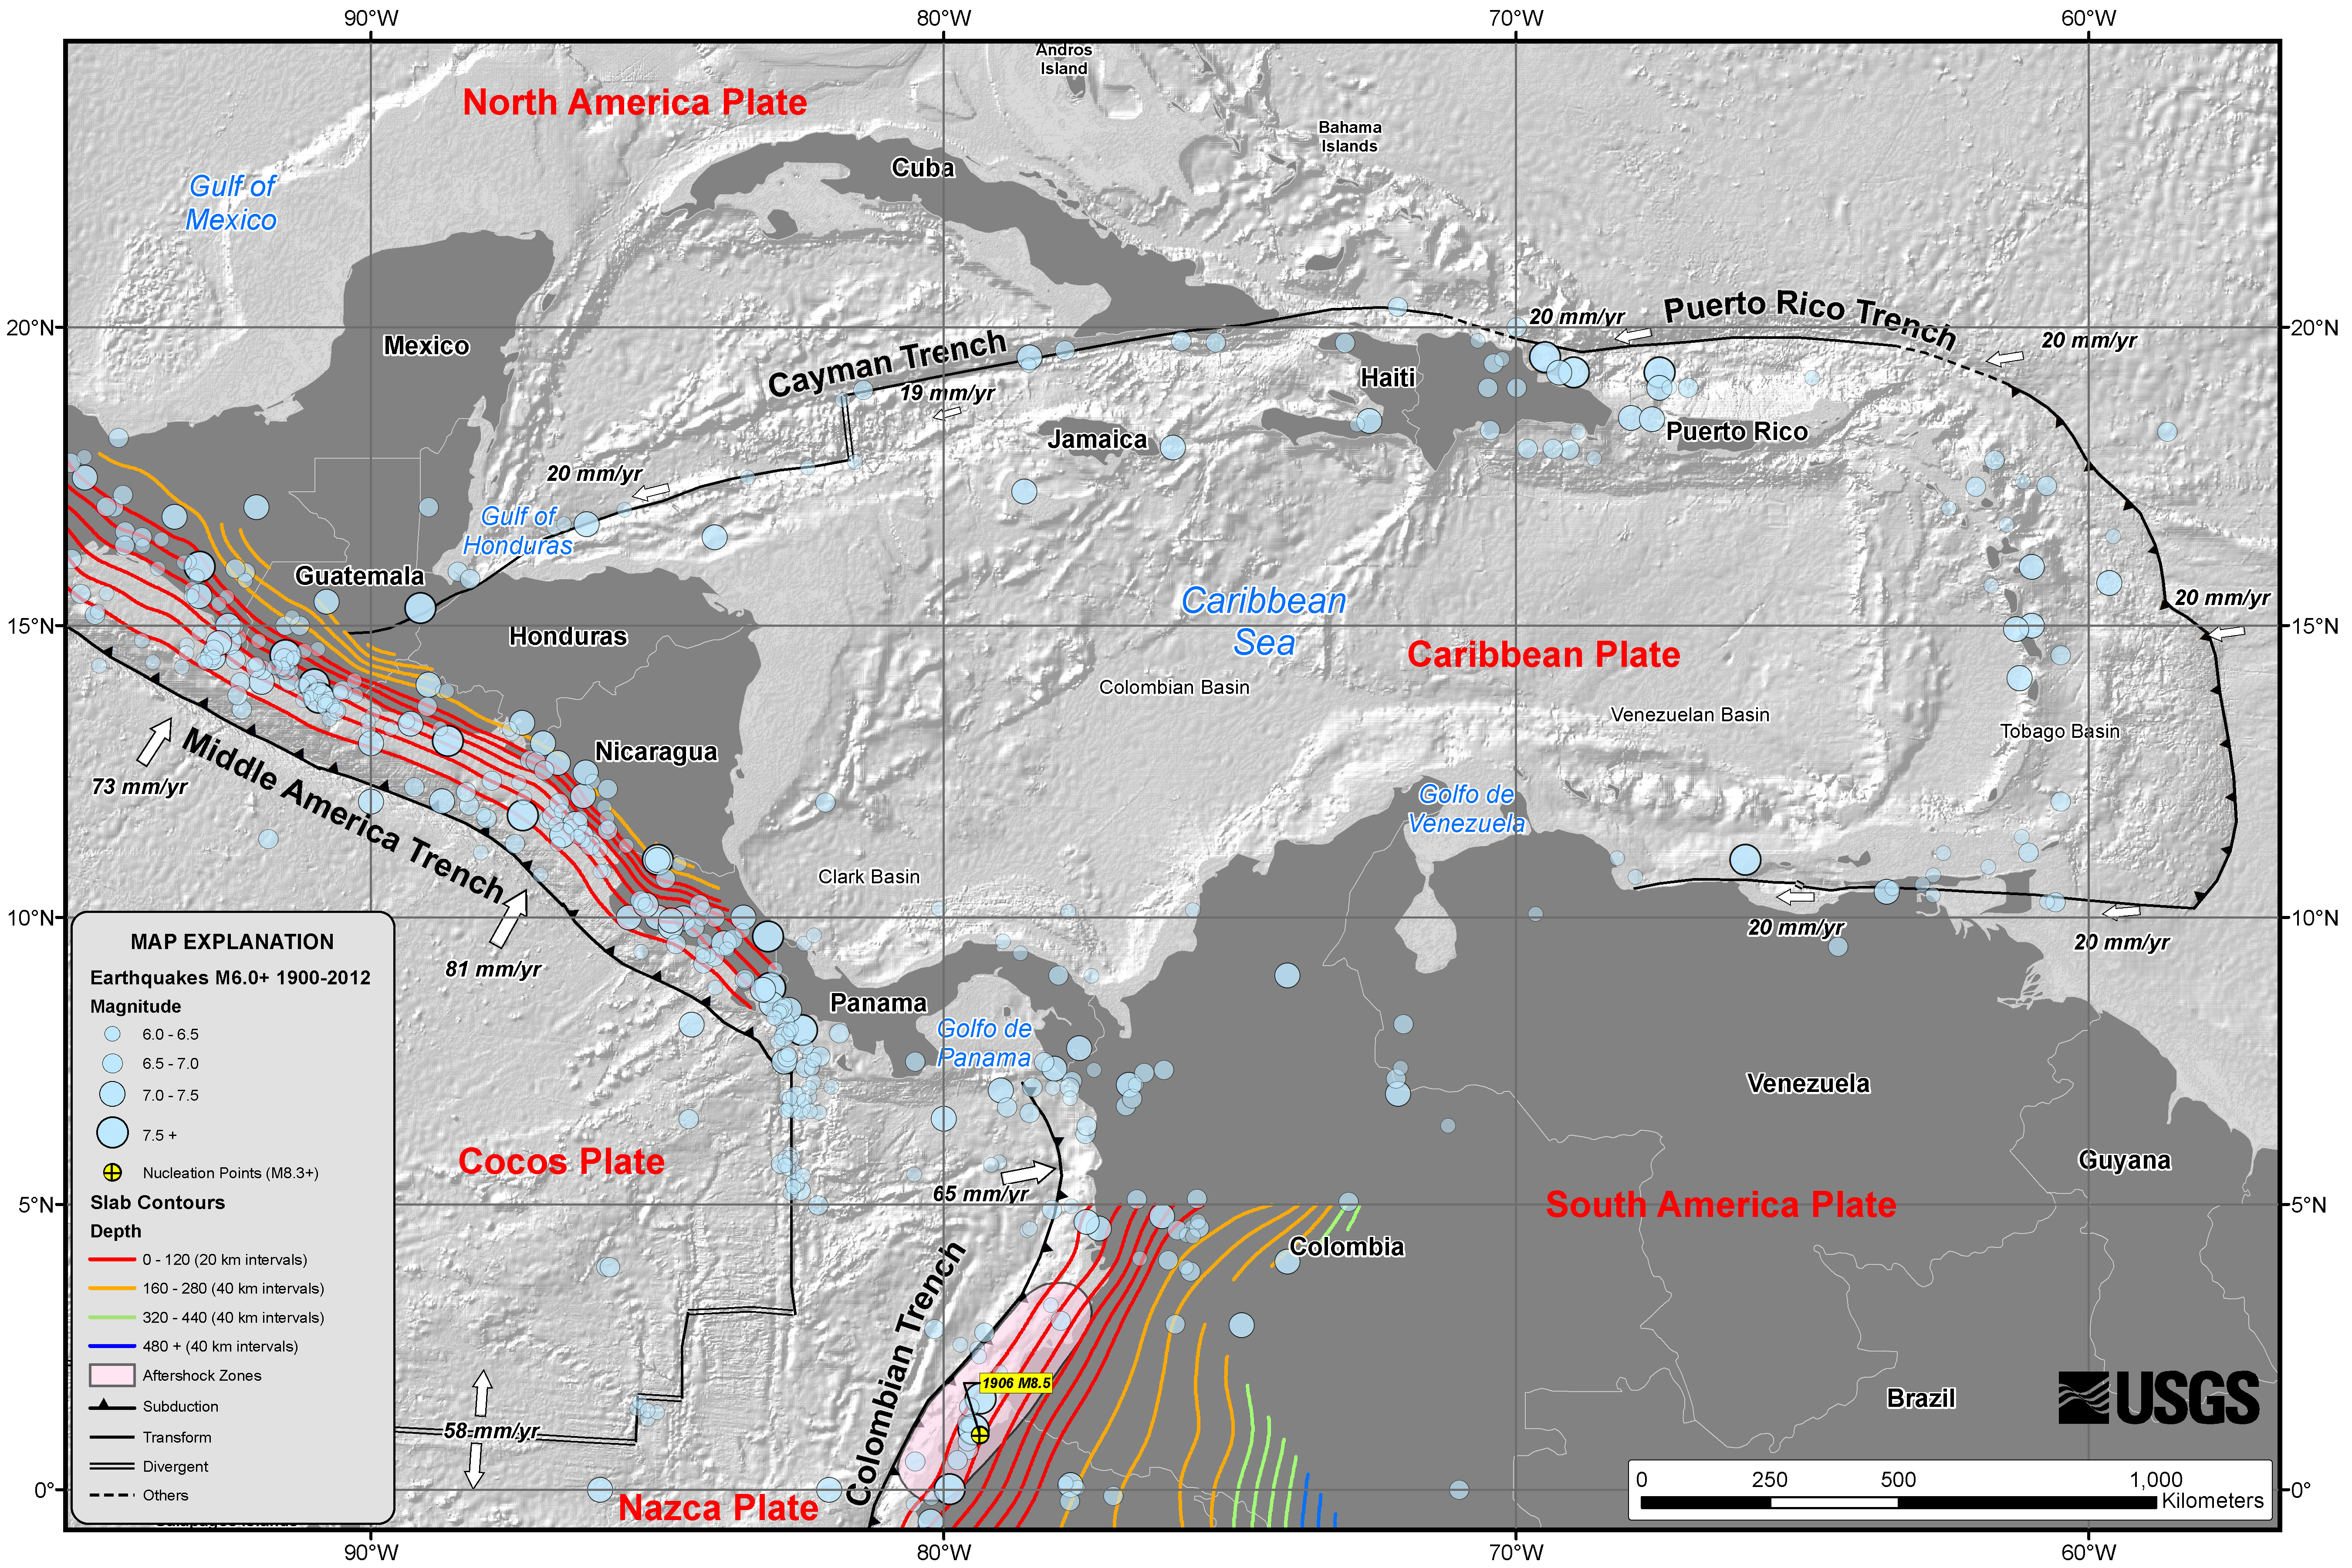
This map shows the historic earthquakes as grey circles. These earthquakes are largely associated with the subduction zone here, where the Cocos plate is subducting northeastwardly beneath the Carribean plate to form the Middle America trench.
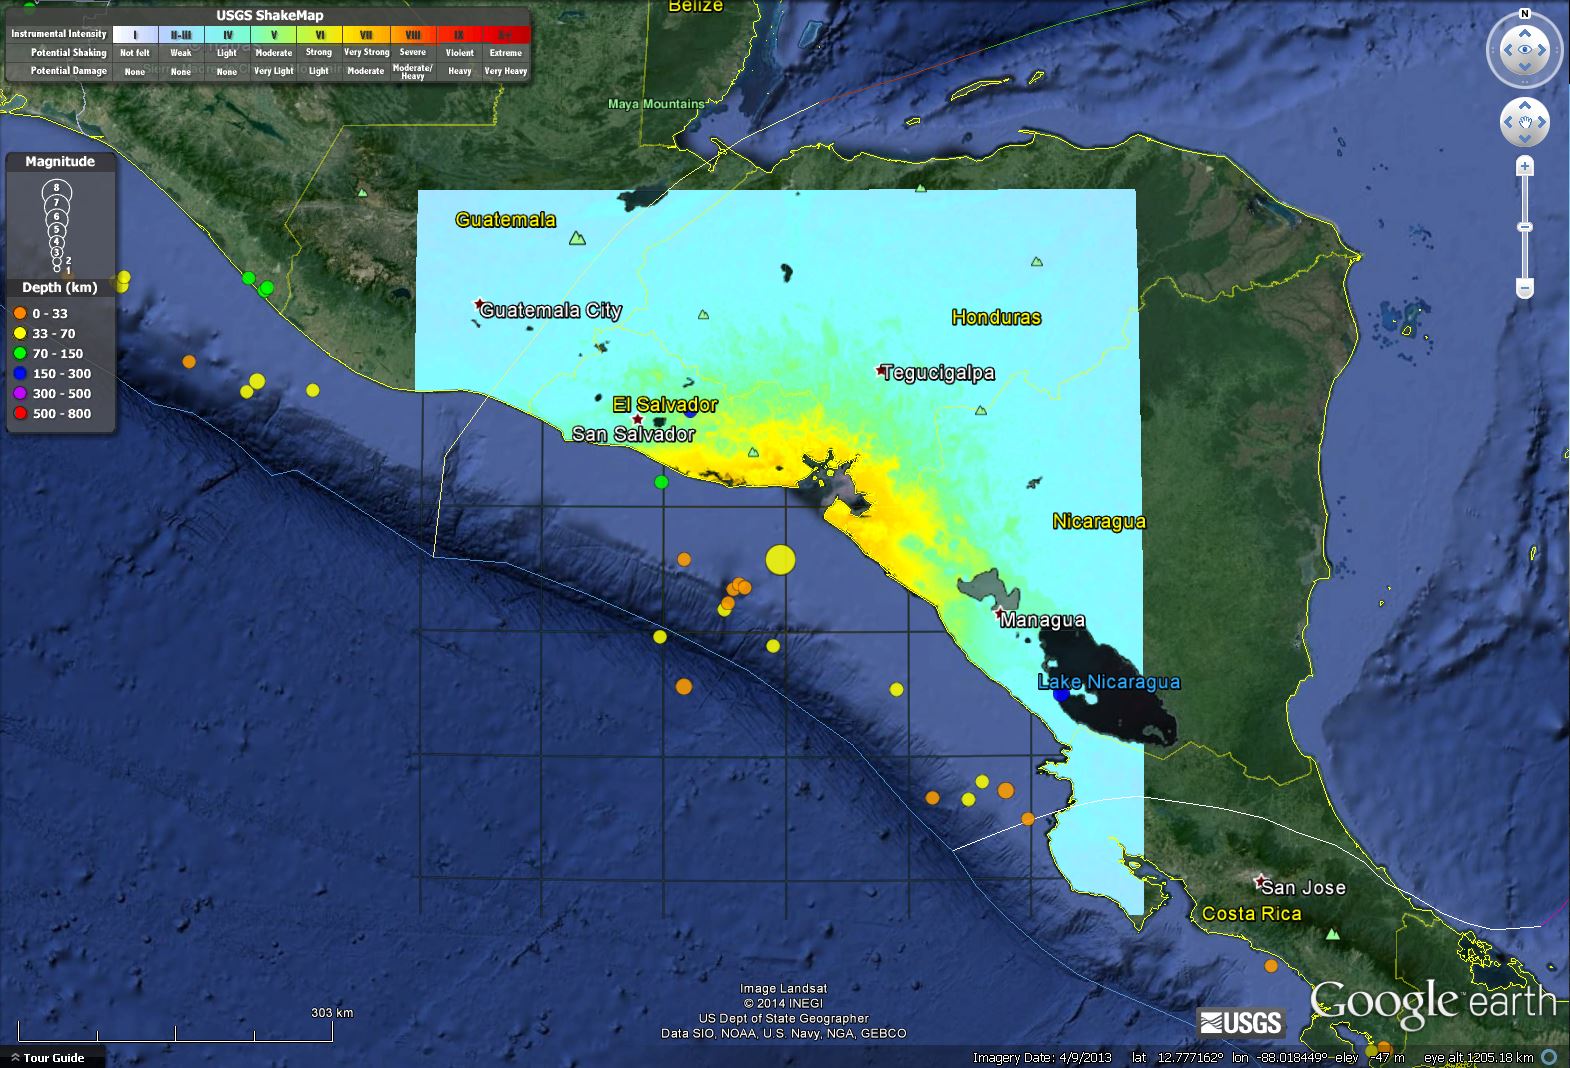
This map shows the modeled intensity using the Modified Mercali Intensity Scale (MMI, a measure of the ground shaking). The MMI has a scale of I – XII.
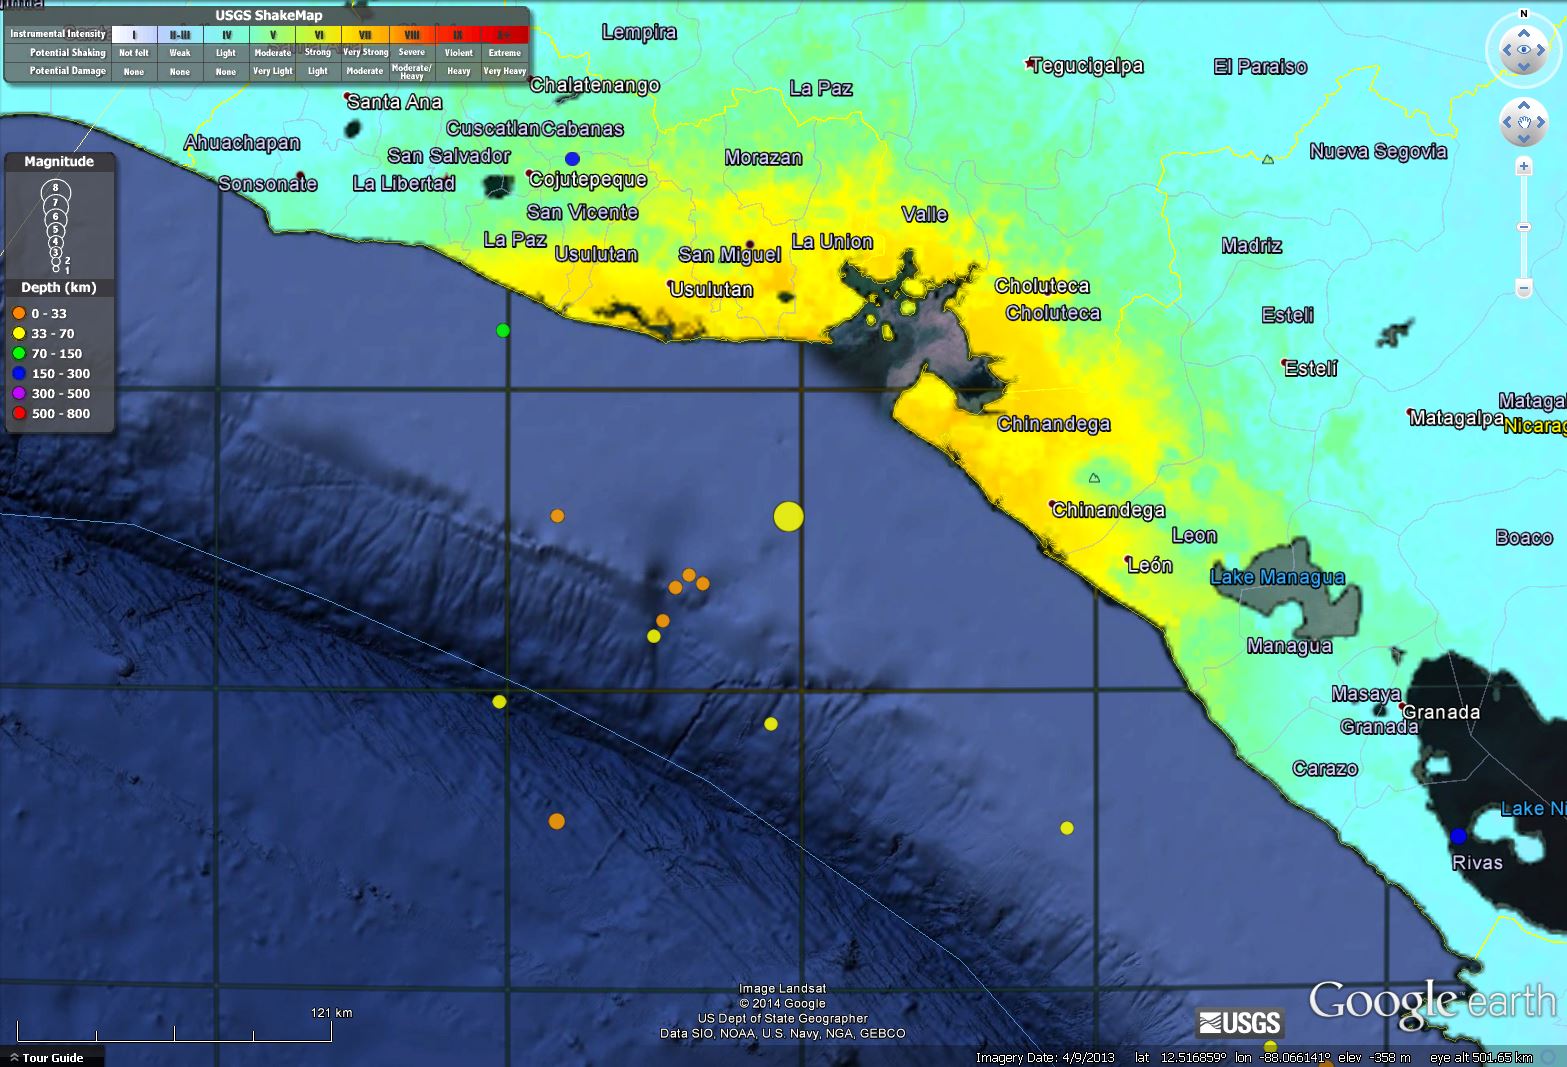
This is the same map, zoomed in for a larger scale view of the area.
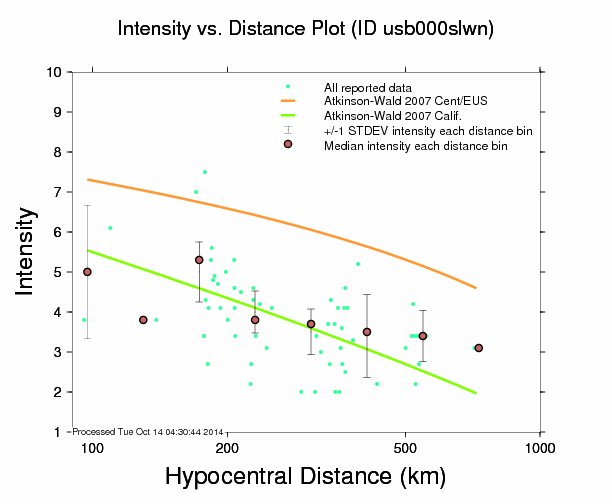
Here is a view of how the intensity attenuates (diminishes as the energy is absorbed by the earth’s crust) with distance from the earthquake. The blue dots are real data, with medians plotted as brown dots. One can see that there is considerable variation in the intensity for individual measurements. This can be due to a variety of reasons (variation in the earth’s crust, site conditions, etc.). The green and orange lines are model estimates of intensity attenuation given two models from Atkinson and Wald, 2007 (using Ground Motion Prediction Equations, GMPEs, based on regression through data from earthquakes in California and Central-Eastern US, respectively). The California regression seems to fit the data better than the Central/Eastern US model.
This map has the intensity plotted as contours, which allows one to see how the intensity varies across the region in relation to the geography and place names.

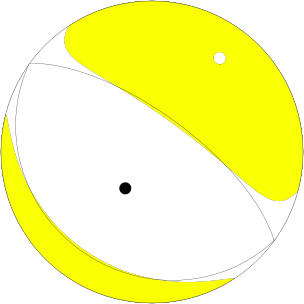
Based on the location, depth, and moment tensor shown below, I interpret this to be a normal earthquake. This earthquake is the result of extension in the downgoing plate, possibly from the bending (i.e. a bending moment normal fault).
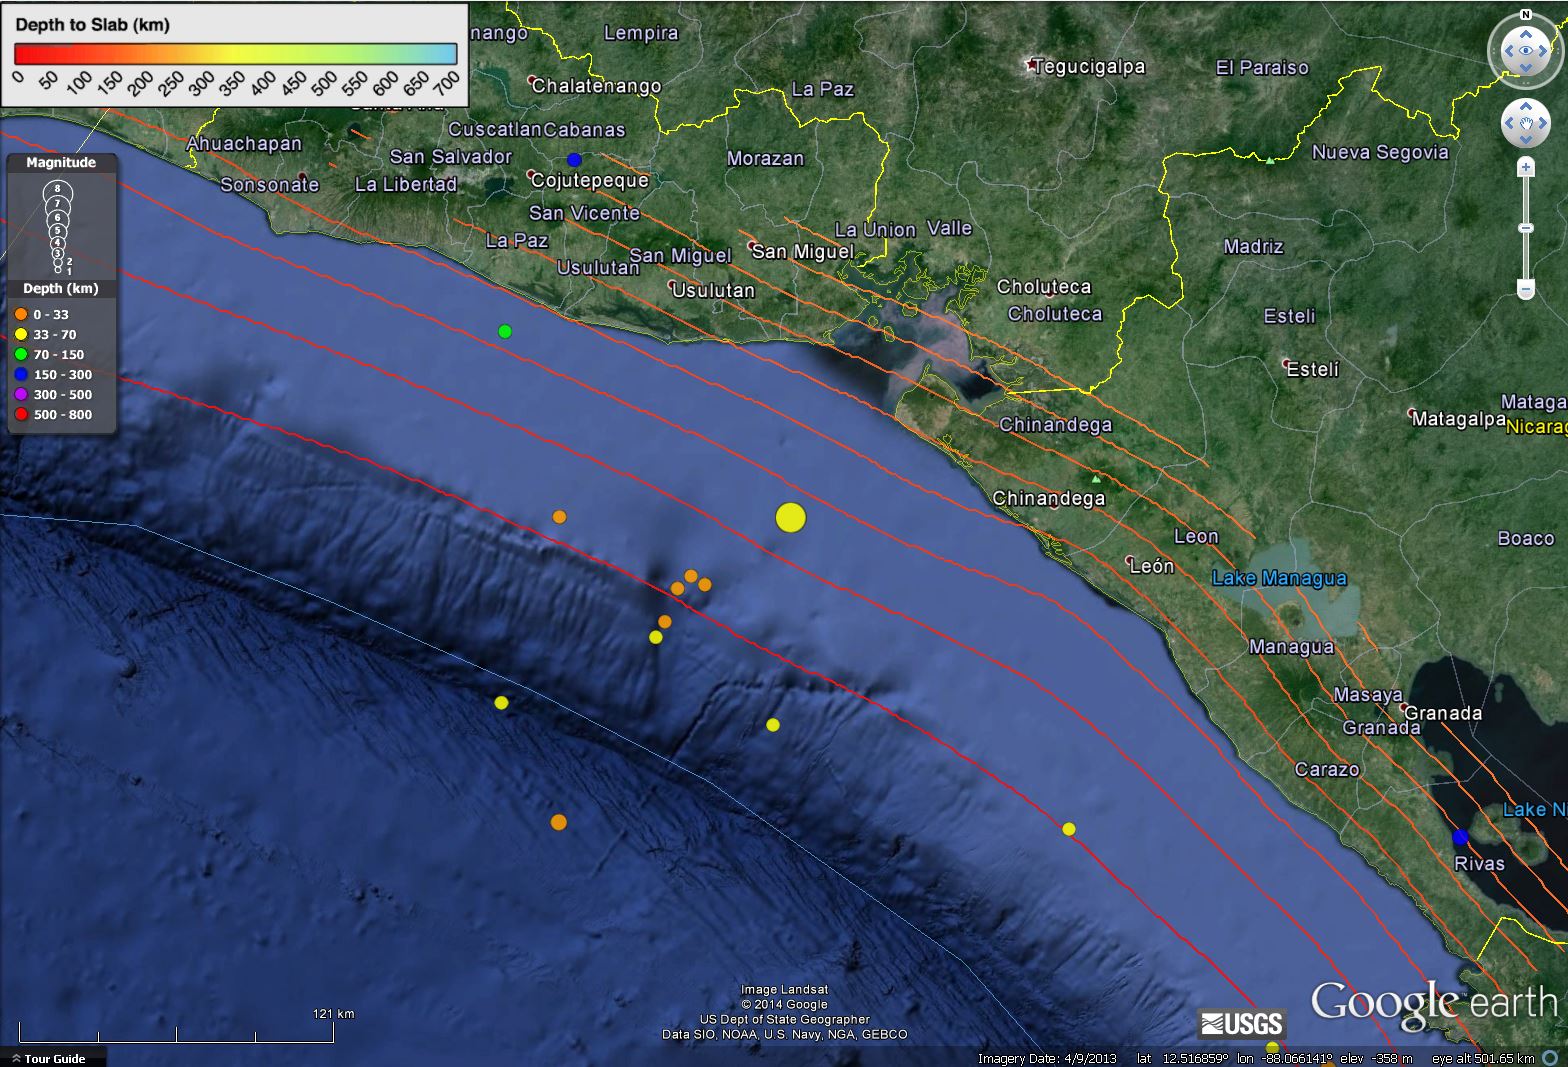
This map shows the depth contours to the slab (the top of the downgoing Cocos plate). These slab contours were developed by Gavin Hayes who works at the USGS. Here is a web page that has links to the other slabs Hayes and his colleagues have developed. They are largely based on their interpretations of historic seismicity.
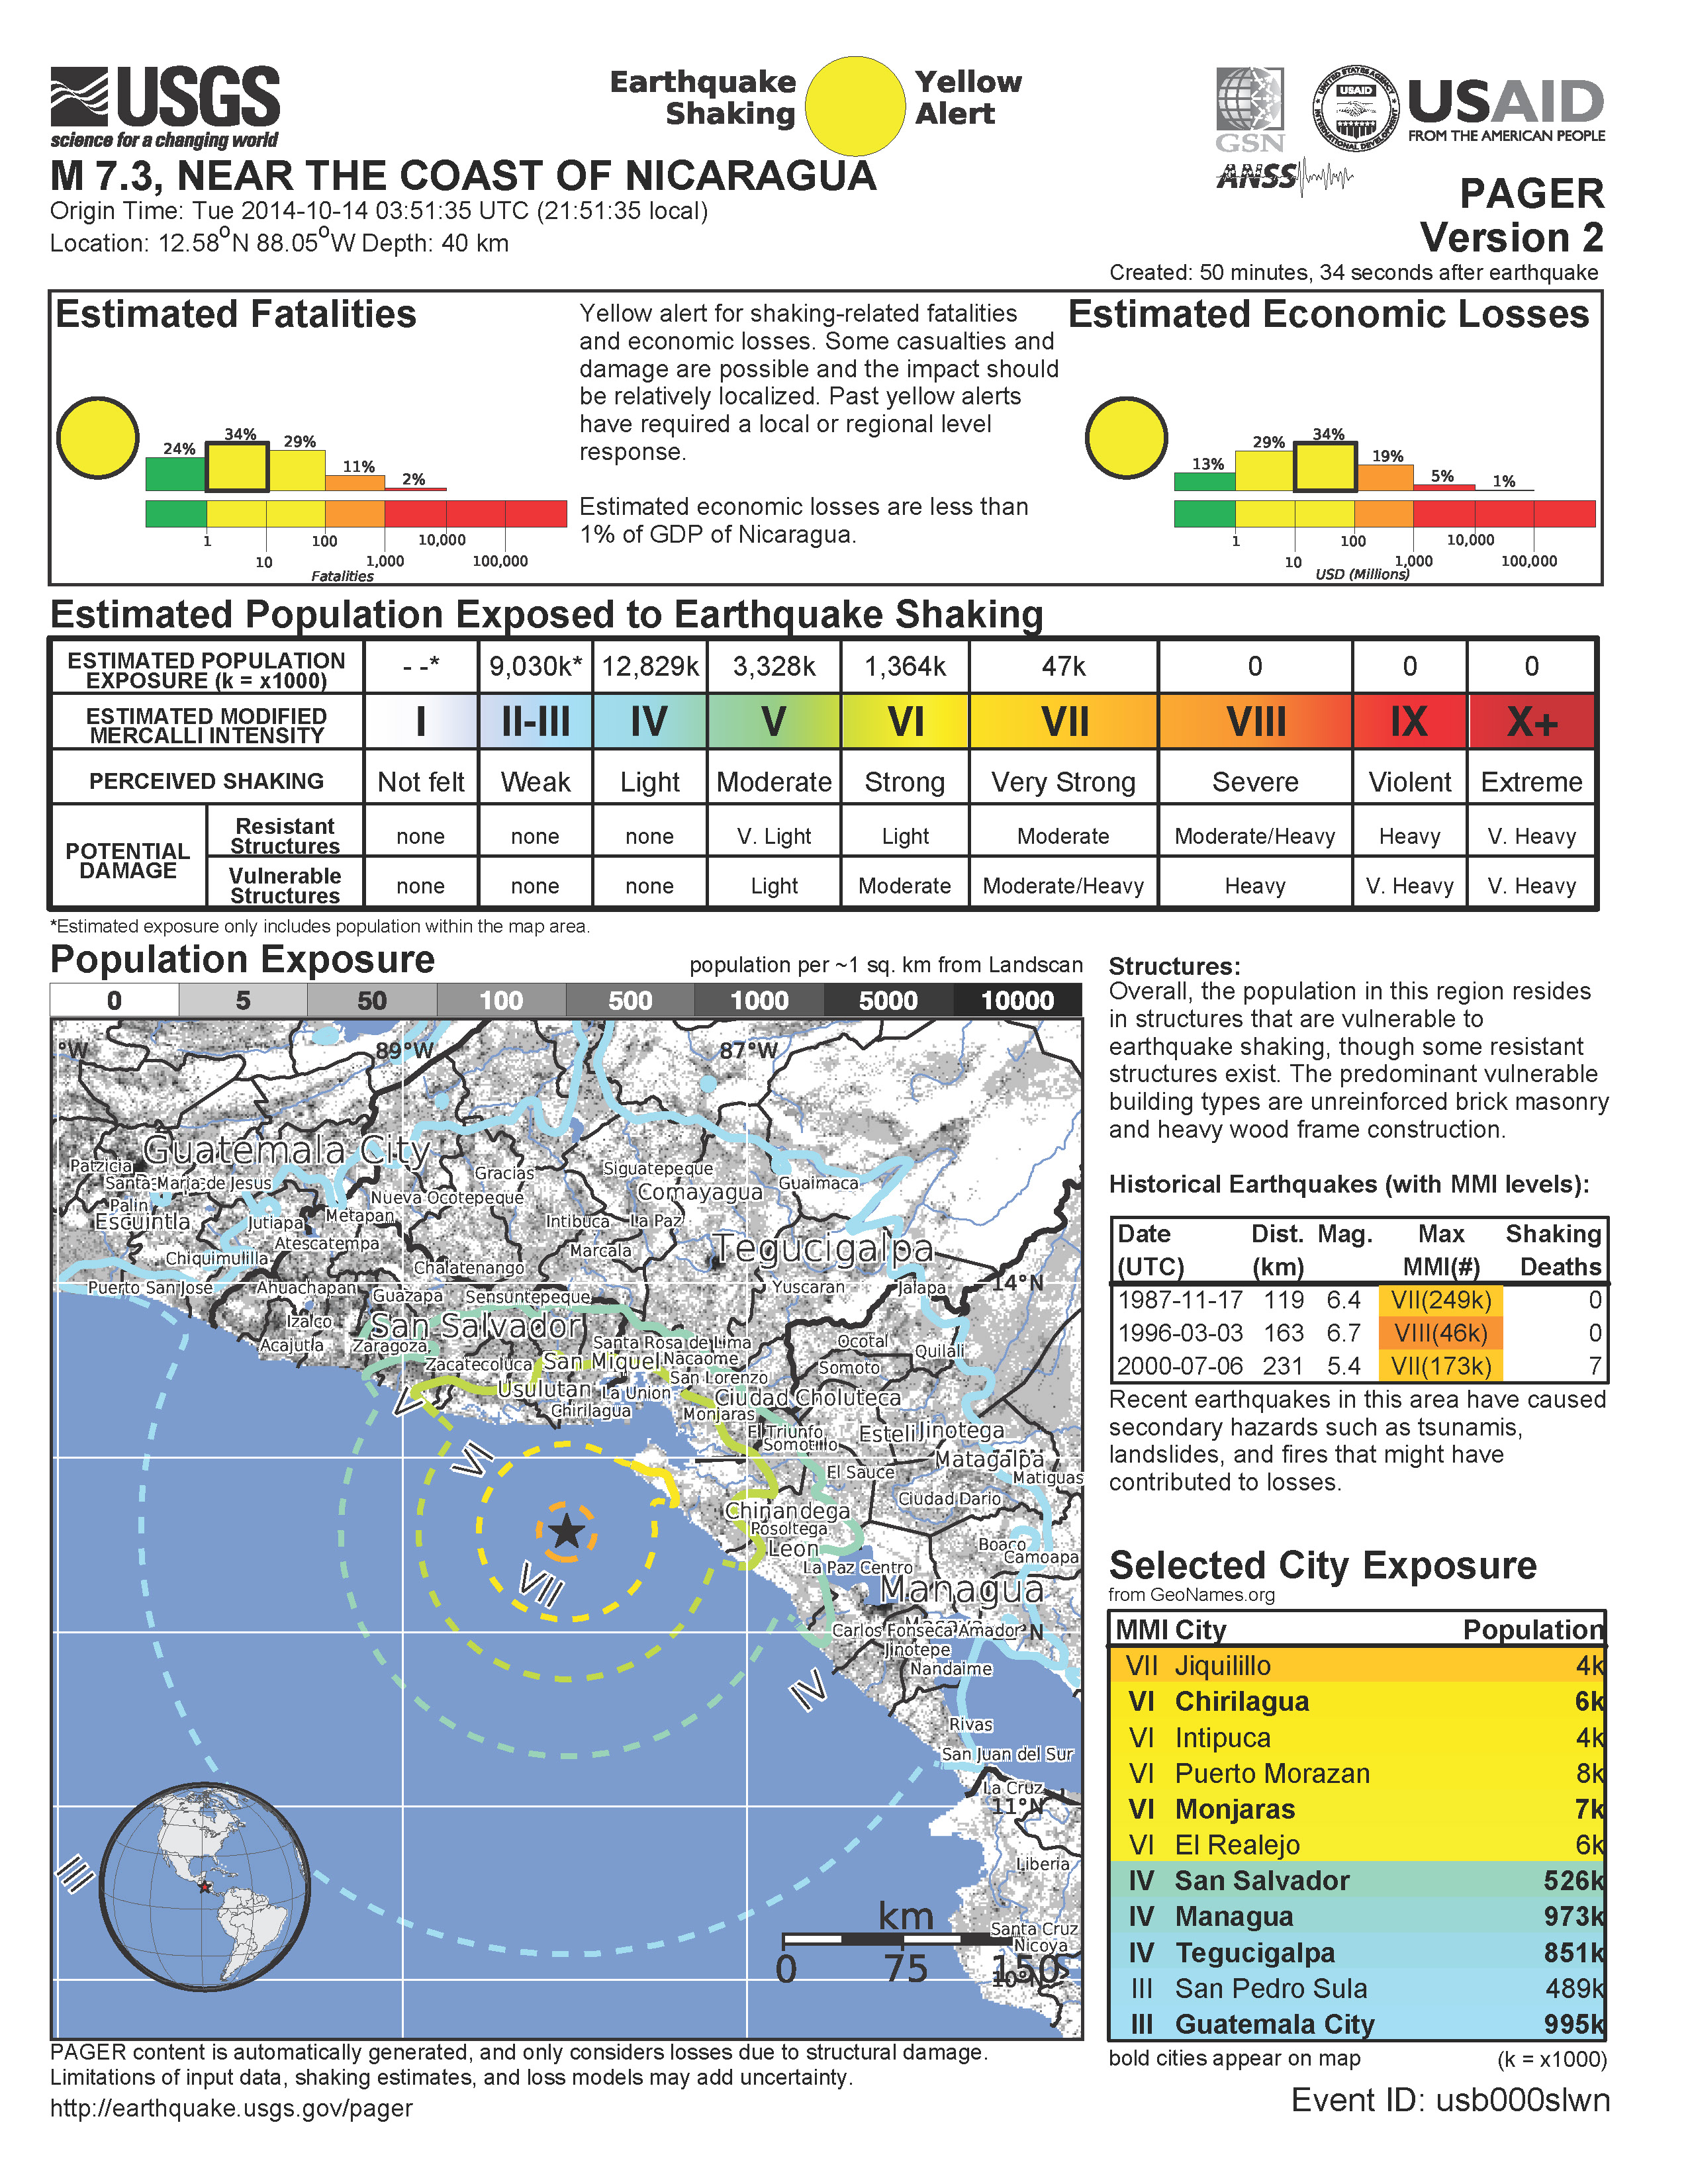
This is the pager (version 1) that shows modeled estimates of human and infrastructural damage from this earthquake. These pager estimates are revised as more seismological information is analyzed. The loss estimates assist aid agencies make plans on how much assustance they may need to send to the region (in the form of food, medical, money, etc.).
Here is the Did You Feel It map, showing observations based upon the DYFI survey tool. The results are plotted using the same color range for the MMI scale.
Here is the USGS poster for the tectonics of the region:
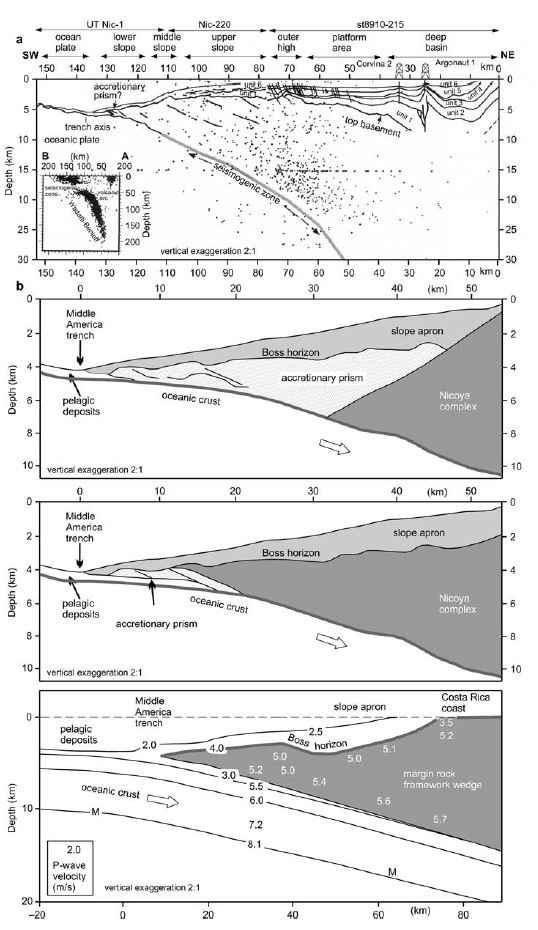
Here is a profile showing Ranero et al. (2003) interpretation of the structure of the subduction zone here. Look at the upper panel and note how the top of the slab bends downward. This causes extension that may be responsible for today’s earthquake. This is figure 8.14 from Mann et al., 2007.
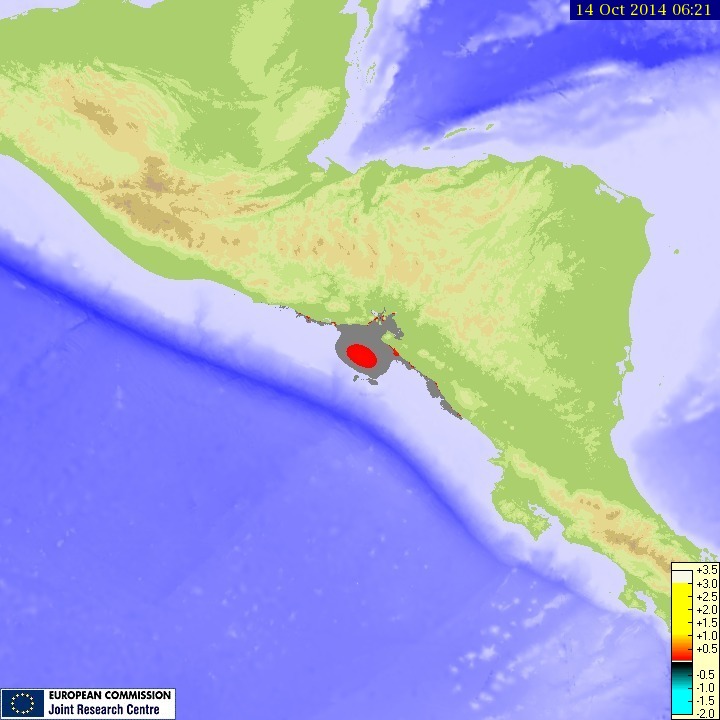
Here is a map that shows preliminary tsunami wave height estimates from Here.
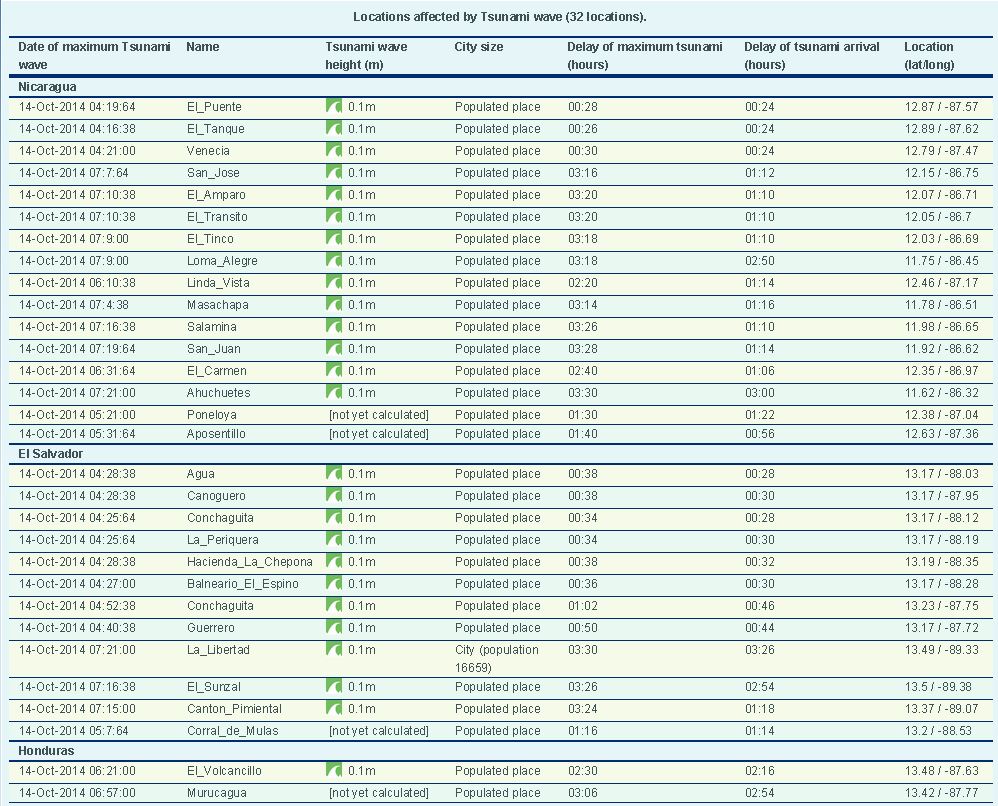
Here is a table of estimates for the tsunami wave height.
Here is a primer about Focal Mechanisms from the USGS.
References:
Hayes, G. P., D. J. Wald, and R. L. Johnson (2012), Slab1.0: A three-dimensional model of global subduction zone geometries, J. Geophys. Res., 117, B01302, doi:10.1029/2011JB008524.
Mann, Paul, Robert D. Rogers, and Lisa Gahagan. “Overview of plate tectonic history and its unresolved tectonic problems.” Central America: Geology, resources and hazards 1 (2007): 201-237.
Ranero, C., Morgan, P., McIntosh, K. & Reichert, C.: Bending-related faulting and mantle serpentinization at the Middle America trench. Nature 425 (2003), pp.367–373.
Can you help me? I’m looking for historic tsunami data off the eastern coast of Japan (Tohoku). It’s actually for a workshop I’m teaching in basic disaster preparedness and I’d like to use the data to illustrate how extraordinary the March 2011 event was. Basically all I need is an average height of tsunami waves for some period/number of events prior to the March 2011 event to use as a comparison. Thank you so much for your help! (NB: Being something of a contemporary Luddite, I do not use Twitter or FB)
Well… the run ups in 2011 were quite high, but only compared to our very very short historical record. there were some run-ups in sumatra that had similar heights.
These subduction zone earthquakes can have return periods (recurrence intervals) that span centuries to millenia. There was an earthquake in the region that ruptured in 2011 that previously ruptured in 869 AD. Based on the tsunami deposits, the Jogan Tsunami was much larger than the 2011 Tohoku-Oki tsunami. Here is a report that shows a comparison of these tsunami deposits. http://www.eqclearinghouse.org/2011-03-11-sendai/files/2011/09/RWilson-Japan-tsunami-blog.pdf
Here are some scans from a paper that discusses the return period of earthquakes correlated with tsunami run up height. I have not reviewed these data. http://tornado.sfsu.edu/geosciences/classes/metr485/ccm_assignments/chile/chile.htm
This page has a better plot, but i cannot tell where it came from. http://itrinc.ca/example-projects/
This paper has some comparisons. https://www.researchgate.net/publication/259172065_Recent_tsunamis_events_and_preparedness_Development_of_tsunami_awareness_in_Indonesia_Chile_and_Japan/figures?lo=1
Check out figure 2 here. https://www.researchgate.net/publication/259172065_Recent_tsunamis_events_and_preparedness_Development_of_tsunami_awareness_in_Indonesia_Chile_and_Japan/figures?lo=1
Here is a plot for sumatra. http://soundwaves.usgs.gov/2005/03/
More on sumatra. https://walrus.wr.usgs.gov/tsunami/sumatra05/heights.html
Here are some observations from Chile. https://www.researchgate.net/publication/235677521_Observations_and_Modeling_of_the_27_February_2010_Tsunami_in_Chile
I hope this was helpful.