We just got another large earthquake in this region, of magnitude 7.8. There were some changes in magnitudes and epicentral locations early on. It is still early and may change more. Earlier there was a M6.8 earthquake nearby, along with a couple ~M5. These earthquakes are probably occurring on a transform fault system that is connected on the east to the oceanic Scotia subduction zone.
This USGS fault data set is at a global scale and so may not account for the latest structural relations on a local scale. The magnetic anomaly data for the plates in this region are pretty well mapped in some places, but the complexities arise near this earthquake series, south of the east-west transform fault. I have also plotted the historic seismicity with IRIS’ earthquake viewer. Their plate boundary faults are better located than the USGS fault locations, in places.
The moment tensor (an indicator of the type of earthquake and sense of motion during the earthquake) shows a similar sense of motion on this fault as the M6.8 recorded earlier. Based on the mapped plate boundary faults in this area, I interpret this to be a left-lateral strike-slip earthquake, with slightly oblique motion suggesting transtension. The bathymetry also may slightly support a n-s fault with right lateral motion. The transform fault here is stepping left, so left-lateral slip would generate transtension (extension). It is equivocal without a better fault map or high resolution bathymetry. There is a fault-parallel basin that may be related to a possible left step over. There are a couple lines of higher resolution bathymetry about 50-75 km due west of the epicenter that does show some ~”n20e” structures (see figure below). 
Here is the USGS page.
Here is a map of the area. The epicenter is marked by a red star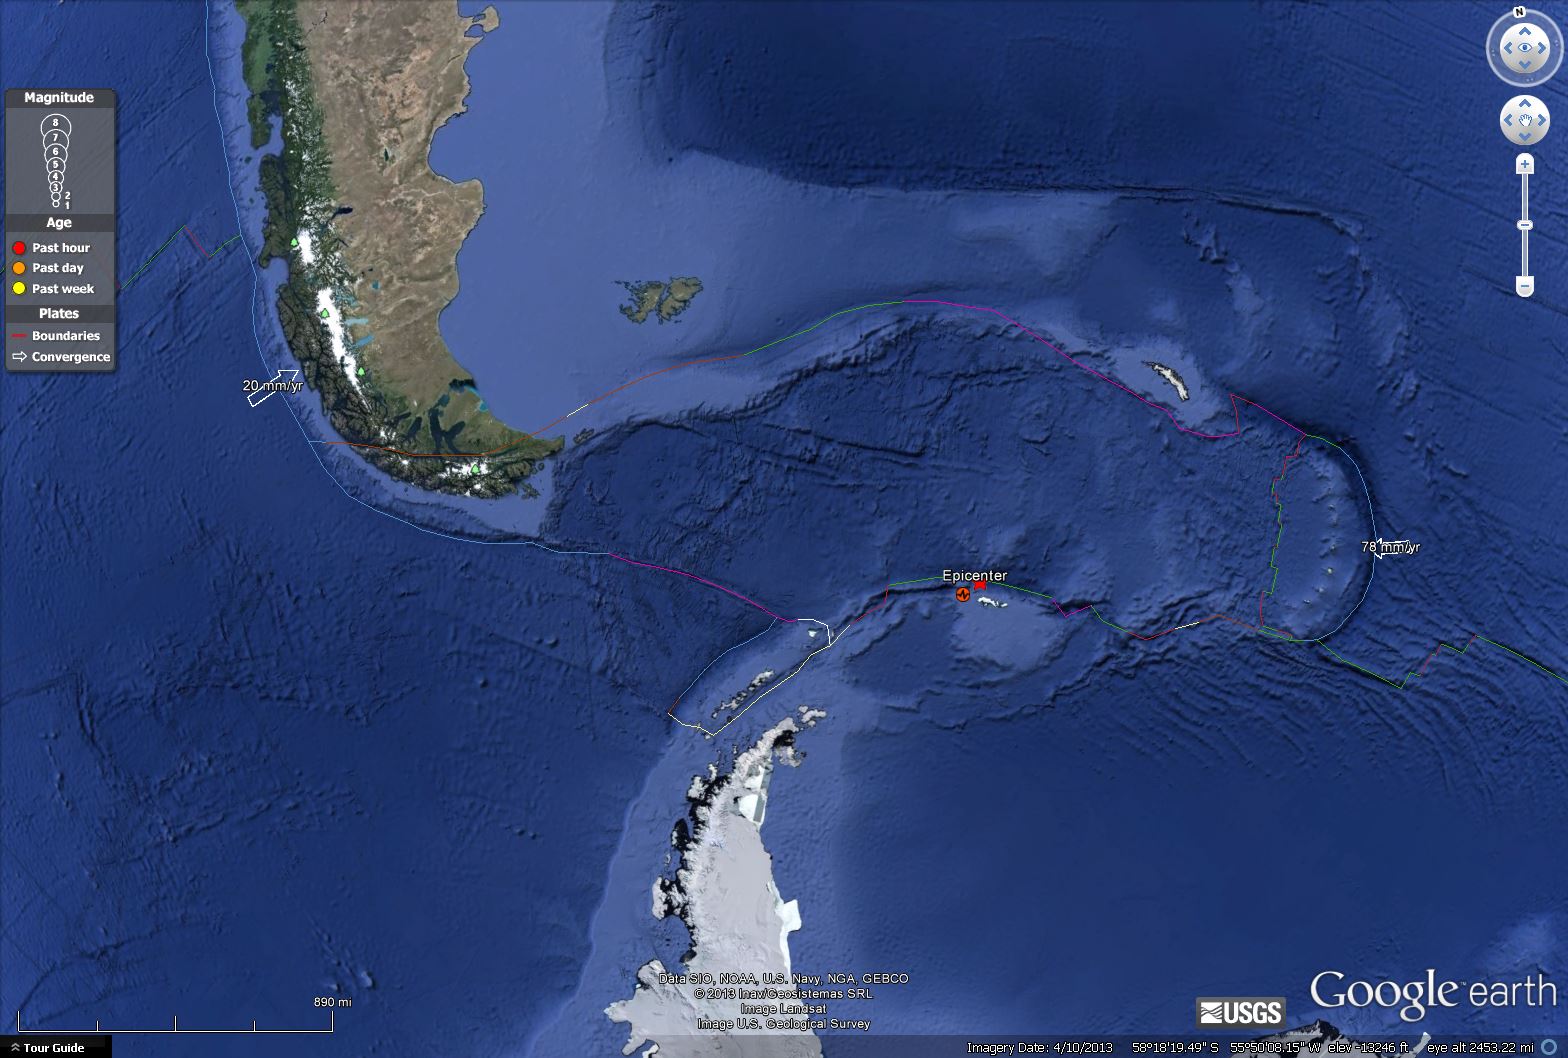
Here is the same map with historic earthquakes plotted. 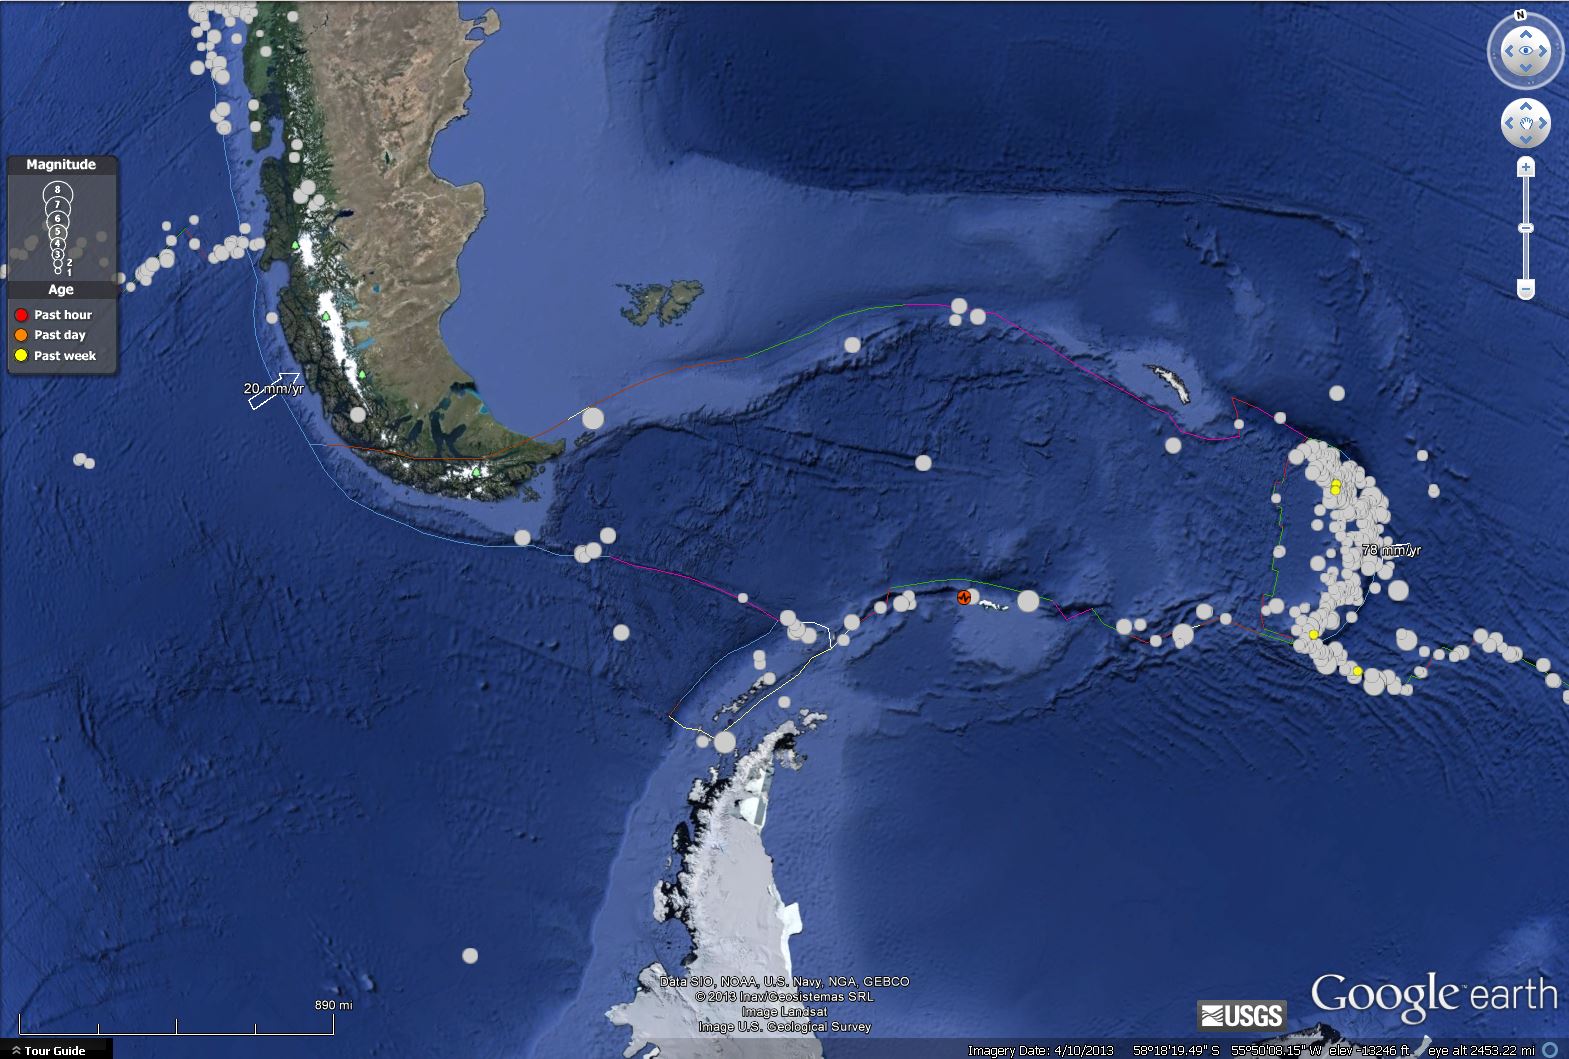
Here is the IRIS map with historic earthquakes plotted. IRIS puts together learning moment educational products for many larger earthquakes. Here is the IRIS earthquake browser. 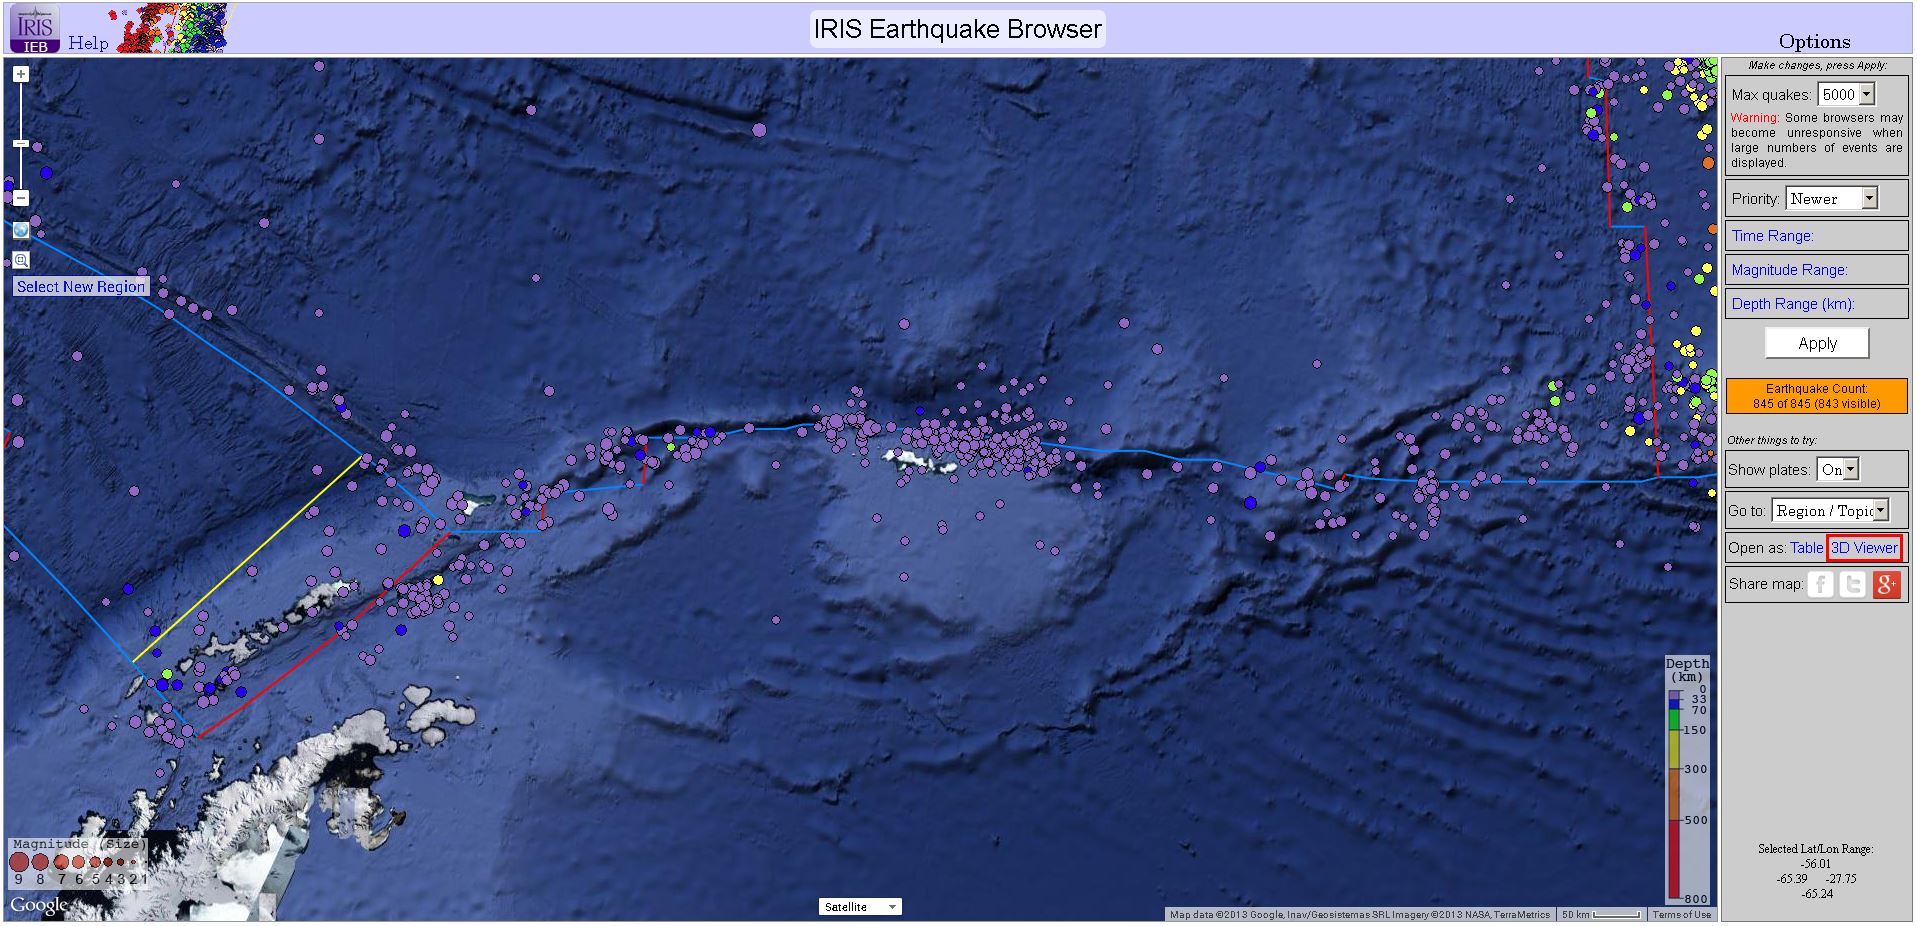
Here is a map scaled to the USGS Modified Mercalli intensity map. 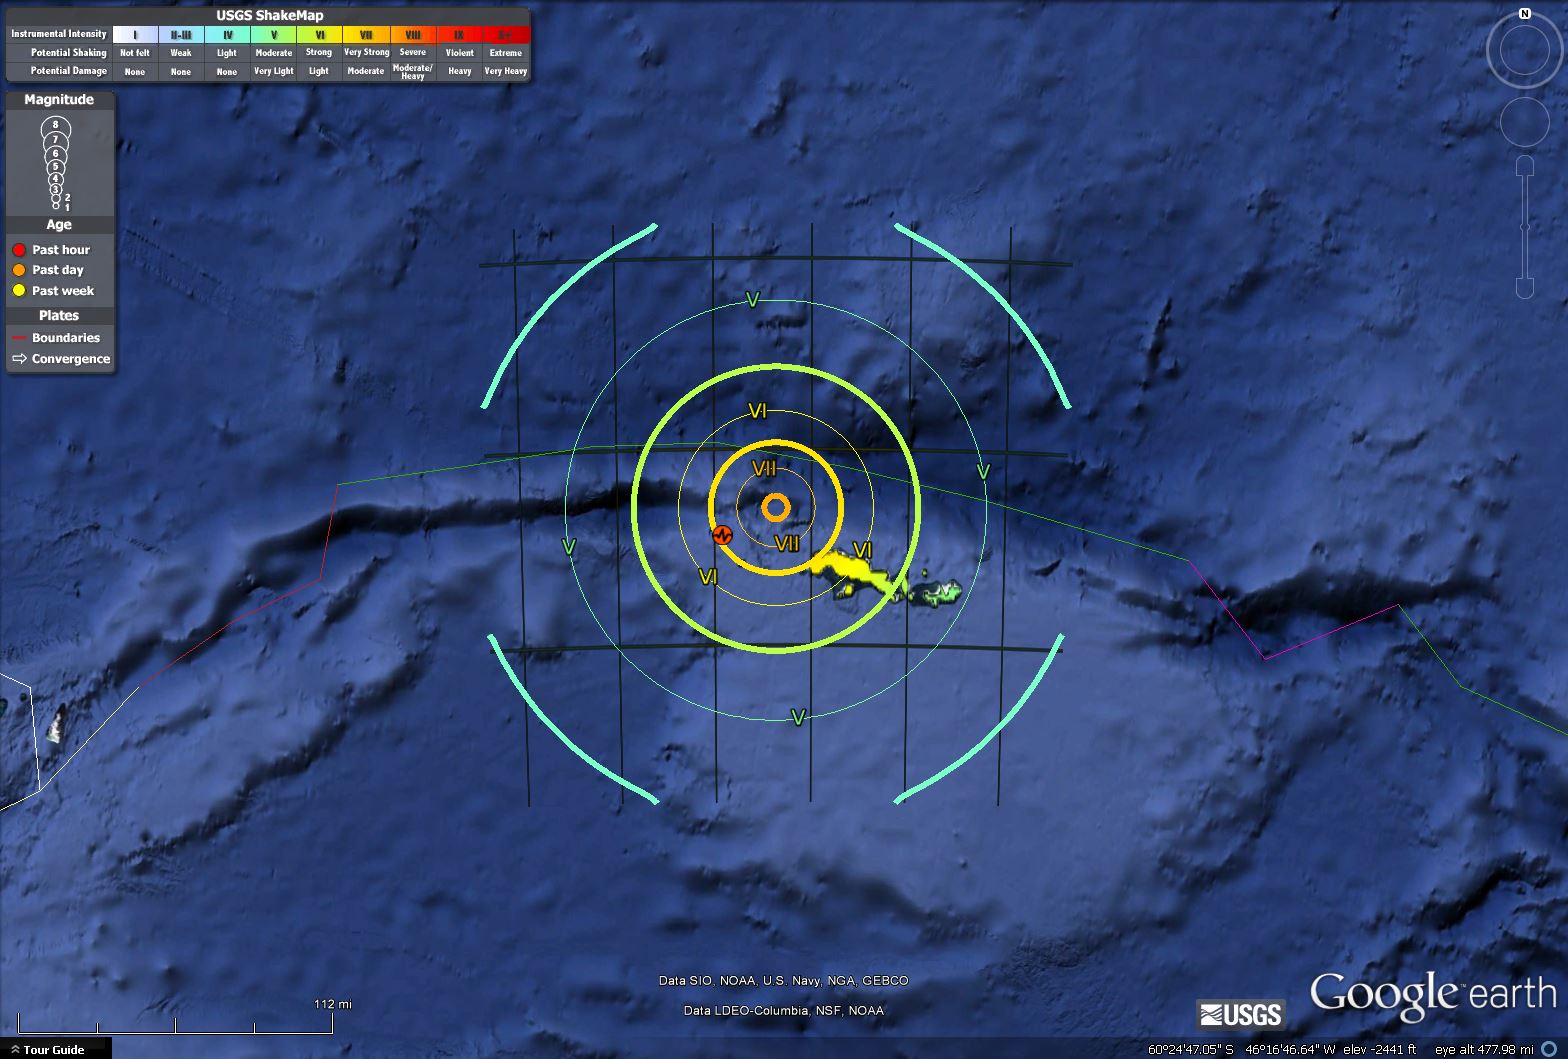
Here is the USGS pager page, which helps us to rapidly evaluate potential infrastructure damages. 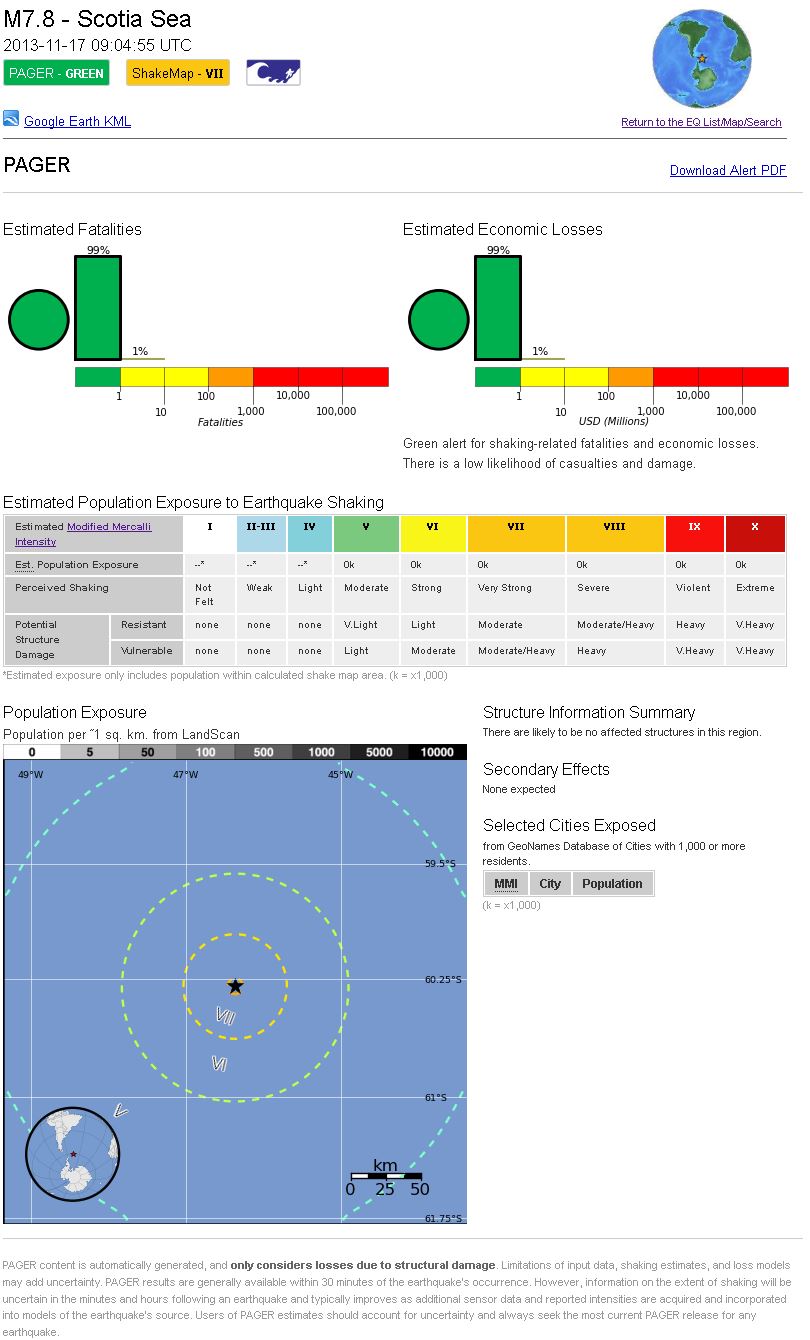
Here is a tide gage record from Paul Whitmore at the NOAA/NWS National Tsunami Warning Center. The tide gage is located on South Georgia Island. 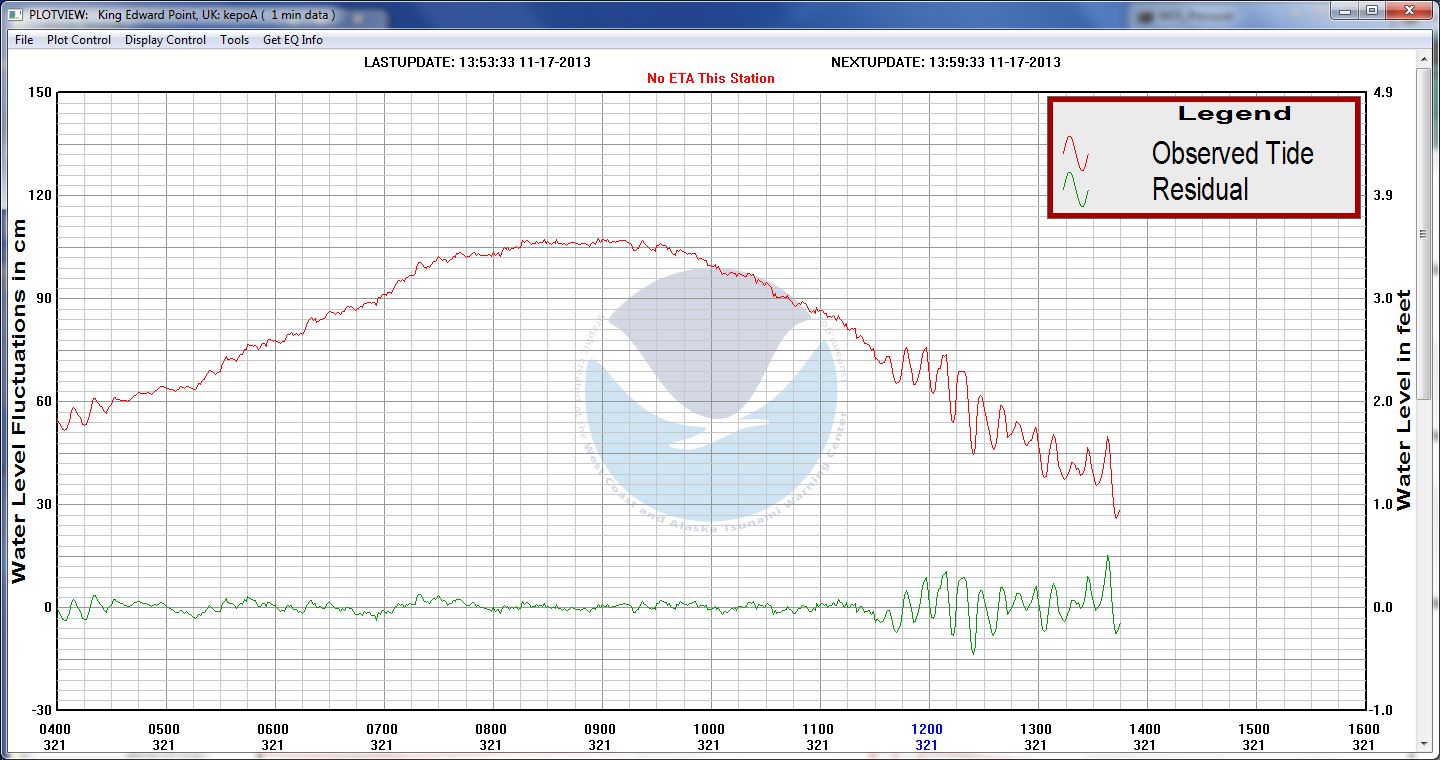
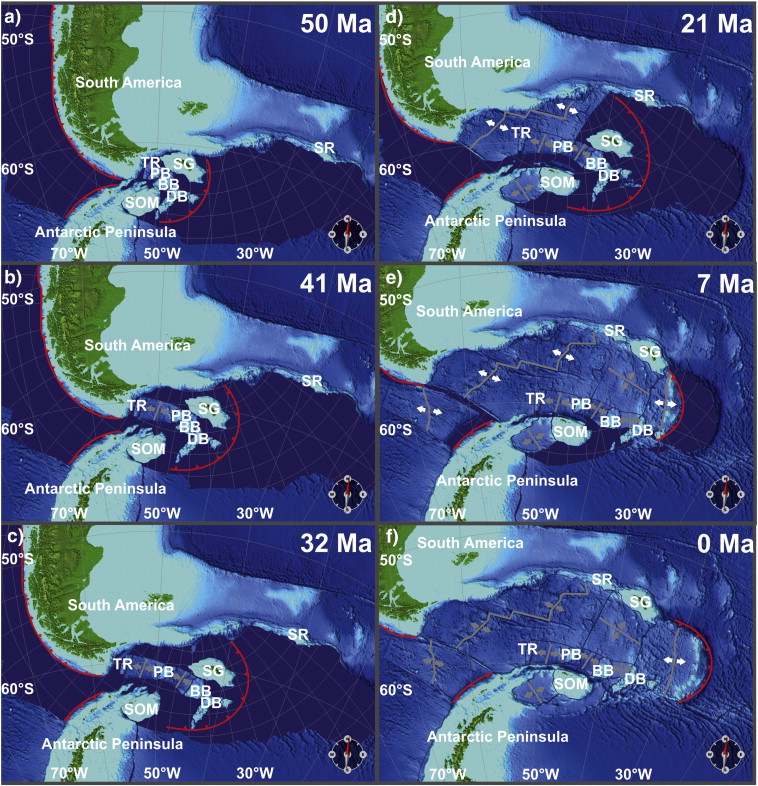
Here is a figure from Lindeque et al., 2013 showing one tectonic model of this region (Marine Geology, V. 336, p 61-63). Their paper investigates the Cretaceous to Quaternary sedimentation history of the Weddel and Scotia seas. They use seismic stratigraphic profiles and sediment cores to evaluate the sources and timing of sedimentation. They interpret these sediments in terms of oceanographic circulation patterns that changed following the tectonic evolution of this margin. In the Cretaceous, the deep water gateway was closed and the subduction zone along southern Chile probably connected with the subduction zone off the Antarctic Peninsula. Here is a link to their paper. 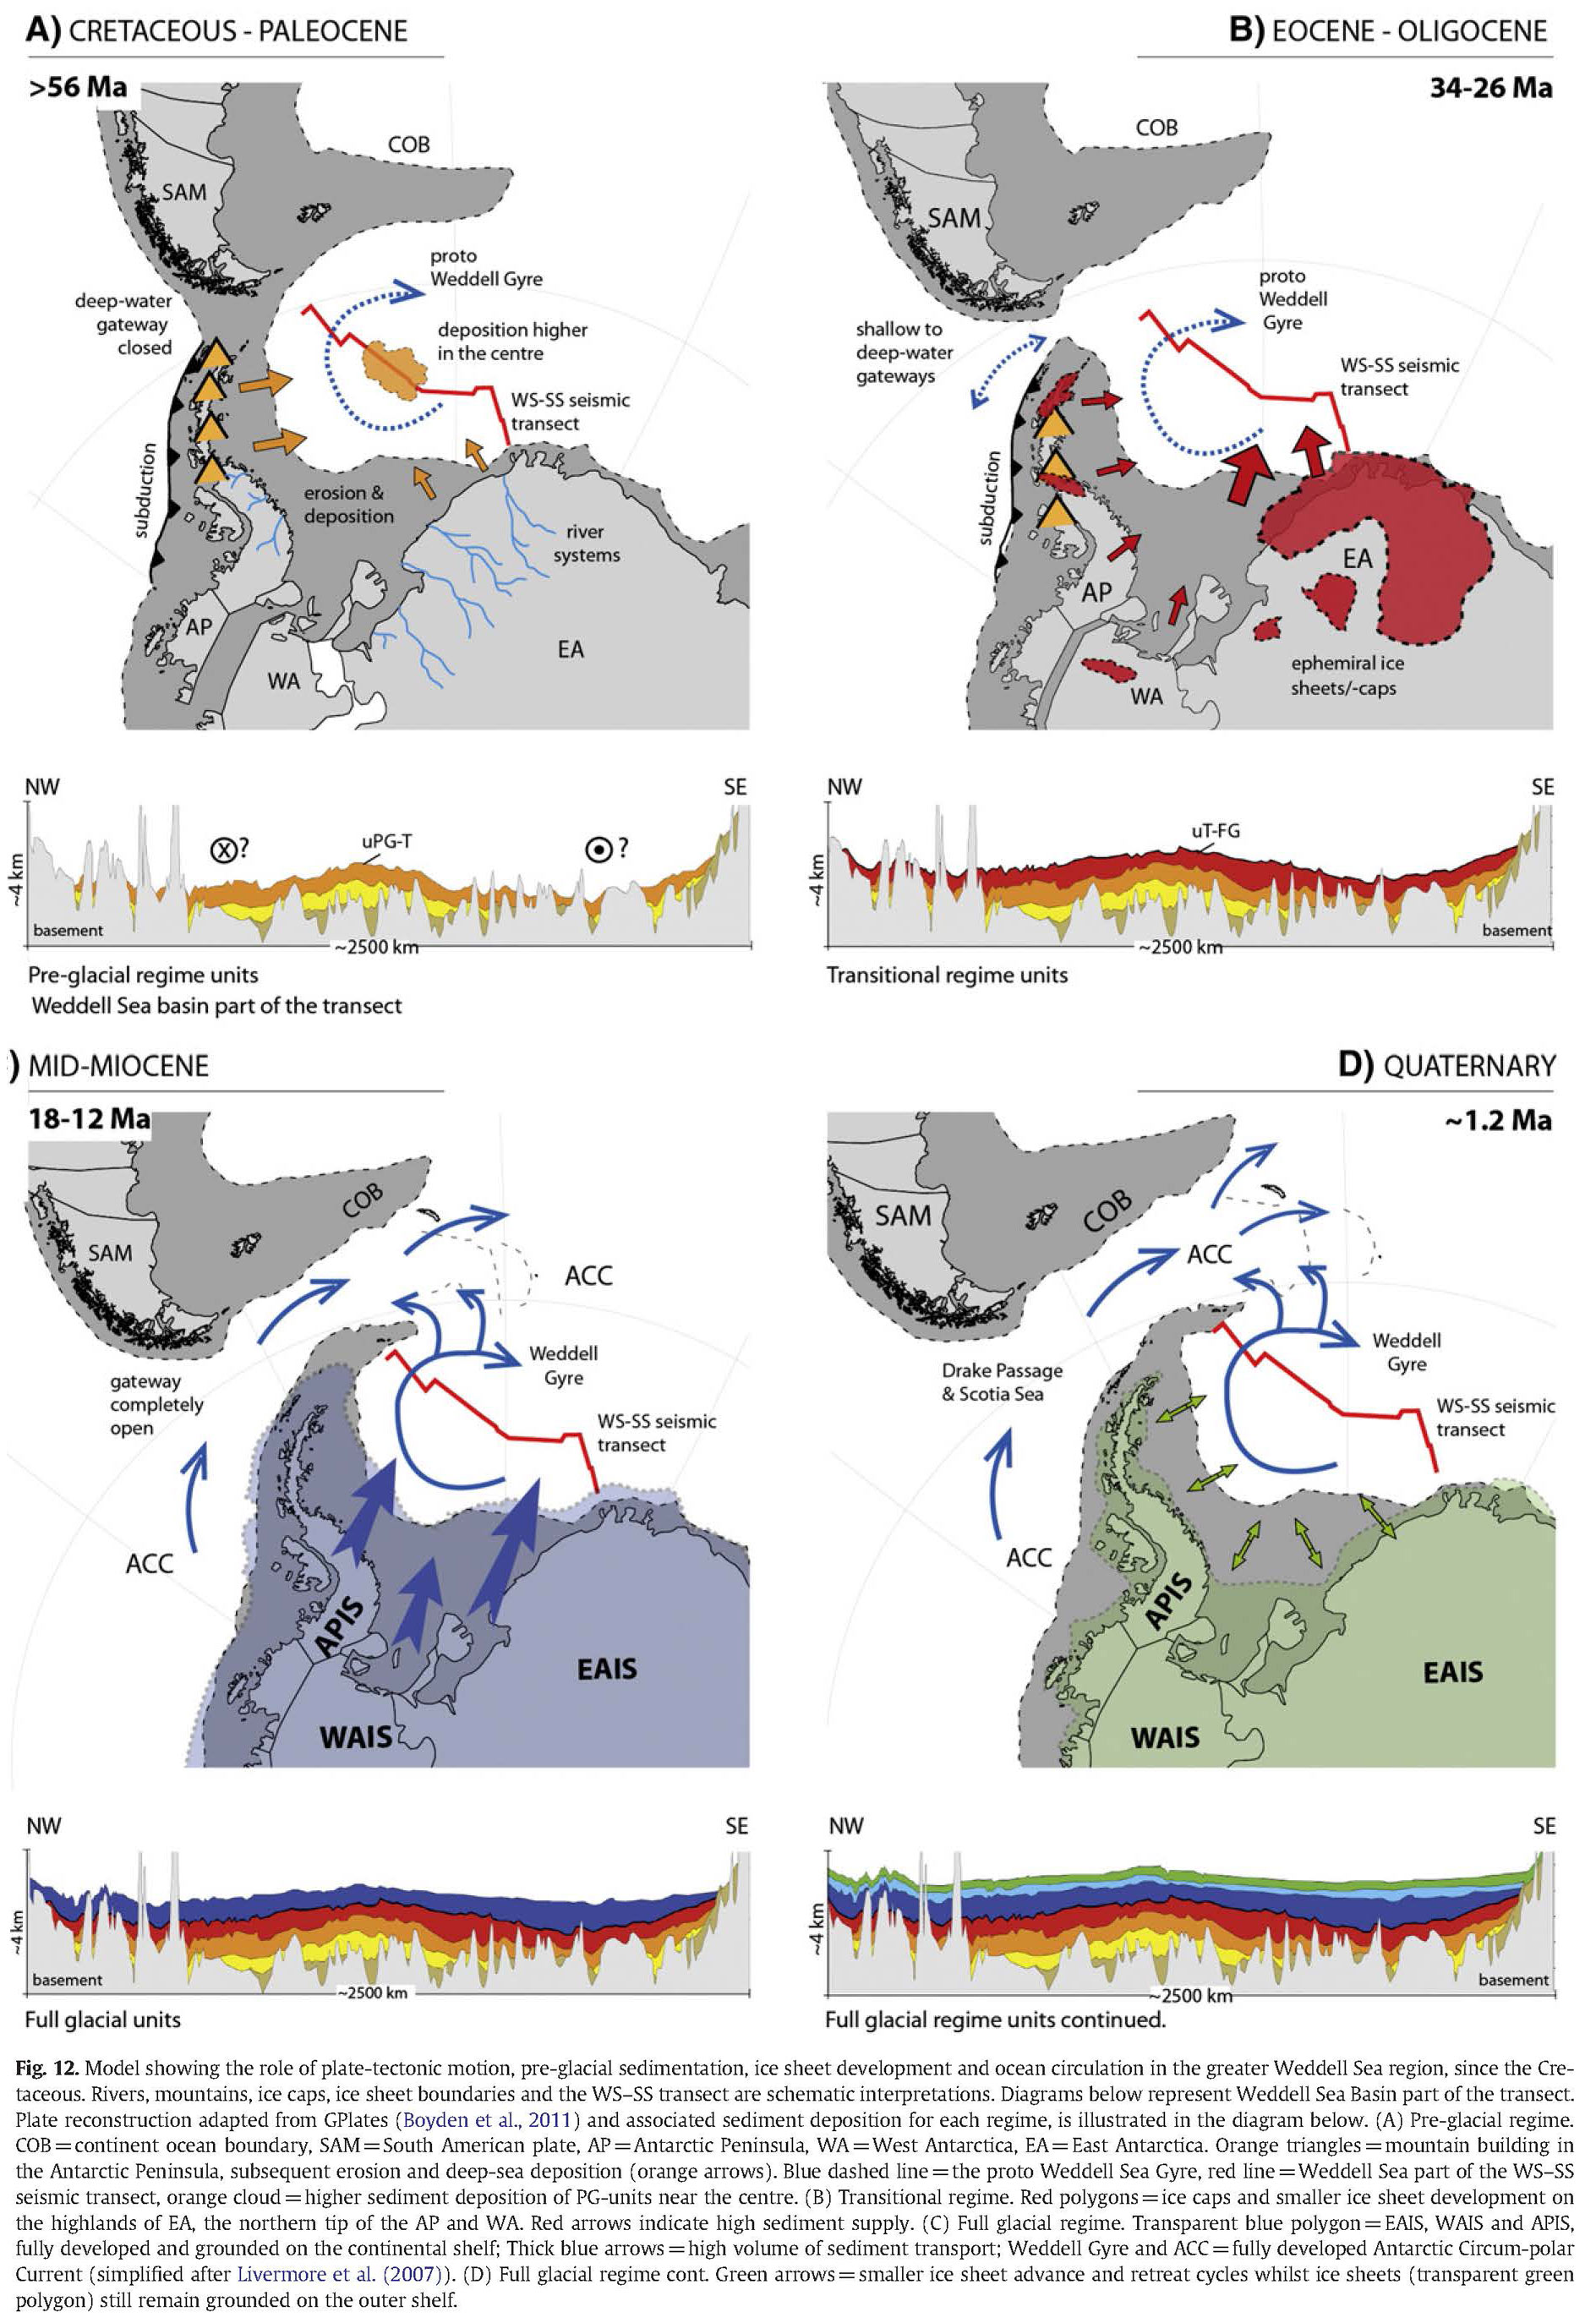
Here is a map of the region from wiki commons http://commons.wikimedia.org/wiki/File:Scotia-sea.png. 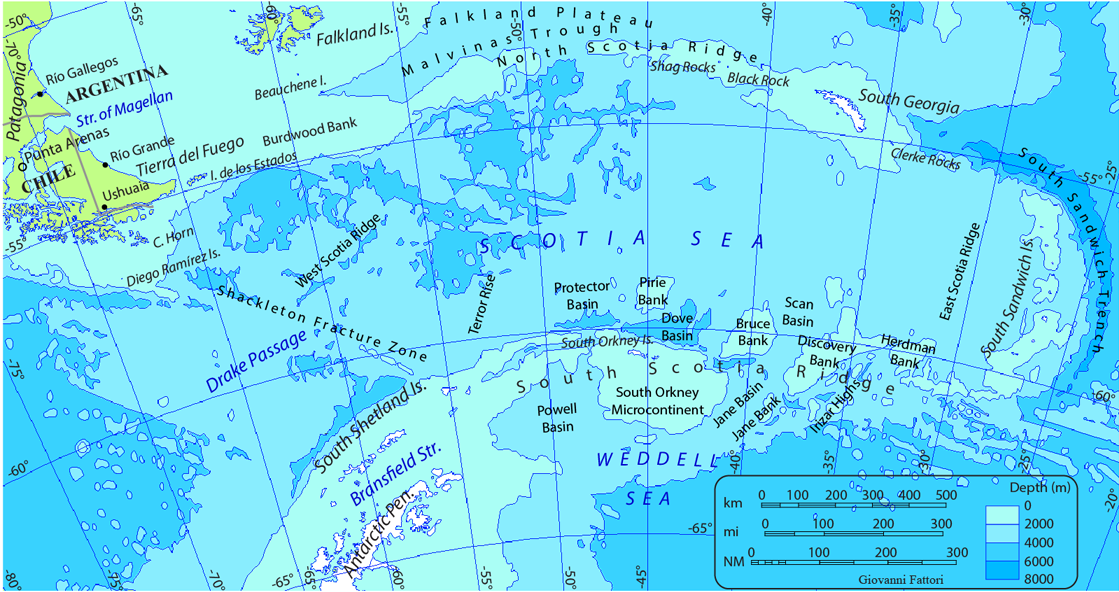
Here is a map of the local area showing evidence for both e-w faulting (A) and ne-sw faulting (B). 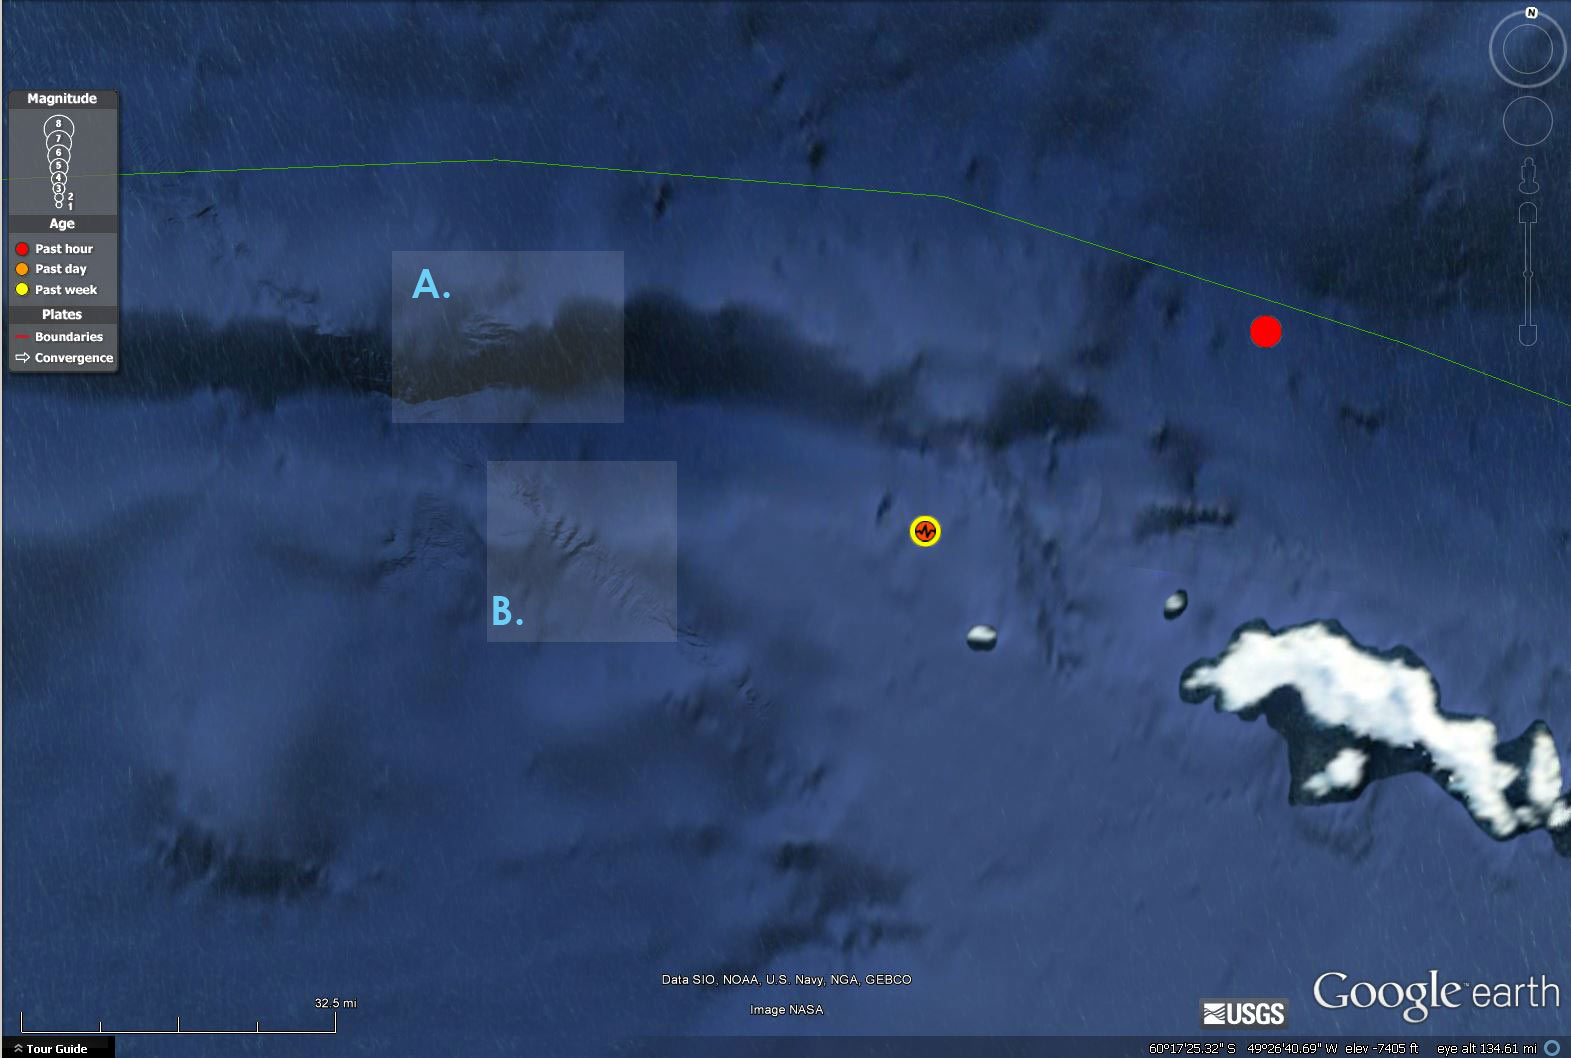
Here is a video map showing seismic waves from this earthquake radiate through the seismic network in the US. (9.6 MB mp4) 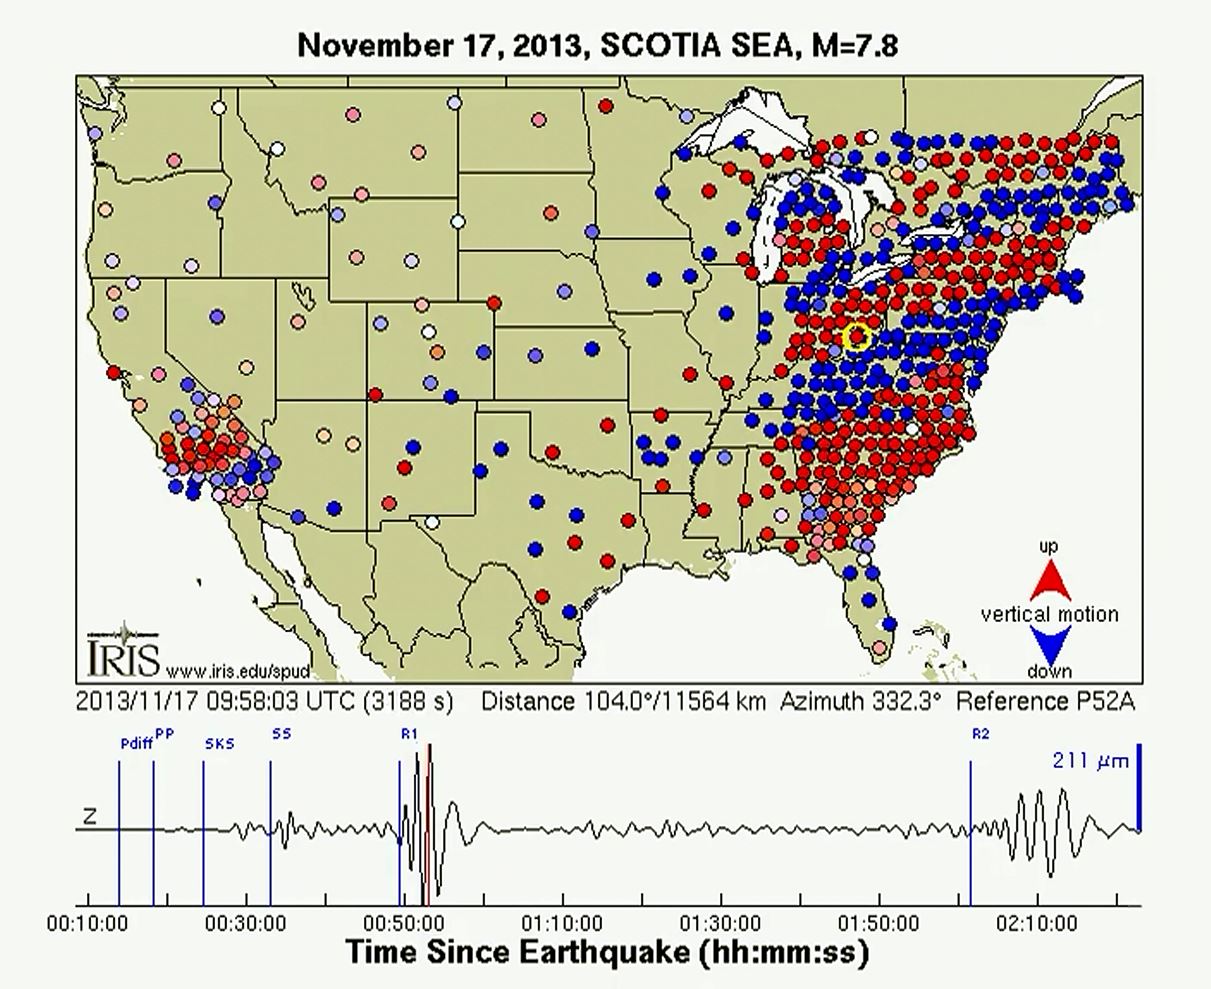
Here is a great paper on the tectonic evolution of the western Scotia Sea.
Here is a great web page with tectonic reconstructions of this region.
Here is one of their maps:
2 thoughts on “M7.8 Scotia Sea”