My USGS Earthquake Notification Service email inbox has been going on overtime.
There has been a swarm of earthquakes on the southeastern part of the big island, with USGS volcanologists hypothesizing about magma movement and suggesting that an eruption may be imminent. Here is a great place to find official USGS updates on the volcanism in Hawaii (including maps). I had been following this on social media.
Here is a temblor blogpost that I wrote. Here is a Spanish version.
Hawaii is an active volcanic island formed by hotspot volcanism. The Hawaii-Emperor Seamount Chain is a series of active and inactive volcanoes formed by this process and are in a line because the Pacific plate has been moving over the hotspot for many millions of years.
As these volcanoes grow with time, the flanks of the volcanoes become covered in new volcanic rock. The flanks become unstable and collapse as landslides. There is evidence that some of these landslides trigger some of the largest tsunami ever found.
The seismicity started in the central part of the “East Rift Zone” (ERZ), a region of extension probably caused by flank collapse. This extension lowers pressure in the magma chamber, leading to eruptions. Magma migrates around for various reasons, including changes in pressure in the magma chamber. These motions of magma and fluids can cause earthquakes.
This part of Hawaii is the locus of the most recent volcanism, with the newest volcanic center formed to the southeast of the island.
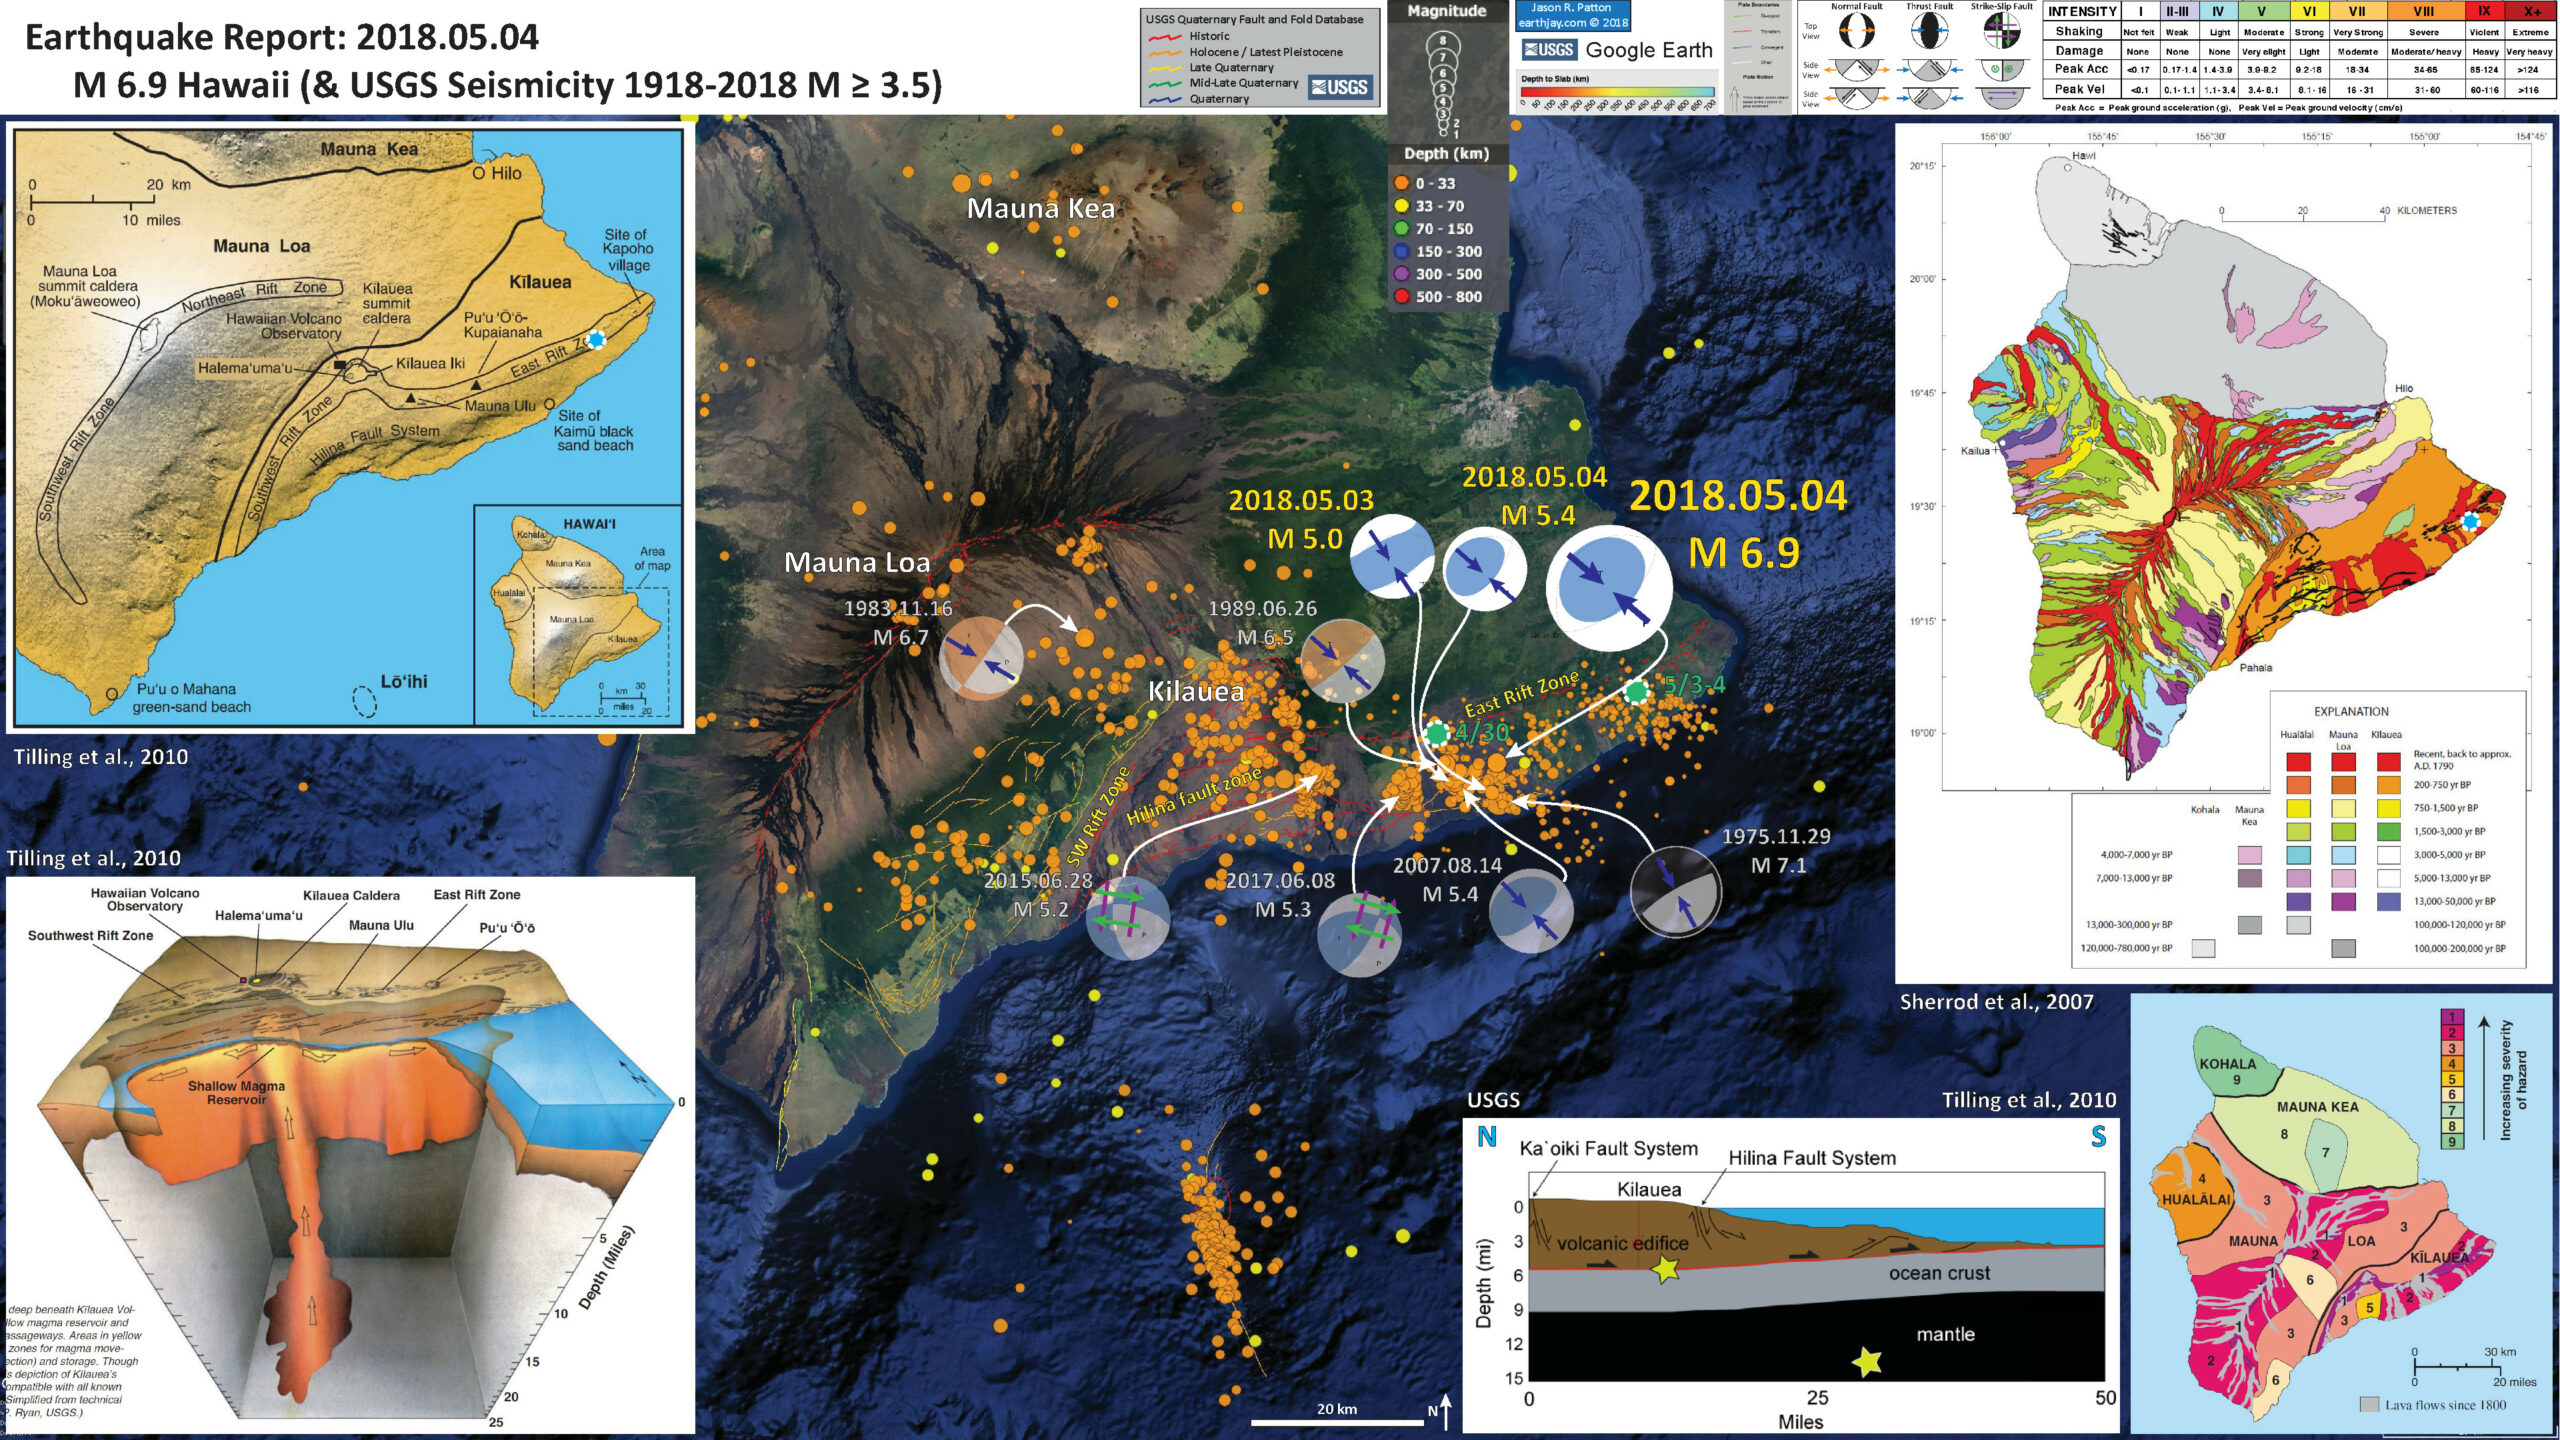
Southeast of the main Kilauea vent, the Pu‘u ‘Ö‘ö crater saw an elevation of lava into the crater, leading to overtopping of the crater (on 4/30/2018). Seismicity migrated eastward along the ERZ. This morning, there was a M 5.0 earthquake in the region of the Hilina fault zone (HFZ). I was getting ready to write something up, but I had other work that I needed to complete. Then, this evening, there was a M 6.9 earthquake between the ERZ and the HFZ.
There have been earthquakes this large in this region in the past (e.g. the 1975.1.29 M 7.1 earthquake along the HFZ). This earthquake was also most likely related to magma injection (Ando, 1979). The 1975 M 7.1 earthquake generated a small tsunami (Ando, 1979). These earthquakes are generally compressional in nature (including the earthquakes from today).
Today’s earthquake also generated a tsunami as recorded on tide gages throughout Hawaii. There is probably no chance that a tsunami will travel across the Pacific to have a significant impact elsewhere.
So. This M 6.9 may be the largest earthquake. There may be a larger one in store (the USGS suggests that these fault systems could produce a M 8 earthquake). The eruptions may be done for now. There may be more.
Below is my interpretive poster for this earthquake
I plot the seismicity from the past month, with color representing depth and diameter representing magnitude (see legend). I include earthquake epicenters from 1918-2018 with magnitudes M ≥ 4.5 in a second poster (and down to M ≥ 3.5 in a third poster).
I plot the USGS fault plane solutions (moment tensors in blue and focal mechanisms in orange) for the M 6.9 earthquake, in addition to some relevant historic earthquakes.
I placed green circles in the locations of the (a) 4/30 lava lake filling event and (b) 5/3-4 fissure eruption.
- I placed a moment tensor / focal mechanism legend on the poster. There is more material from the USGS web sites about moment tensors and focal mechanisms (the beach ball symbols). Both moment tensors and focal mechanisms are solutions to seismologic data that reveal two possible interpretations for fault orientation and sense of motion. One must use other information, like the regional tectonics, to interpret which of the two possibilities is more likely.
-
I include some inset figures.
- In the upper right corner is a geologic map with color representing the relative age of volcanic deposits (Sherrod et al., 2007). (red = youngest, orange next youngest) I placed a blue circle in the location of the vents that erupted on 5/3-4.
- In the upper left corner is a map that shows the rift zones (active extensional volcanism) and the region is divided by the major sources for the volcanic rocks (e.g. Mauna Kea, Mauna Loa, and Kilauea; Tilling et al., 2010). I placed a blue circle in the location of the vents that erupted on 5/3-4.
- In the lower left corner is a visualization showing the magma reservoir hypothesized to be the source of lava along the Southwest and East Rift zones, as well as for Kilauea (Tilling et al., 2010).
- In the lower right corner is a map that shows the relative severity of volcanic hazard for the island of Hawaii (Tilling, et al., 2010).
- To the left of the hazard map is a geological cross section showing the subsurface structures in the region (USGS).

- This version includes earthquakes M ≥ 4.5

- This version includes earthquakes M ≥ 3.5 (note the seismicity offshore to the south, this is where the youngest Hawaii volcano is).
- Here is a photo of the seismic wave record on the Humboldt State University, Department of Geology, baby benioff seismograph.

USGS Earthquake Pages
- 2018.05.04 M 5.0 Hawaii
- 2018.05.04 M 6.9 Hawaii
- 2018.05.04 M 5.4 Hawaii
These are from this current sequence
- I put together a short video that shows seismicity from the past month. This reveals how the magma may have moved throughout the region between 4/27 and 5/4. Here is a link to download the ~8 MB mp4 video file.
Some Relevant Discussion and Figures
- Here is the map showing the rifts (Tilling et al., 2010)
- This is the figure that shows an hypothetical configuration of the magma reservoir beneath Kilauea (Tilling et al., 2010).

Shaded relief map of the southeastern part of the Island of Hawai‘i, showing the principal features and localities of Mauna Loa, Kïlauea, and Lö‘ihi Volcanoes discussed in the text.
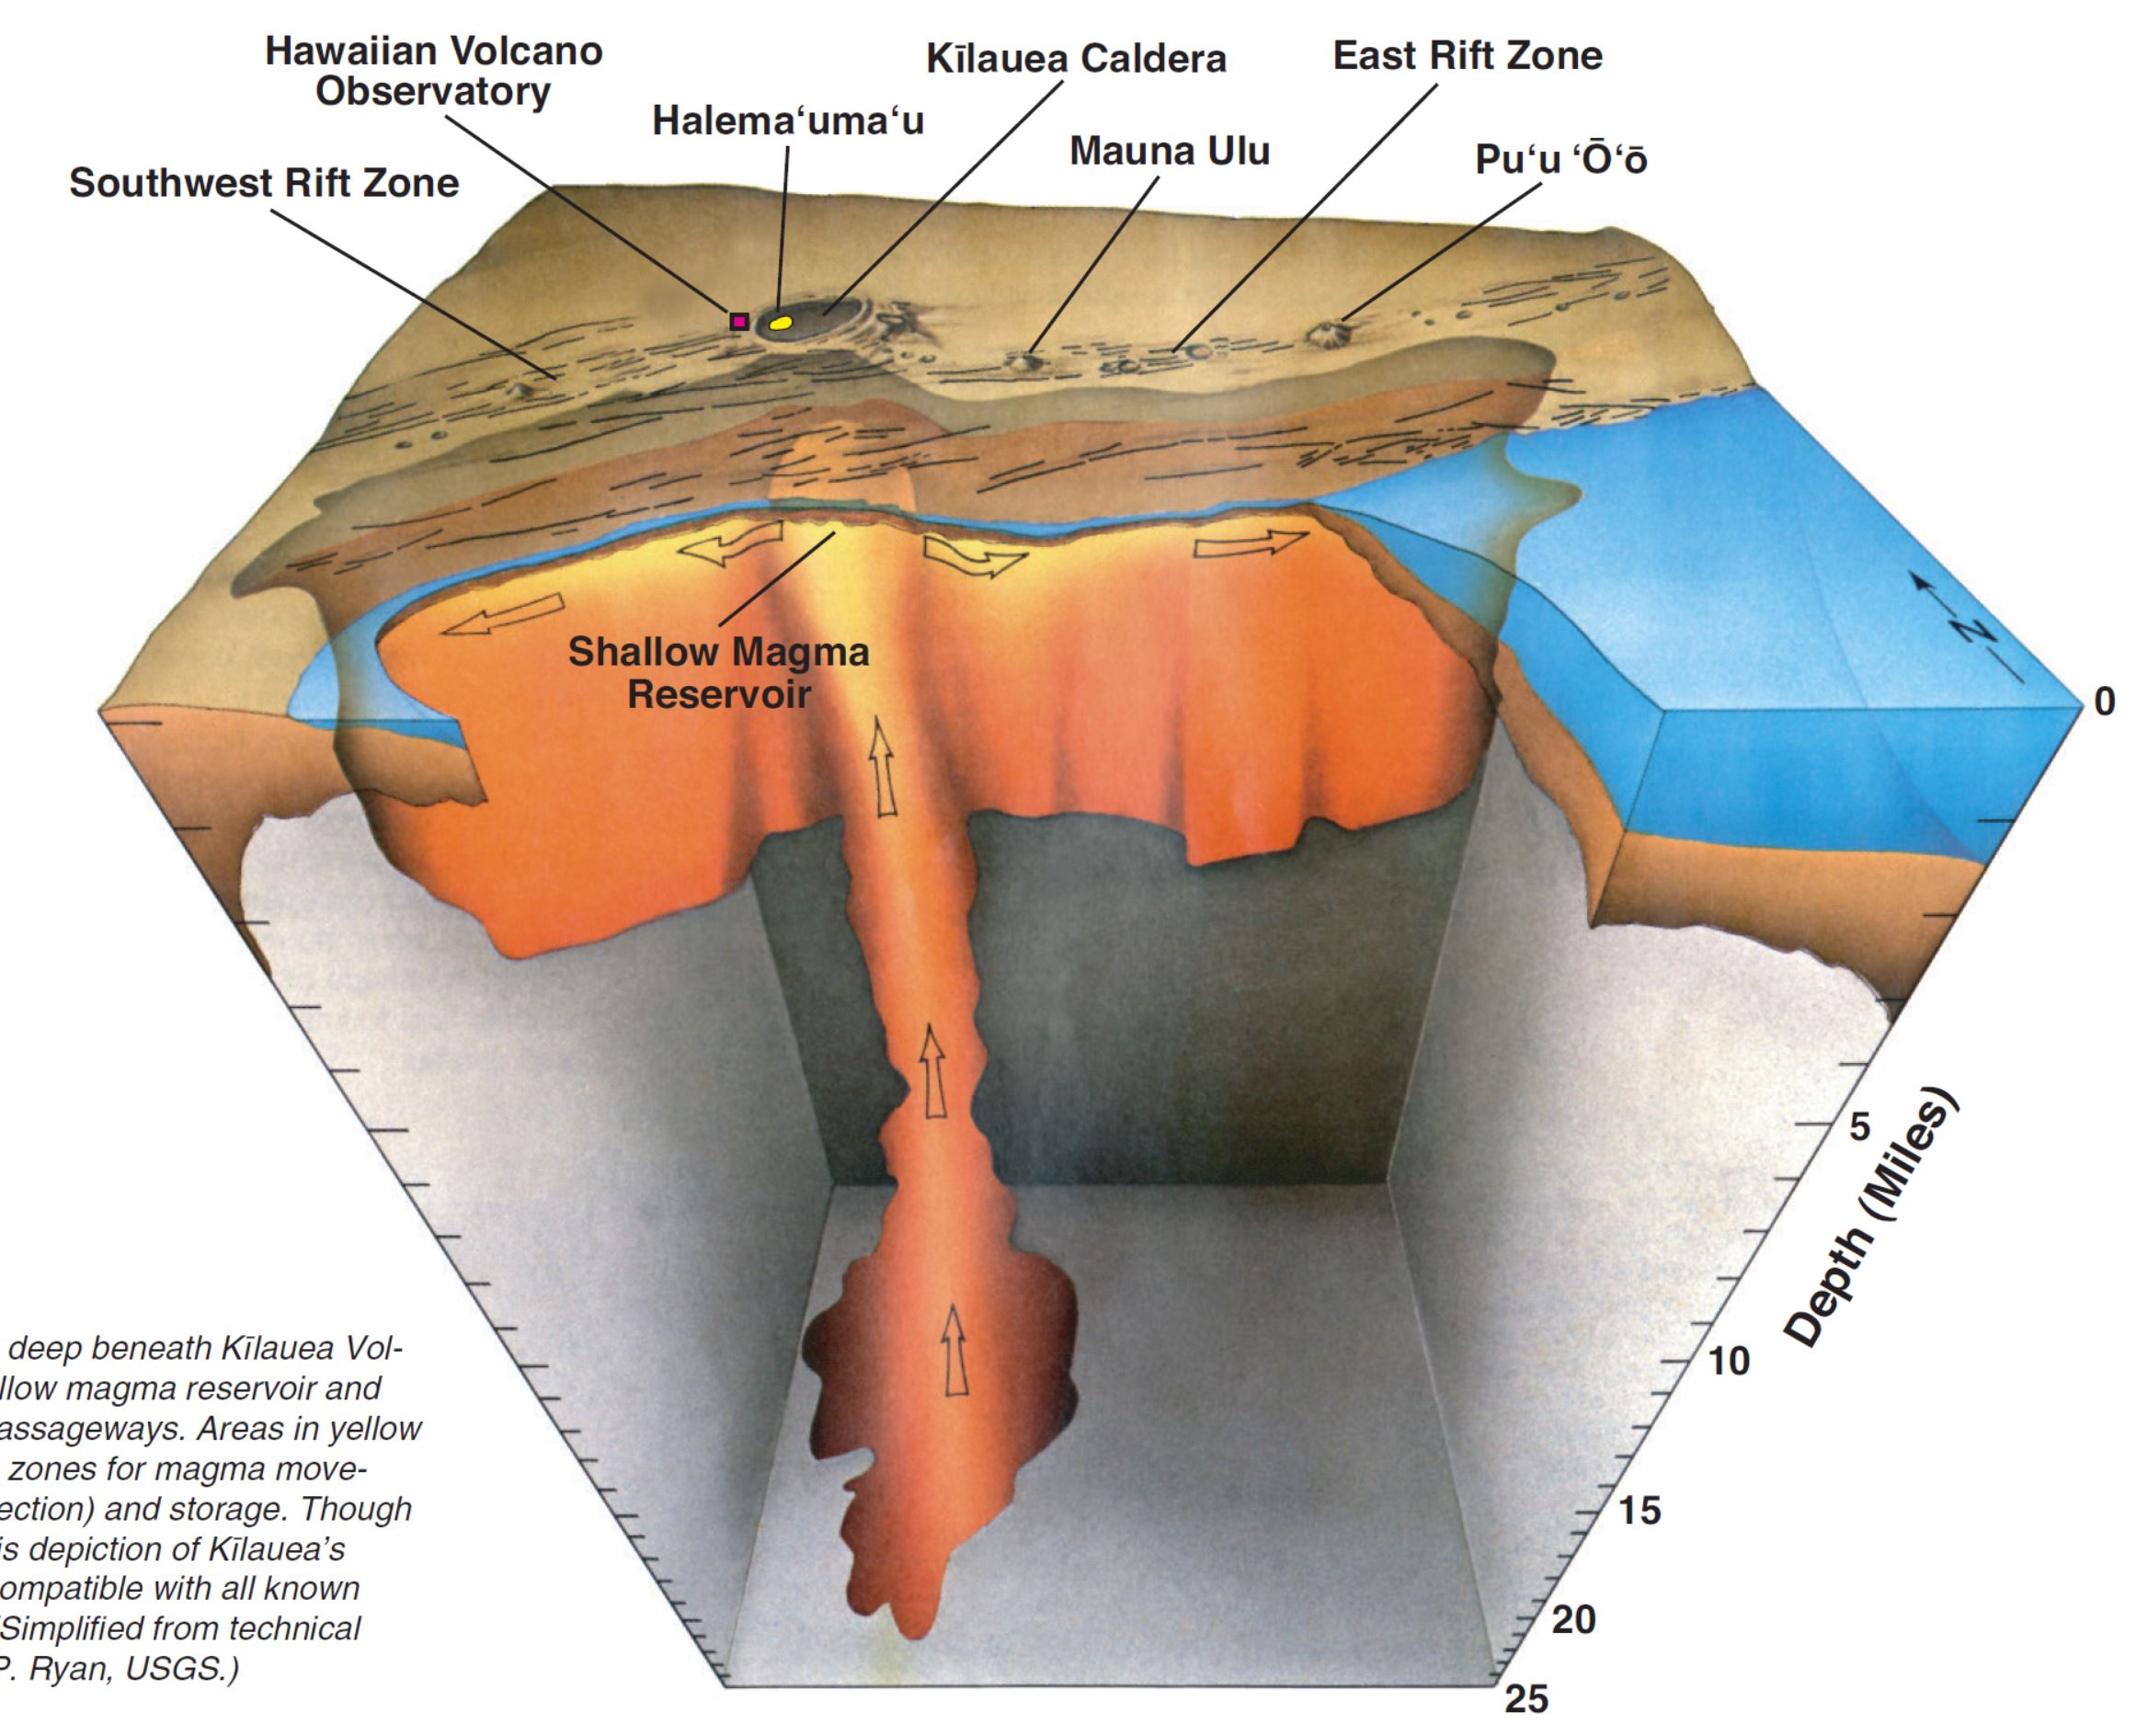
Cut-away view looking deep beneath Kïlauea Volcano, showing the shallow magma reservoir and the principal magma passageways. Areas in yellow are the most favorable zones for magma movement (arrows show direction) and storage. Though greatly generalized, this depiction of Kïlauea’s “plumbing system” is compatible with all known scientific information. (Simplified from technical illustration of Michael P. Ryan, USGS.)
- Below are a series of plots from tide gages installed at several sites in the Hawaii Island Chain. These data are all posted online here and here.
- Hilo, Hawaii
- Kawaihae, Hawaii
- Here is a plot showing the tsunami from the 1975 M 7.1 earthquake (Ando, 1979). On the left are modeled tsunami wave height based on two different fault models (each with fault dips of 20 degrees, but widths of 20km and 30km).


- This is a timeline of historic volcanism on Hawaii (Tilling et al., 2010).
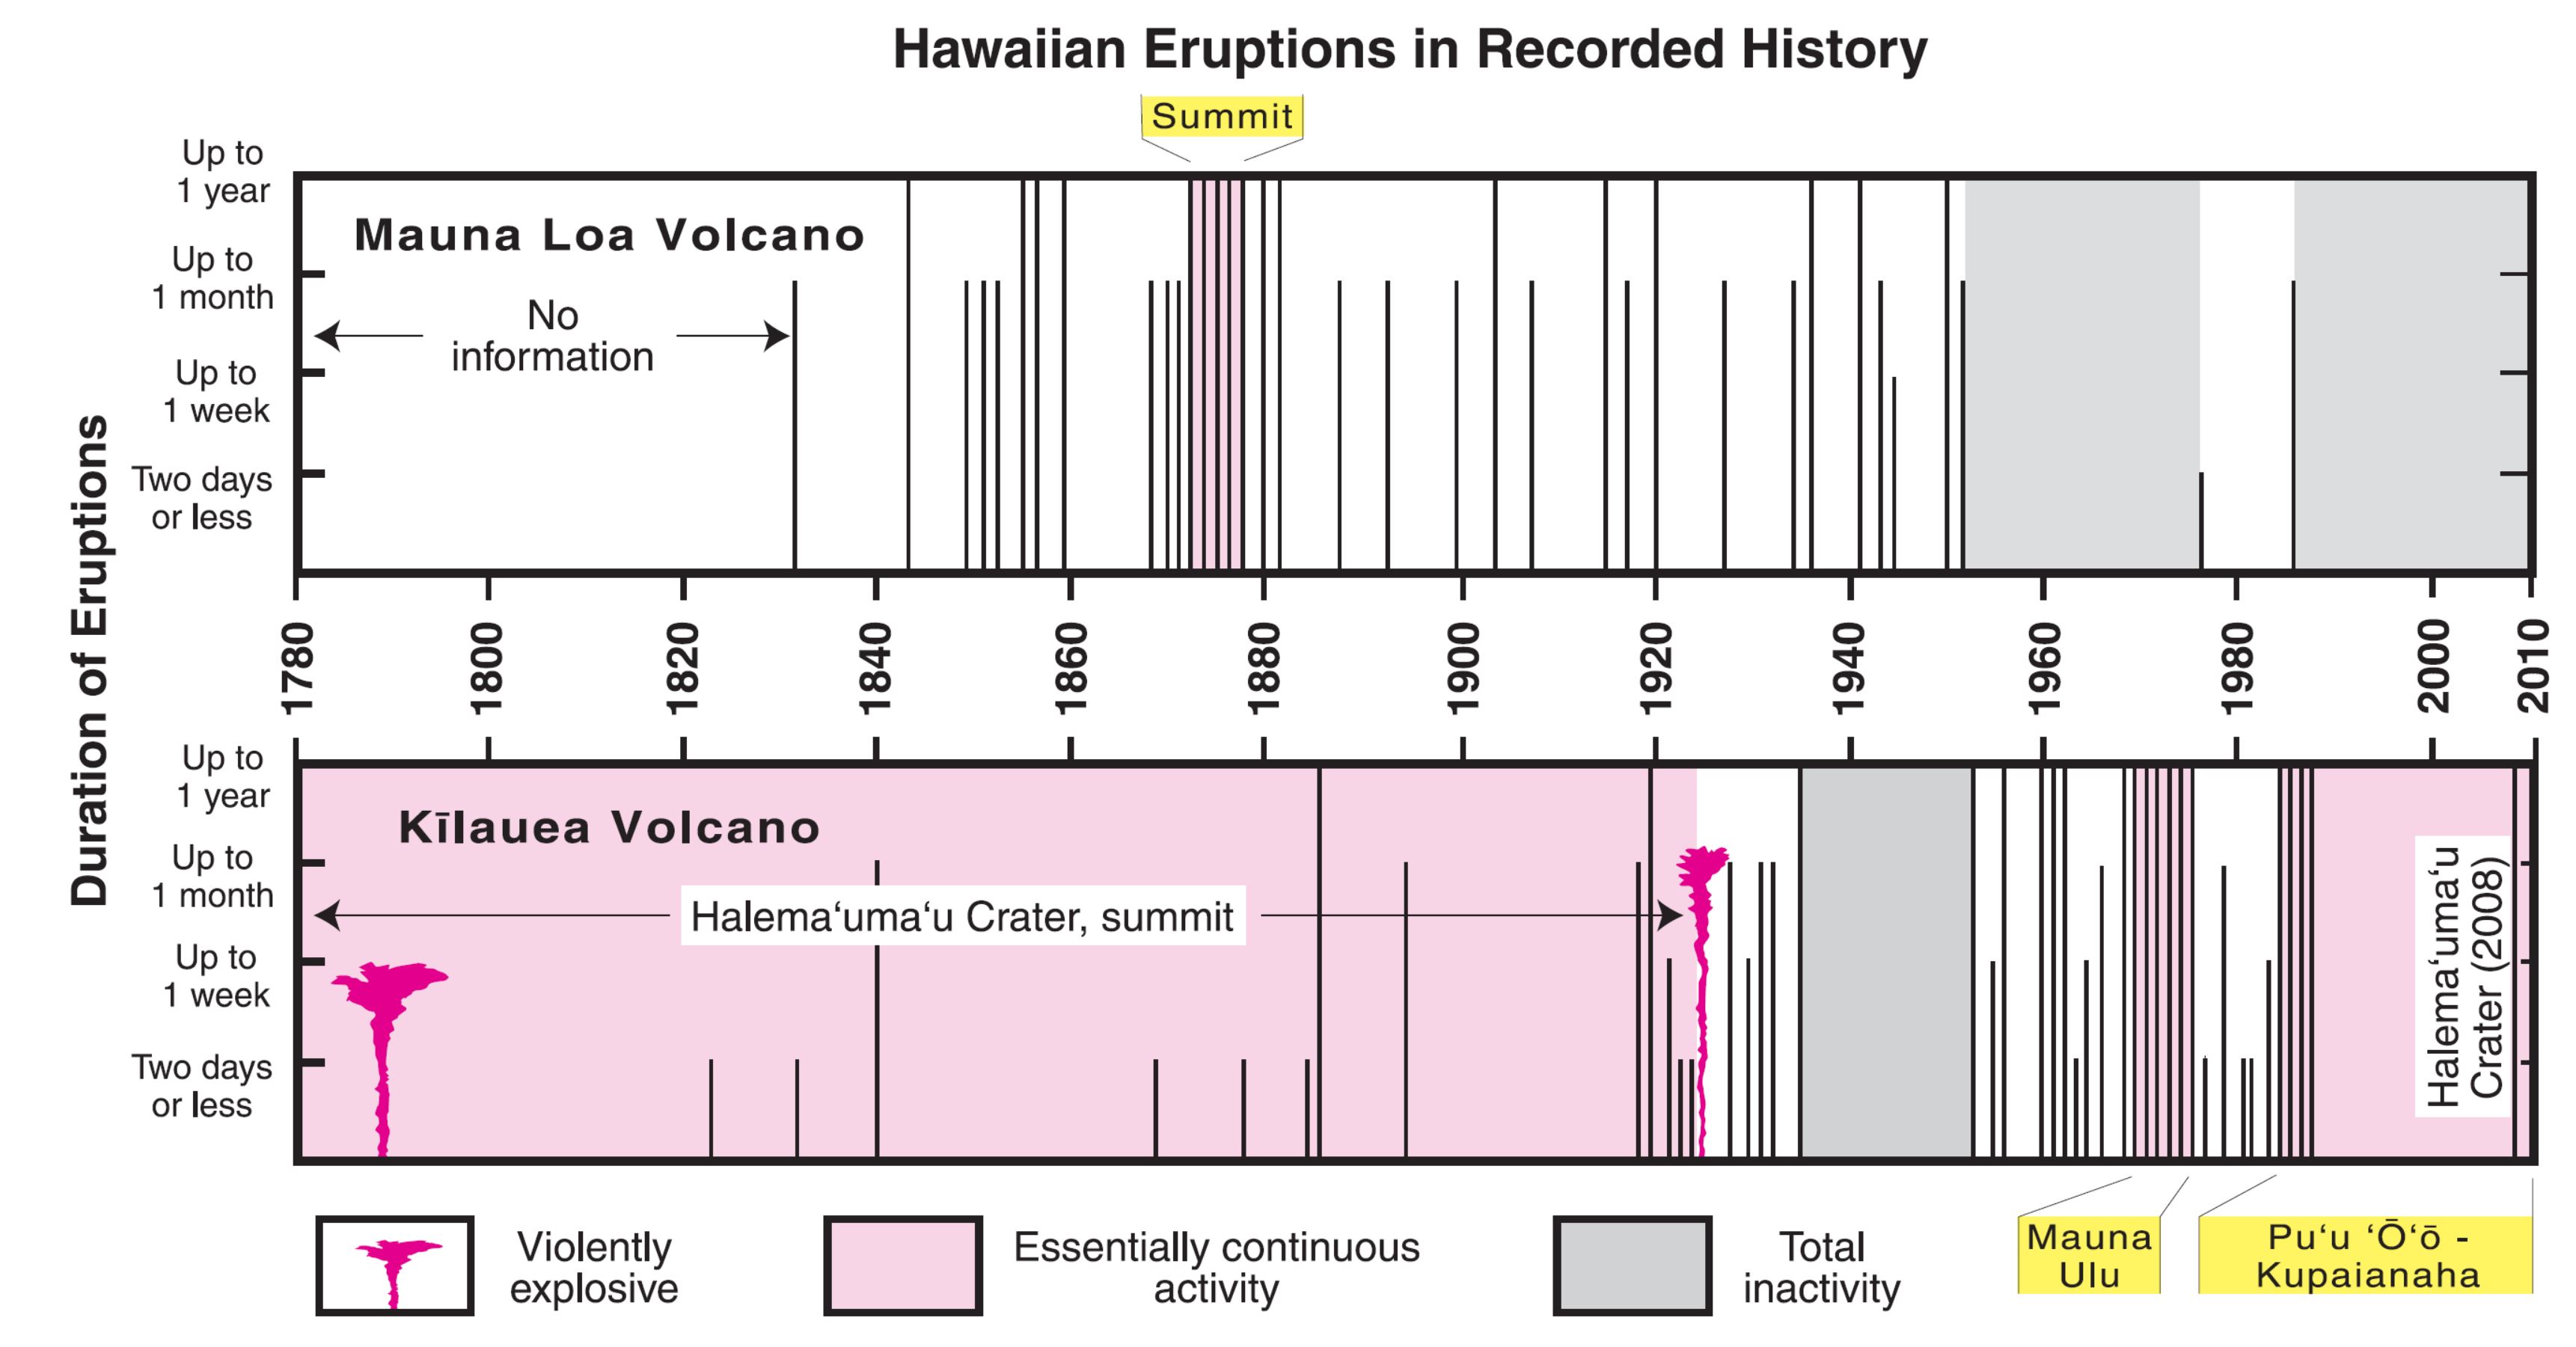
Graph summarizing the eruptions of Mauna Loa and Kïlauea Volcanoes during the past 200 years. The Pu‘u ‘Ö‘ö- Kupaianaha eruption has continued into the 21st century. Information is sketchy for eruptions before 1823, when the first missionaries arrived on the Island of Hawai‘i. The total duration of eruptive activity in a given year, shown by the length of the vertical bar, may be for a single eruption or a combination of several separate eruptions.
- Here is the volcanic hazard severity map from Tilling et al. (2010).

Map of Island of Hawai‘i showing the volcanic hazards from lava flows. Severity of the hazard increases from zone 9 to zone 1. Shaded areas show land covered by flows erupted in the past two centuries from three of Hawai‘i’s five volcanoes (Hualälai, Mauna Loa, and Kïlauea).
- Below is a series of maps that shows the recent volcanism in the region (Orr et al., 2012).

The first 3½ years of the Pu‘u ‘Öÿö eruption of Kïlauea Volcano (January 1983–June 1986) were dominated by episodic lava fountains that constructed the Pu‘u ‘Öÿö cone and fed ‘a‘ä flows (the less fluid of the two types of Hawaiian lava flows) (USGS photo by J.D. Griggs, June 1984). The map shows lava flows erupted from Kïlauea Volcano in the 19th and 20th centuries (gray). These flows originated from the summit caldera, the East Rift Zone, or the Southwest Rift Zone (not shown). Flows erupted during the first 3½ years of the Pu‘u ‘Öÿö eruption are shown in red. The Island of Hawai‘i (see inset map) is composed of five volcanoes—Kohala, Mauna Kea, Hualälai, Mauna Loa, and Kïlauea

In 1986, the Pu‘u ‘Öÿö eruption shifted to the Kupaianaha vent. This photo shows lava flows erupted from Kupaianaha entering the community of Kalapana on the Island of Hawai‘i’s southeast coast in May 1990 (USGS photo by J.D. Griggs). Over the following months, Kalapana was almost completely destroyed, and lava filled beautiful nearby Kaimü Bay. The map shows lava flows erupted from Kupaianaha and nearby fissures during 1986–1992 in red. Older flows from the Pu‘u ‘Öÿö eruption are shown in orange.

Lava flows erupt from new vents on the south flank of the Pu‘u ‘Öÿö cone (right side of photo) that opened after Pu‘u ‘Öÿö Crater filled to overflowing in early 2004 (USGS photo by Richard Hoblitt, January 2004). Collapse of the southwest side of the cone formed a scallop-shaped scar, revealing red layers of welded spatter (deposited as clots of molten lava) that under-lie loose tan-colored pyroclastic deposits (hot debris ejected during an eruption). The map shows flows erupted from Pu‘u ‘Öÿö and from fissures in Näpau Crater during 1992–2007 in red. Older flows from the Pu‘u ‘Öÿö eruption are shown in orange.

A lava channel, elevated as much as 150 feet (45 meters) above the adjacent terrain, transports lava away from the Fissure D vent, which opened in July 2007 (USGS photo by James Kauahikaua, October 2007). The “perched” (elevated) lava channel was the main path for lava until November 2007, when lava was diverted from the vent to the southeast. Pu‘u ‘Öÿö is at upper right. The map shows lava flows erupted in Pu‘u ‘Öÿö and from the Fissure D vent between Pu‘u ‘Öÿö and Kupaianaha during 2007–2011 in red. Older flows from the Pu‘u ‘Öÿö eruption are shown in orange.

In March 2011, lava broke to the surface between Pu‘u ‘Öÿö and Näpau Crater marking the start of the Kamoamoa fissure eruption. In this photo lava erupts from the fissure shortly after the beginning of the eruption and pours into a deep, older crack (USGS photo by Tim Orr). The map shows flows erupted during the Kamoamoa eruption and from Pu‘u ‘Öÿö during 2011–2012 in red. The Kamoamoa flows are to the left, flows from the August 2011 Pu‘u ‘Öÿö flank breakout are at center, flows from a fissure high on Pu‘u ‘Öÿö’s northeast flank are to the right. Older flows from the Pu‘u ‘Öÿö eruption are shown in orange.
- This map highlights the seismicity associated with volcanism related to the youngest volcano in the Hawaii Islands (Tilling et al., 2010).

Map showing the locations of earthquakes that occurred during the 1970s and in the July–August 1996 period in the vicinity of Lö‘ihi. These earthquake swarms, plus similar occurrences in 1984–85 and the early 1990s, provide seismic evidence that Lö‘ihi is an active submarine volcano.
- The ERZ and HFZ are also actively deforming between earthquakes. Below are two maps that show (a) regional vertical land motion and (b) results from block modeling to resolve the differential motion across this area (Shirzaei et al., 2013).

The linear velocity field in the line of sight of the descending-orbit Envisat satellite (track 200) over the Kilauea south flank from 2003 till 2010. Area of the study, Hilina Fault System (HFS), is outlined by dashed box. Location of GPS stations used is marked by their names next to filled squares colored by the mean rate of motion in the LOS direction. Station PGF1 is the reference for both GPS and InSAR datasets. WHP = western Hilina Pali, HP = Holei Pali.

Colored panels represent relatively coherently moving blocks based on the InSAR deformation over the HFS according to Figs. 2–4 and traces of mapped faults, which are used to compare with GPS data. Each block is labeled by its average LOS velocity.
Geologic Fundamentals
- This is an image from the USGS that shows how, when an oceanic plate moves over a hotspot, the volcanoes formed over the hotspot form a series of volcanoes that increase in age in the direction of plate motion. The presumption is that the hotspot is stable and stays in one location. Torsvik et al. (2017) use various methods to evaluate why this is a false presumption for the Hawaii Hotspot.
- Here is a map from Torsvik et al. (2017) that shows the age of volcanic rocks at different locations along the Hawaii-Emperor Seamount Chain.

A cutaway view along the Hawaiian island chain showing the inferred mantle plume that has fed the Hawaiian hot spot on the overriding Pacific Plate. The geologic ages of the oldest volcano on each island (Ma = millions of years ago) are progressively older to the northwest, consistent with the hot spot model for the origin of the Hawaiian Ridge-Emperor Seamount Chain. (Modified from image of Joel E. Robinson, USGS, in “This Dynamic Planet” map of Simkin and others, 2006.)

Hawaiian-Emperor Chain. White dots are the locations of radiometrically dated seamounts, atolls and islands, based on compilations of Doubrovine et al. and O’Connor et al. Features encircled with larger white circles are discussed in the text and Fig. 2. Marine gravity anomaly map is from Sandwell and Smith.
- Here is a great educational video from the USGS that discusses eruptions in 2011, which were similar in type and style of eruptions as the current phase of eruption. Here is a link to the 4 MB mp4 video file.
- For more on the graphical representation of moment tensors and focal mechanisms, check this IRIS video out:
- Here is a fantastic infographic from Frisch et al. (2011). This figure shows some examples of earthquakes in different plate tectonic settings, and what their fault plane solutions are. There is a cross section showing these focal mechanisms for a thrust or reverse earthquake. The upper right corner includes my favorite figure of all time. This shows the first motion (up or down) for each of the four quadrants. This figure also shows how the amplitude of the seismic waves are greatest (generally) in the middle of the quadrant and decrease to zero at the nodal planes (the boundary of each quadrant).

- There are three types of earthquakes, strike-slip, compressional (reverse or thrust, depending upon the dip of the fault), and extensional (normal). Here is are some animations of these three types of earthquake faults. The following three animations are from IRIS.
Strike Slip:
Compressional:
Extensional:
Social Media
Earthquakes in #Hawaii – what you need to know. From the @USGS https://t.co/G3zjXwUBFZ #earthquake pic.twitter.com/UOqbXeycUi
— IRIS Earthquake Sci (@IRIS_EPO) May 5, 2018
Volcano talk! Kilauea is the world's most active volcano. It's been erupting since the early 1980s. Hawai'i volcanoes are shield volcanoes, meaning they don't look or erupt like their stratovolcano (cone-shaped) cousins. Here's a pic of Kilauea's summit eruption last April. 1/ pic.twitter.com/u6rhjiDM0N
— Jess Phoenix (@jessphoenix2018) May 4, 2018
https://t.co/IO9VJ8yYVL An eruption has begun in the Puna District of the Big Island of Hawai'i. Eruptions in this area are rarer, but more people live there as well. Here's a bit of perspective on why this eruption isn't "run of the mill". pic.twitter.com/SQmaOJR7oN
— Garry Hayes (@geotripper) May 4, 2018
#earthquake #hawaii video my boyfriend took in our house in Papaikou during the 6.9 earthquake 😳 pic.twitter.com/xAAjeN1zFO
— Allison (@Allieb1792) May 5, 2018
Earthquakes migrate east of Pu‘u ‘Ō‘ō, signaling an intrusion of magma along the middle and lower East Rift Zone. Orange dashed line marks the approximate area within which most of the earthquakes are located. https://t.co/vJRUw2HRvh pic.twitter.com/nhMbMH20yW
— USGS Volcanoes🌋 (@USGSVolcanoes) May 3, 2018
VIDEO – What is a volcanic hotspot?https://t.co/HjaDofrKJU #earthquake #Hawaii #volcano #hawaiivolcano pic.twitter.com/Esu4rYA03v
— IRIS Earthquake Sci (@IRIS_EPO) May 5, 2018
Phwoooarrrr, look at those gorgeous fringes. https://t.co/JgyJwtxlIW
— Stephen Hicks (@seismo_steve) May 3, 2018
Kilauea has been an active volcano for a very long time. To learn more about the recent history, go here: https://t.co/5EPtjQ2lR3 pic.twitter.com/zdRpnHHjEU
— Dr Janine Krippner (@janinekrippner) May 4, 2018
Mw=6.8, HAWAII (Depth: 32 km), 2018/05/04 22:32:55 UTC – Full details here: https://t.co/Ii2DCFI3ga pic.twitter.com/WNlRcGFNmP
— Earthquakes (@geoscope_ipgp) May 4, 2018
NASA-JPL ARIA automatic wrapped interferogram Copernicus Sentinel-1 (2.8 cm contours) with USGS preliminary epicenter for Mw6.9 earthquake (red star). My early interpretation is earthquake likely on detachment beneath East Rift Zone. pic.twitter.com/ZocsY4AuTO
— Eric Fielding (@EricFielding) May 4, 2018
And for seismology fans, some jargon: the double couple % of 66 for this moment tensor suggests this M5.4 may not be simple motion on a fault plane, or it could just be due to this being a small quake in a complex velocity structure https://t.co/ghwUiIUxJP pic.twitter.com/sAK0Ay95dK
— Jascha Polet (@CPPGeophysics) May 4, 2018
How the erupting Hawaiian #volcano caused today’s magnitude 6.9 quake on Hawaii Island — and was felt as far as Honolulu #Kilauea https://t.co/jSKTuFhJ3m pic.twitter.com/spL90lBtDJ
— Ron Lin (@ronlin) May 5, 2018
Mechanism for M5.6 from @geoscope_ipgp similar to that of other large shallow earthquakes on the Big Island, such as the 1975 Kalapana M7.5+ quake https://t.co/gfGfu4MFxn pic.twitter.com/eAvk6HaUmJ
— Jascha Polet (@CPPGeophysics) May 4, 2018
#Kilauea update: #PuuOo erupted red ash when crater collapsed (webcam is coated).
+ 61G flow sluggish, but active.
+ 1km-long #groundcrack uprift of PuuOo
+ Summit unaffected by ERZ activity
Update: https://t.co/sfajMPjR8Z
Images: https://t.co/gU4wYZM10M#Hawaii #volcano pic.twitter.com/FyzlrSWb8w— USGS Volcanoes🌋 (@USGSVolcanoes) May 2, 2018
Own processing of a Sentinel-1 interferogram showing deformation (from 19th March to 1st May 2018) before the current Kilauea eruption.
Note: Same interferogram (and essentially same information) as already provided by HVO USGS, differences due to refined InSAR processing. pic.twitter.com/3ARmvbkDTS
— Pablo J. González (@pabloj_gonzalez) May 4, 2018
Get @ESA_EO #Sentinel1 ifgrms for Kilauea, Hawaii from @UAFGI #SARVIEWS portal. All #InSAR data & geocoded images can be freely downloaded @ https://t.co/chhgAEwy4q. Go & get your research on 🛰️!
More data also from @NERC_COMET & @NASAJPL #ARIA @InSARinfo @Ak_Satellite pic.twitter.com/baZqxsabwT
— Franz J Meyer (@SARevangelist) May 5, 2018
Scientists predicted that the current #KilaueaVolcano #eruption was going to happen! Since collapse of the Pu'u O'o vent (4/30), there have been tons of earthquakes under the East Rift Zone- signaling magma injection that way
I made this map showing Mag 2+ EQs in last week pic.twitter.com/DVOdqIQtIg— Dr. Brad Pitcher (@TieDyeSciGuy) May 4, 2018
#Ahora – se registra una erupción fisural en Leilani Estates al sureste de la Isla Grande, Hawái. Al fondo se observa lava brotando de la fractura en la superficie.
Créditos: @JenMyersFox4 & Jeff Wise
— SkyAlert (@SkyAlertMx) May 4, 2018
Drone video from above the lava outbreak in Leilani Estates on Hawaii Island shows roads, homes near the path of destruction. MORE: https://t.co/ji6WuCmylO pic.twitter.com/q41ZyD8hix
— Hawaii News Now (@HawaiiNewsNow) May 4, 2018
New map of locations of first three eruptive fissures in Leilani Estates Subdivision (Hawaii) as of this morning (May 4). Fissures are jetting sulfur dioxide gas and lava spatter. Updated maps will be posted on the USGS-Hawaiian Volcano Observatory page at https://t.co/TD5y5GV1Xk pic.twitter.com/ACS76UibXv
— USGS Volcanoes🌋 (@USGSVolcanoes) May 4, 2018
VIDEO – What do earthquakes tell us about a volcano? https://t.co/4sLpdlKeY7 #Earthquake activity beneath a #volcano usually increases before an eruption bc magma & gases must force their way up through underground fractures & passageways causing rocks to break & vibrate. pic.twitter.com/oahBGnlU7l
— IRIS Earthquake Sci (@IRIS_EPO) May 5, 2018
Kilauea Volcano Erupts: information from USGS, with more information links:https://t.co/9L65xWK6O6 pic.twitter.com/SFWXWMCAlL
— Dr Janine Krippner (@janinekrippner) May 4, 2018
I’ve updated today’s post on the #LeilaniEstates eruption with news of the M6.9 earthquake on the East Rift zone and continuing fissure eruptions: https://t.co/1apjbUJIir pic.twitter.com/FRnBRaYs14
— Erik Klemetti (@eruptionsblog) May 5, 2018
There have been more than 428 M2+ #earthquakes along the south flank of #Kilauea in the last month. The recent M6.9 is the largest in this series. #Hawaiiearthquake https://t.co/Jb3K65hzDR pic.twitter.com/DvjyRxUEB6
— IRIS Earthquake Sci (@IRIS_EPO) May 5, 2018
WEBINAR – Several flavors of seismogenic magma movement under Kilauea Volcano https://t.co/LodCt1afLQ #KilaueaVolcano #hawaiivolcano pic.twitter.com/SQfFLRaaPd
— IRIS Earthquake Sci (@IRIS_EPO) May 5, 2018
Seismic waves from the M6.9 Hawaii earthquake rolled through greater Vancouver about 30 minutes ago. Not felt in #Canada, but easily recorded by our seismometers.
Details on the earthquake and impacts in Hawaii from the USGS:https://t.co/1z5aYWuzcn pic.twitter.com/SbD8a3zJVW— John Cassidy (@earthquakeguy) May 4, 2018
UPDATE 5/5
The IRIS special events page for the #Hawaiiearthquake is now live. We welcome any additional contributions that might be of interest to the seismology research community.https://t.co/0c9crR3lSr pic.twitter.com/4xjcPs4VAx
— IRIS Earthquake Sci (@IRIS_EPO) May 5, 2018
https://t.co/IO9VJ8yYVL An eruption has begun in the Puna District of the Big Island of Hawai'i. Eruptions in this area are rarer, but more people live there as well. Here's a bit of perspective on why this eruption isn't "run of the mill". pic.twitter.com/SQmaOJR7oN
— Garry Hayes (@geotripper) May 4, 2018
Watch the waves from the recent #hawaiiearthquake travel across the USArray seismic network (https://t.co/RIcNz4bgWq) in Alaska! https://t.co/t6zCZT4y3R pic.twitter.com/sKaV1bPHPI
— IRIS Earthquake Sci (@IRIS_EPO) May 5, 2018
#GPS data show up to 0.5 m of motion due to Friday's M6.9 #earthquake at #Kilauea. A computer simulation indicates up to 2.5 m of motion on the #fault beneath Kilauea, 7-9 km beneath the volcano's south flank. pic.twitter.com/hhZHif6ysS
— USGS Volcanoes🌋 (@USGSVolcanoes) May 5, 2018
7 am Eruption Update: Fissure Activity Continues In Leilani.
“Active volcanic vents are located on Makamae, Kaupili and Mohala Streets,”
Recording: https://t.co/nBTjpFJiTc pic.twitter.com/fFOXqsJXQs— Dr Janine Krippner (@janinekrippner) May 5, 2018
#Sentinel1 #InSAR result for Apr 19-May 1 (6 pm local) from #Kilauea shows deformation due to ongoing magmatic intrusion. Magma withdrawn from middle East Rift Zone and intruded beneath lower East Rift Zone. No coincident deflation of summit. Update: https://t.co/sfajMPjR8Z pic.twitter.com/szjuyk2b5D
— USGS Volcanoes🌋 (@USGSVolcanoes) May 2, 2018
#NOAA20 saw the #Kilauea #volcano eruption on #Hawaii's Big Island last night. The bright spots at Pu'u O'o crater show the site of yesterday's earthquake and lava flows. Learn more: https://t.co/aA2Tw1ZbIm pic.twitter.com/z8fN5feV9D
— NOAA Satellites (@NOAASatellites) May 4, 2018
#Kilauea #eruption in #LeilaniEstates ended ~6:30PM last night. #Lava spatter & #gas bursts erupted from #fissure for ~2 hours. Lava spread ~10m (33ft). See Descriptions & updates on #HVO website. Scientists monitored overnight – more updates this AM. https://t.co/fXSpF9YxwX pic.twitter.com/1a6KK0cSCn
— USGS Volcanoes🌋 (@USGSVolcanoes) May 4, 2018
Here’s footage of some of the lava activity inside Leilani Estates from CB photographer @corylumphoto #Kilauea #bigisland pic.twitter.com/OkZz9xw6aJ
— Honolulu Civil Beat (@CivilBeat) May 5, 2018
WATCH: This fissure from the #Kilauea #Volcano eruption is spewing #lava and molten rock. The sound was unexpectedly thunderous. One of the most amazing things I’ve ever experienced. pic.twitter.com/G27LXE2Vvq
— Stephanie Elam (@StephanieElam) May 5, 2018
Mount #Kilauea on the Big Island in Hawaii erupted straight through a subdivision on Thursday. Mandatory evacuations were issued as magma gushed from the new vent, cracking roads and splitting the earth through the volcano's East Rift Zone. [THREAD] pic.twitter.com/mBG68fEe5E
— Capital Weather Gang (@capitalweather) May 4, 2018
Latest @USGSVolcanoes map of the 8 fissures that have formed during the current #Kilauea eruption: https://t.co/8Y4gPq7VSY pic.twitter.com/kqLmuIkXnP
— Dr Janine Krippner (@janinekrippner) May 5, 2018
The change in the Halemaʻumaʻu Overlook Vent from yesterday (4 May) to today: https://t.co/lXKYFjcyJK #Kilauea pic.twitter.com/Mmt87rS3hs
— Dr Janine Krippner (@janinekrippner) May 5, 2018
Better NASA-JPL ARIA automatic interferogram from Copernicus Sentinel-1 acquired 23 April and 5 May 2018. Wrapped interferogram with 2.8 cm color contours. This includes both magma movement in rift and M6.9 earthquake signals making complex pattern of fringes. pic.twitter.com/m47tOLlsy1
— Eric Fielding (@EricFielding) May 5, 2018
So, why is #Kilauea so active?? The plumbing beneath Kilauea by @TheEarthStory here: https://t.co/WFKPHBbbpo pic.twitter.com/pT1kAY8dD8
— Dr Janine Krippner (@janinekrippner) May 5, 2018
Field photos just in: at 07:45 a.m. HST, today (May 5), lava from fissure 7 slowly advanced to the northeast on Hookapu Street. https://t.co/5w1RIQyCCC pic.twitter.com/ZuG3uH5oiv
— USGS Volcanoes🌋 (@USGSVolcanoes) May 6, 2018
Fissure 7 from the intersection of Leilani and Makamae Streets in the Leilani Estates subdivision on Kīlauea Volcano's lower East Rift Zone. https://t.co/trIyZtTgSc pic.twitter.com/3GUbAkMhTy
— USGS Volcanoes🌋 (@USGSVolcanoes) May 6, 2018
Impressive decrease (~20cm) in change in distance between 2 GPS station near Pu‘u ‘Ō‘ō crater #KilaueaVolcano. One station located on the north rim of the crater, the other on the south flank. Can be interpreted as deflation of the summit magma reservoir https://t.co/Jgefhoizzk pic.twitter.com/vIL3YlKcMm
— Lucile Bruhat (@seismolucy) May 5, 2018
#Kilauea eruption update by @USGSVolcanoes https://t.co/p9ZRiWGxcp
Civil defense updates and instructions: https://t.co/0RBhz98iGv pic.twitter.com/ISsejP6e6z— Dr Janine Krippner (@janinekrippner) May 6, 2018
What is an interferogram? Learn more on the @IRIS_EPO website here: https://t.co/pf3I4H4vYl https://t.co/C5d5T119Ps
— Dr Janine Krippner (@janinekrippner) May 6, 2018
Want to know more on how the earthquakes can be linked to surface volcanic activity? I’ve written a short piece that gives some more details: https://t.co/OG222axTJY https://t.co/KoASw1xzdM
— Chris Rowan (@Allochthonous) May 6, 2018
- Ando, M., 1979. The Hawaii Earthquake of November 29, 1975: Low Dip Angle Faulting Due to Forceful Injection of Magma in JGR, v. 84, no. B13
- Orr, T.R., et a., 2012. The Ongoing Pu‘u ‘Ö‘ö Eruption of Kïlauea Volcano, Hawai‘i—30 Years of Eruptive Activity in USGS Fact Sheet 2012-3127, 2013.
- Sherrod, D.R., Sinton, J.M., Watkins, S.E., and Brunt, K.M., 2007, Geologic Map of the State of Hawaii: U.S. Geological Survey Open-File Report 2007-1089, 83 p., 8 plates, scales 1:100,000 and 1:250,000, with GIS database
- Tilling, R.I., Keliker, C., and Swanson, D.A., 2010. Eruptions of Hawaiian Volcanoes—Past, Present, and Future, U.S. Geological Survey, General Information Product 117, 72 pp.
- Torsvik, T.H., et al., 2017. Pacific plate motion change caused the Hawaiian-Emperor Bend in Nature Communications, DOI: 10.1038/ncomms15660