Social media was abuzz today about the M 6.0 earthquake in Napa. Here is the USGS webpage for the M 6.1 earthquake. This earthquake, and the aftershocks, have epicenters that lie between the Rogers Creek and Green Valley fault systems. These two major fault systems are inboard/east of the San Andreas fault, each accommodating a portion of the Pacific-North America plate boundary relative motion rate. Today’s earthquake swarm appears to plot near the West Napa fault (WNF) and east of the Carneros fault (CF). The WNF is not mapped as far south as this earthquake swarm, but the fault system likely extends south, as possibly evidenced by today’s swarm.
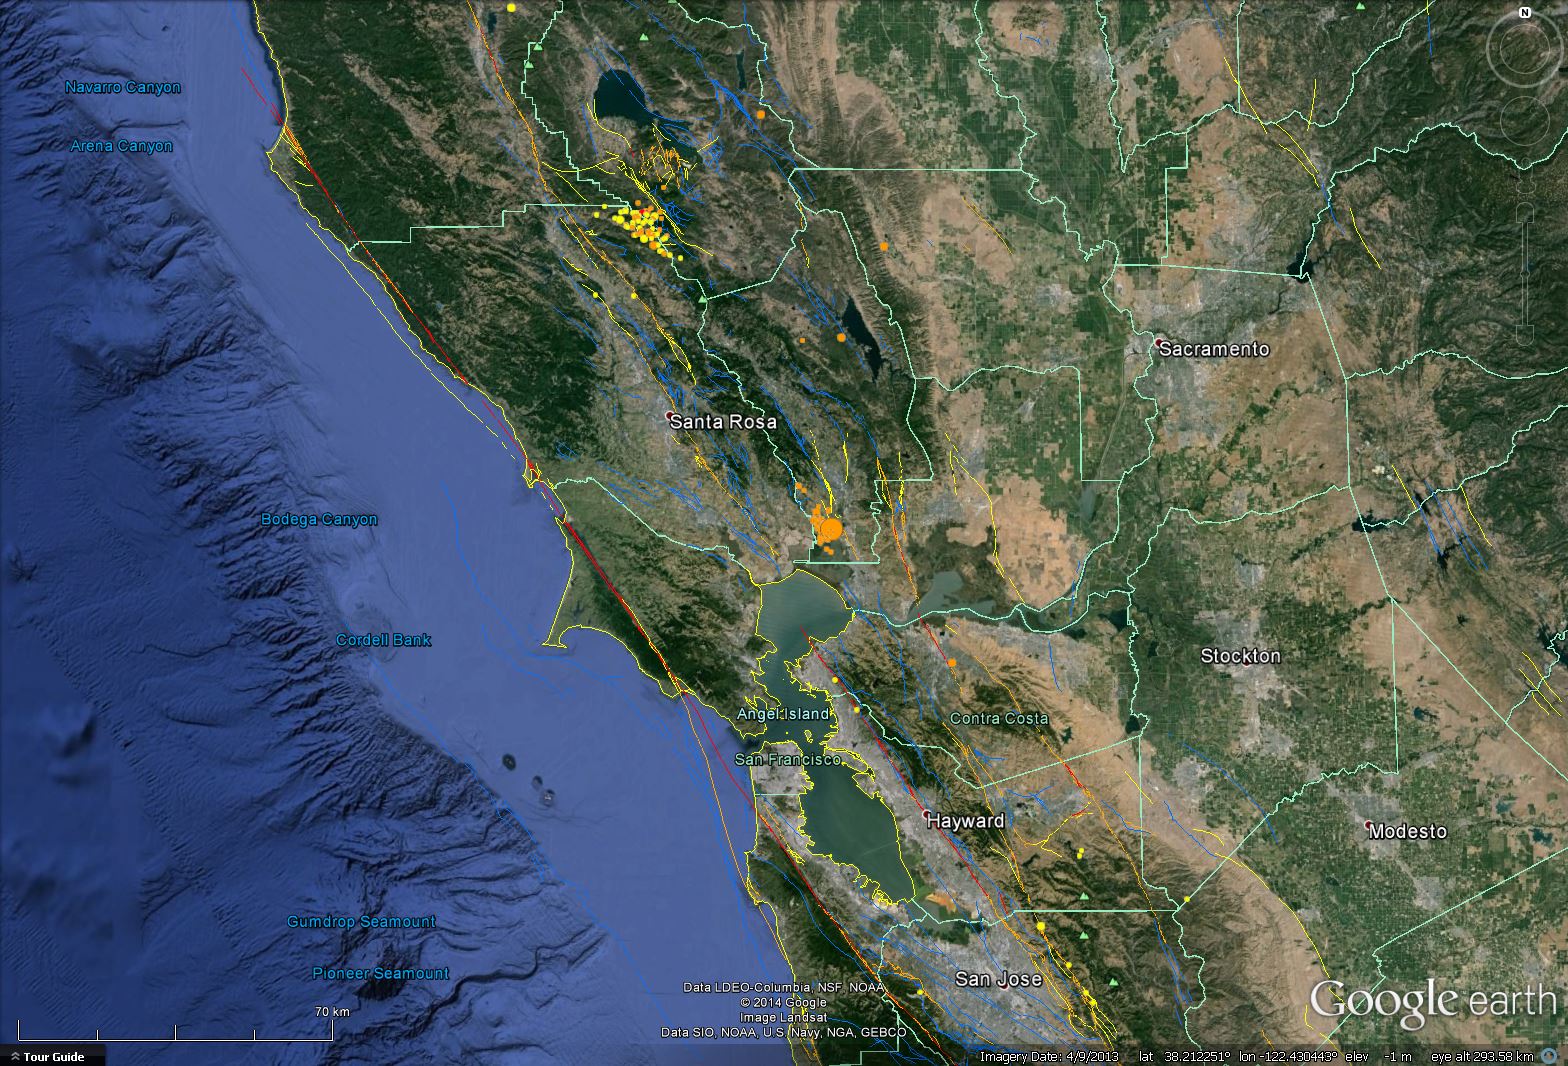
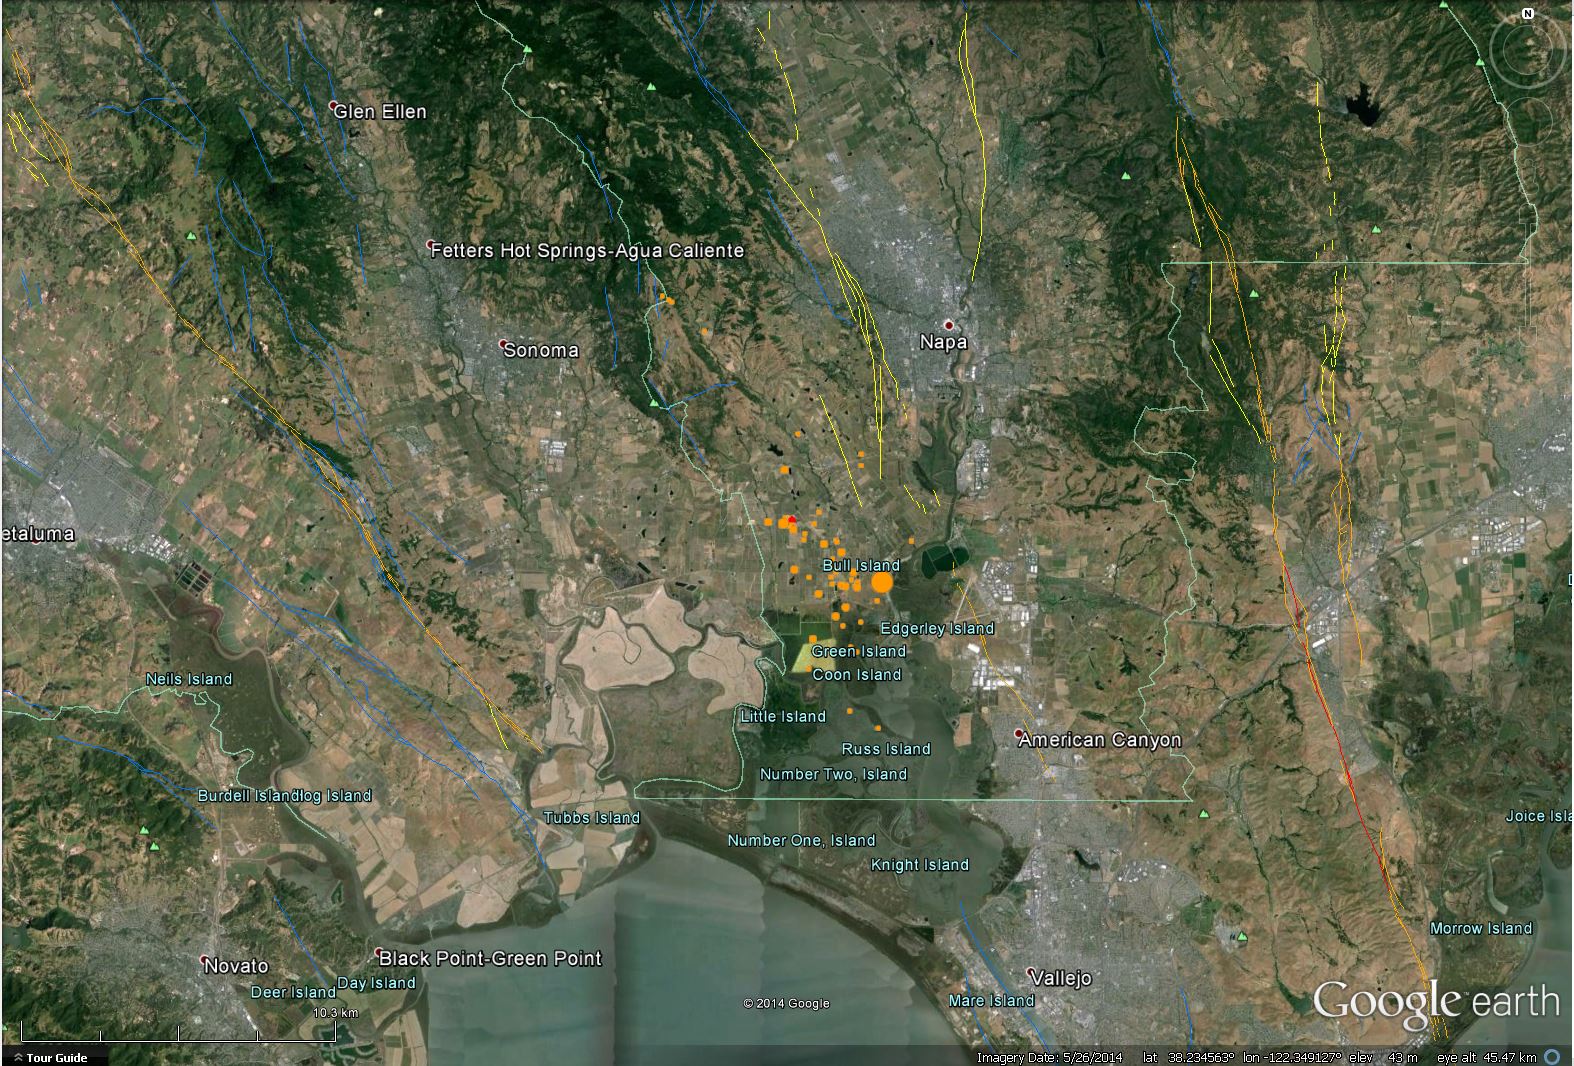
Here is a map showing the faults in the San Francisco bay area. Epicenters from today’s swarm appear in the center of the map as orange dots. The largest dot is the M 6.0 epicenter. There is also a swarm of earthquakes to the northwest, just south of Clear Lake. These are related to the geothermal activity in the Geysers region. Faults are plotted with color representing the relative age of the most recent movement. Younger to older = red, orange, yellow, blue.
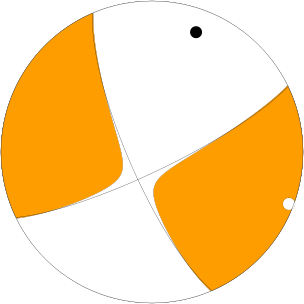
The faults in this region are mostly related to the strike-slip (transform) relative motion along the San Andreas fault system. Faults are sub-parallel to the SAF system and have a similar sense of motion as the SAF (right lateral, or dextral). Here is a moment tensor that shows two possible fault plane interpretations (either northwest striking right lateral or northeast striking left lateral). Given that the SAF is nw striking right lateral, the most reasonable interpretation of this moment tensor is nw striking right lateral.
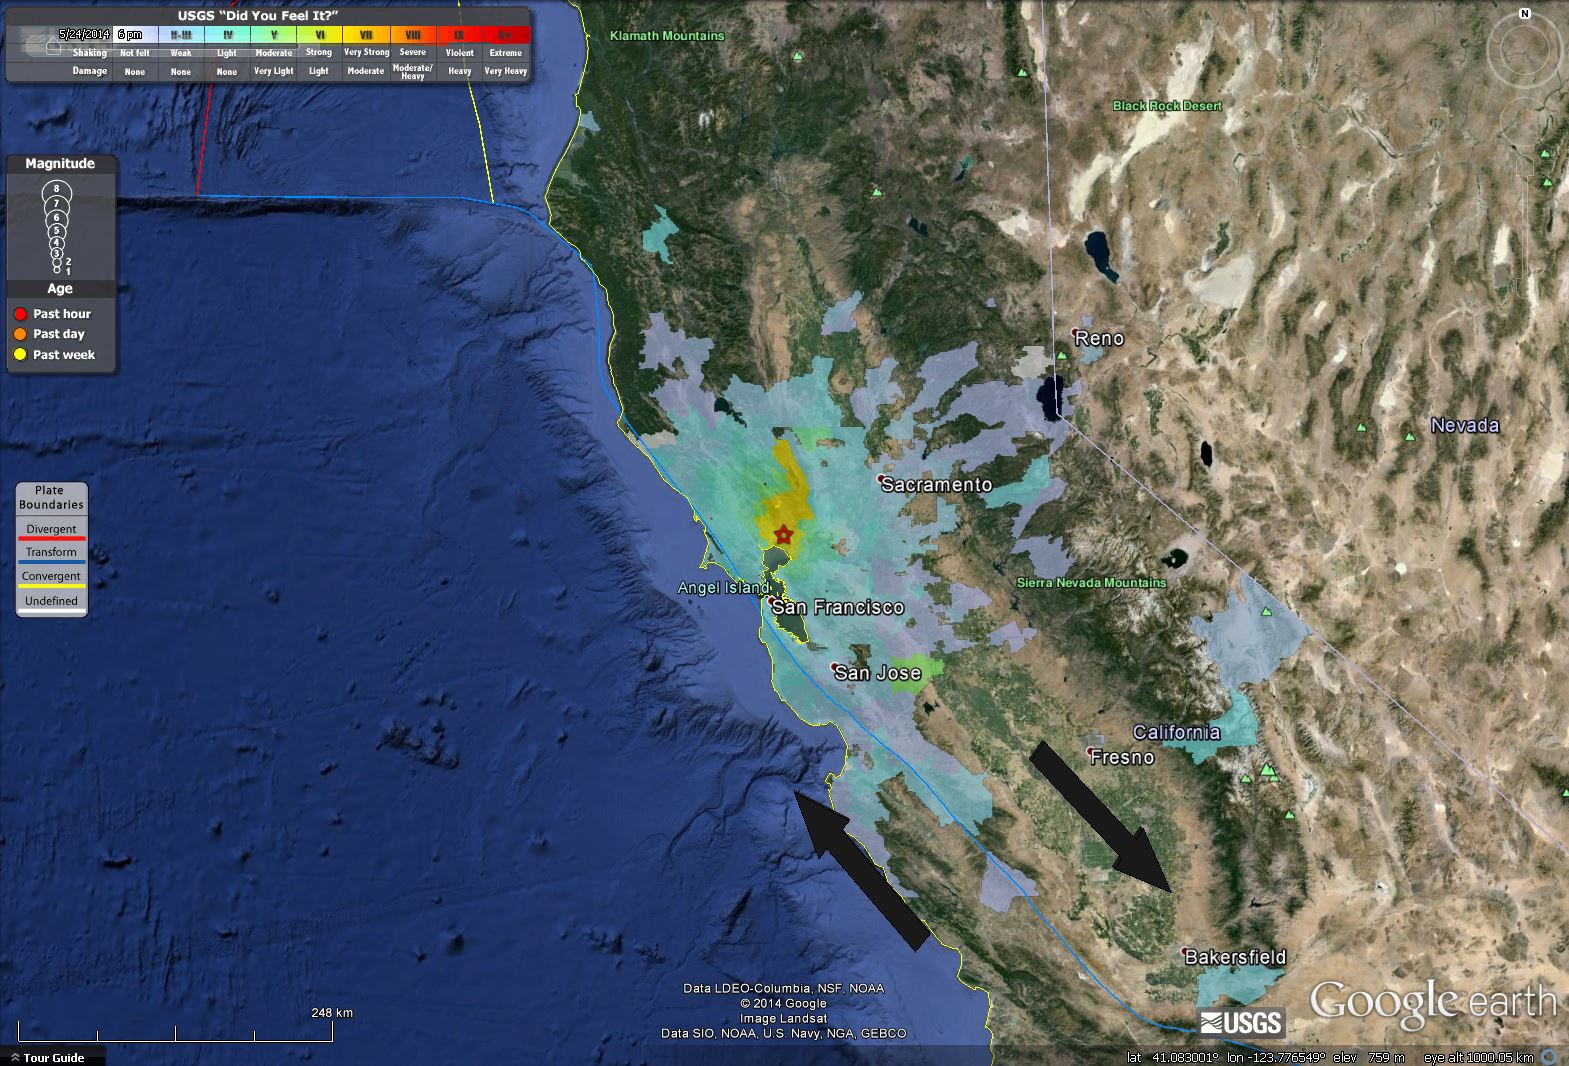
This map shows the results of the USGS “did you feel it?” survey. I hope everyone who felt this earthquake filled out a form. Please do so here if you have not yet done so. The colors represent the Modified Mercalli Intensity Scale (MMI scale; a measure of the shaking intensity based upon observations people make about how strongly the earthquake shook).
This is a map showing an estimate of ground shaking (MMI scale) based upon computer modeling.
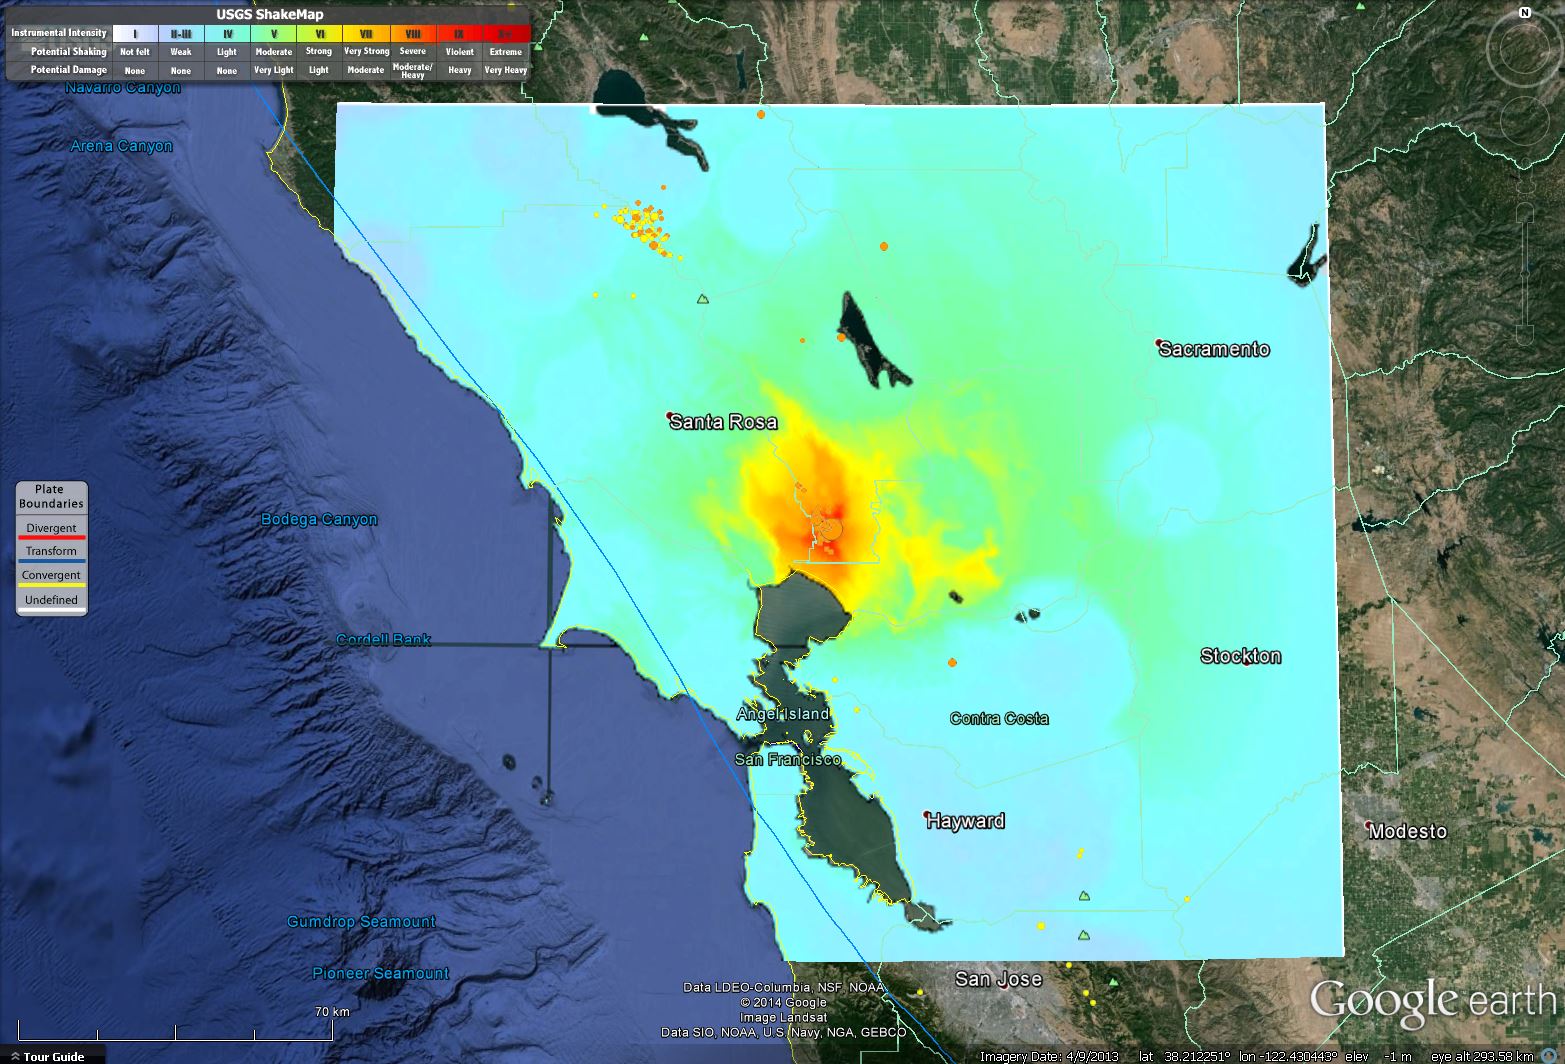
This is a map also showing the simulated intensity as MMI contours.

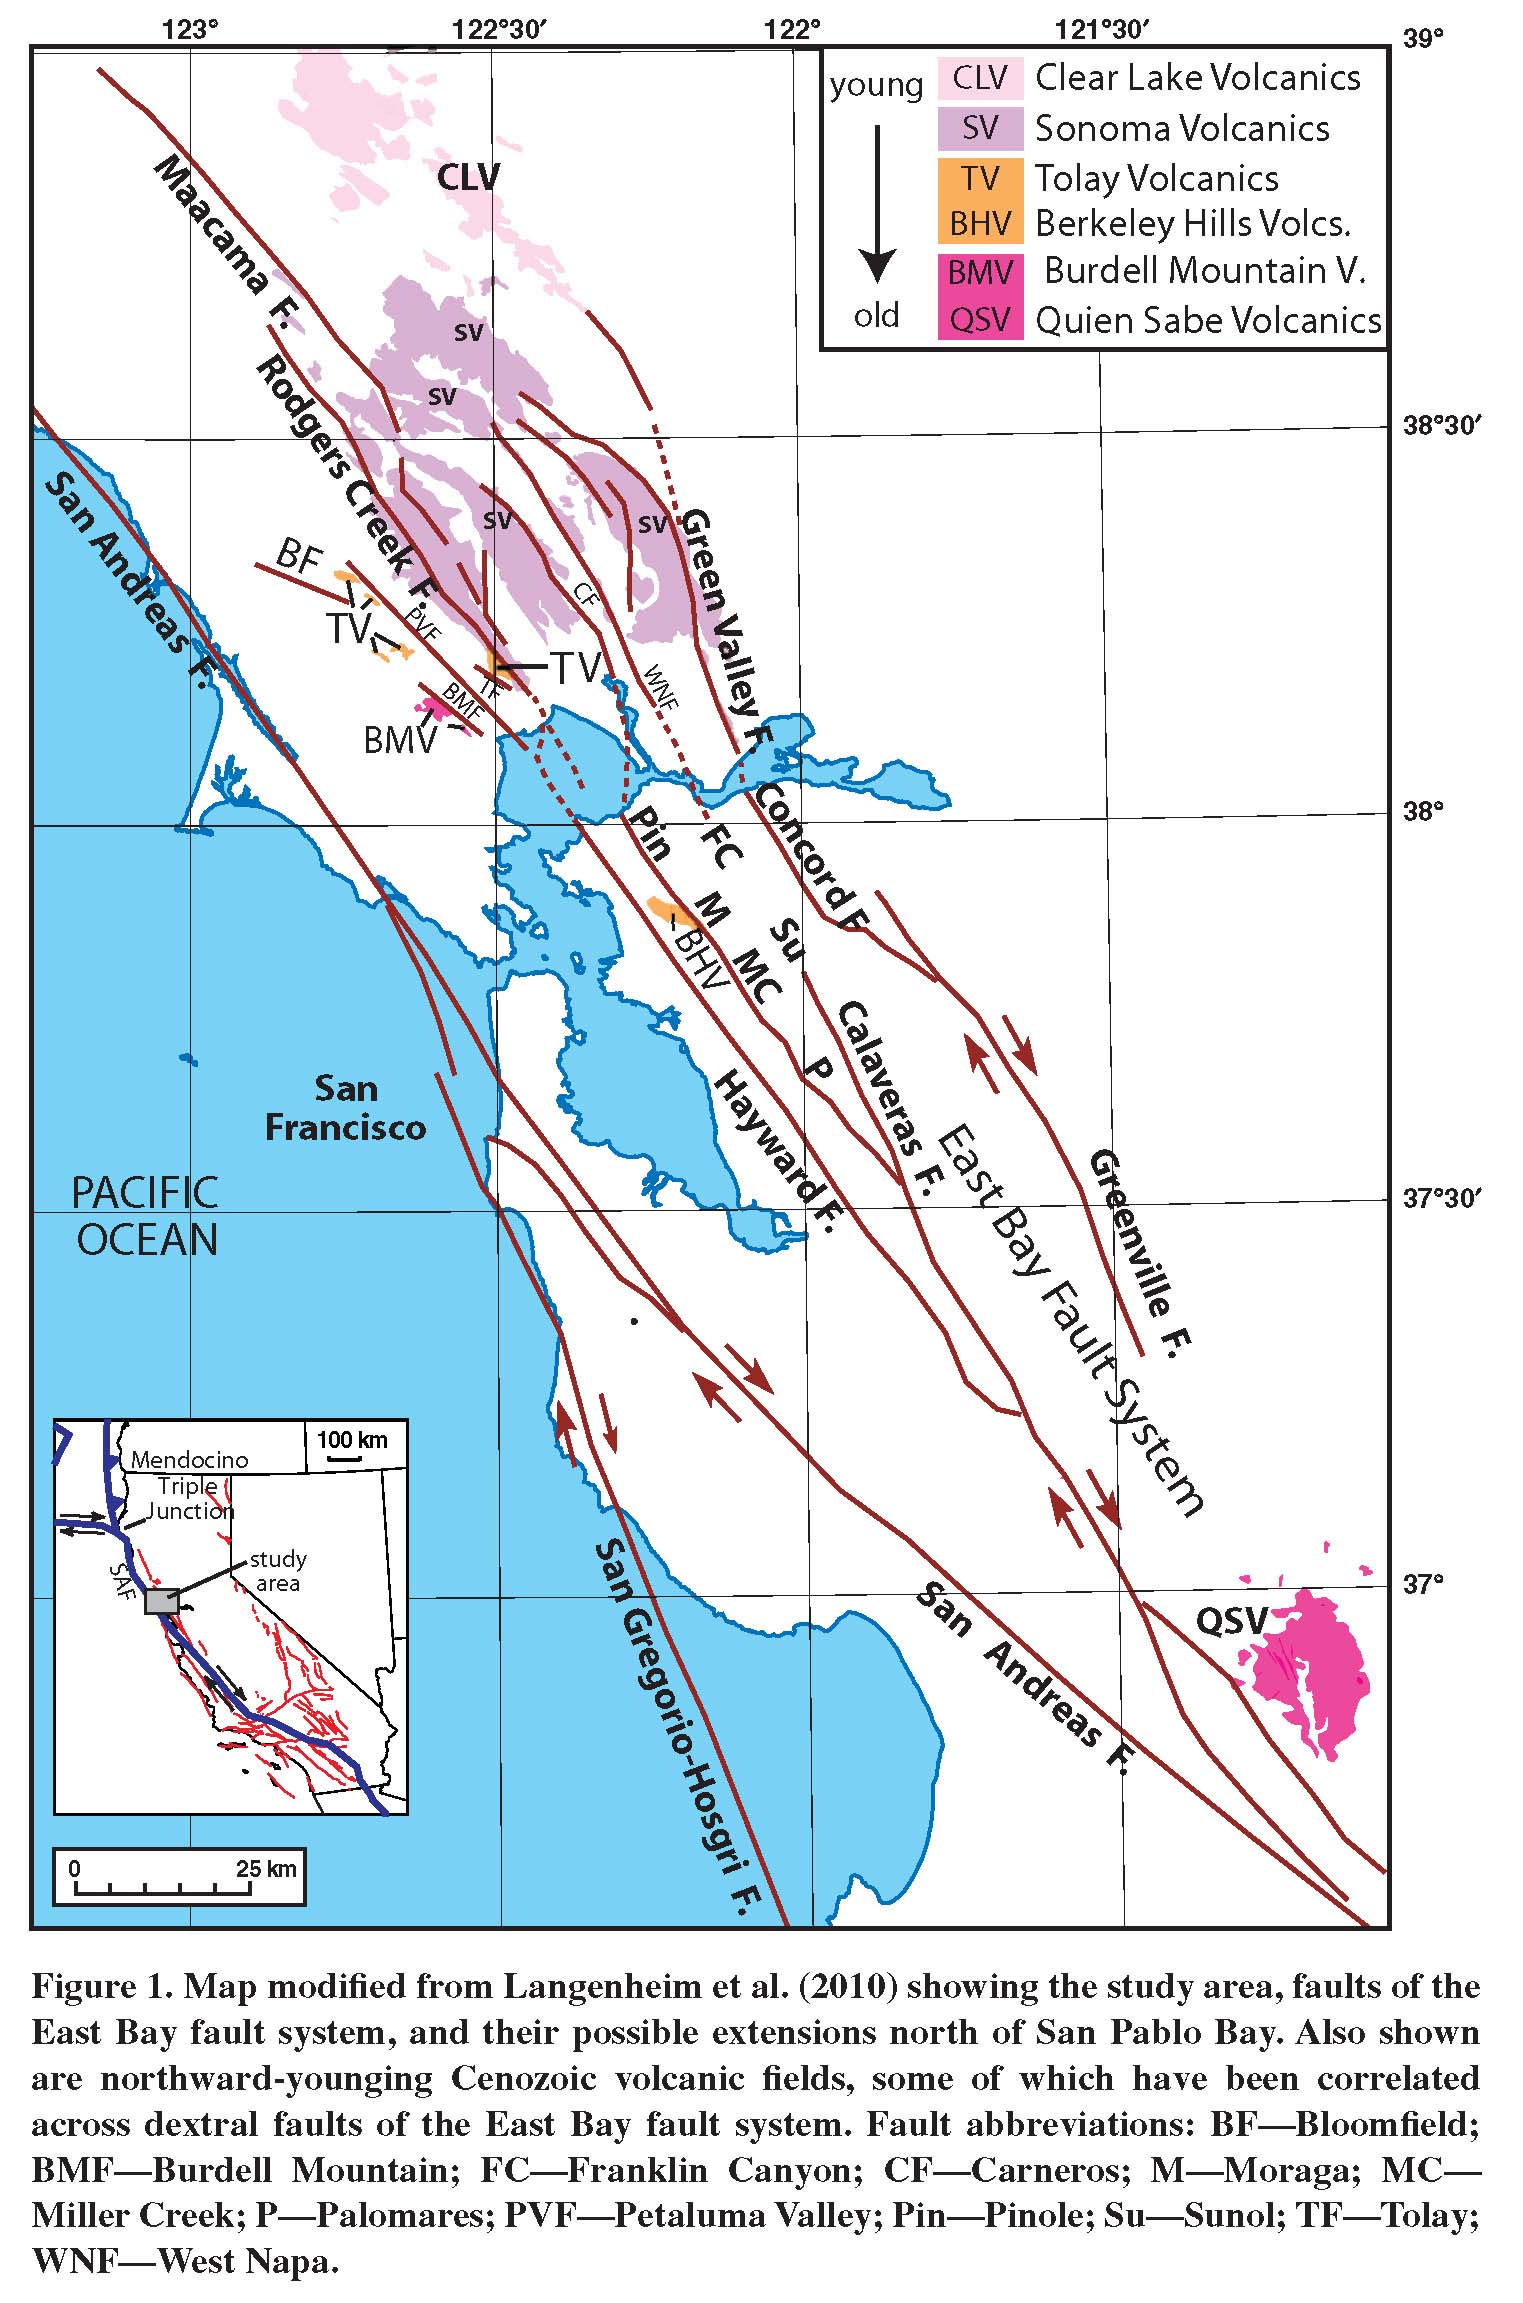
Here is a map showing the regional faulting in the area, along with the Sonoma Volcanics Wagner et al., 2011. These volcanic units represent the passage of the Mendocino triple junction through the bay area (~8-14 millions of years ago). The Carneros and West Napa faults are labeled CF and WNF respectively. There are plate motion arrows along the major faults reminding us that the relative motion of these faults is right lateral.
Here is a map that shows the swarm epicenters as they relate to the local geography. Napa Valley is to the north. The Carneros fault is not plotted since it is not part of the USGS fault and fold database (Dr. Rich Koehler reminded me that the USGS database is a Quaternary database, so it is probably because the CF has not displaced Quaternary age geologic units). The WNF fault system is mapped as yellow and blue lines along the western boundary of Napa Valley.
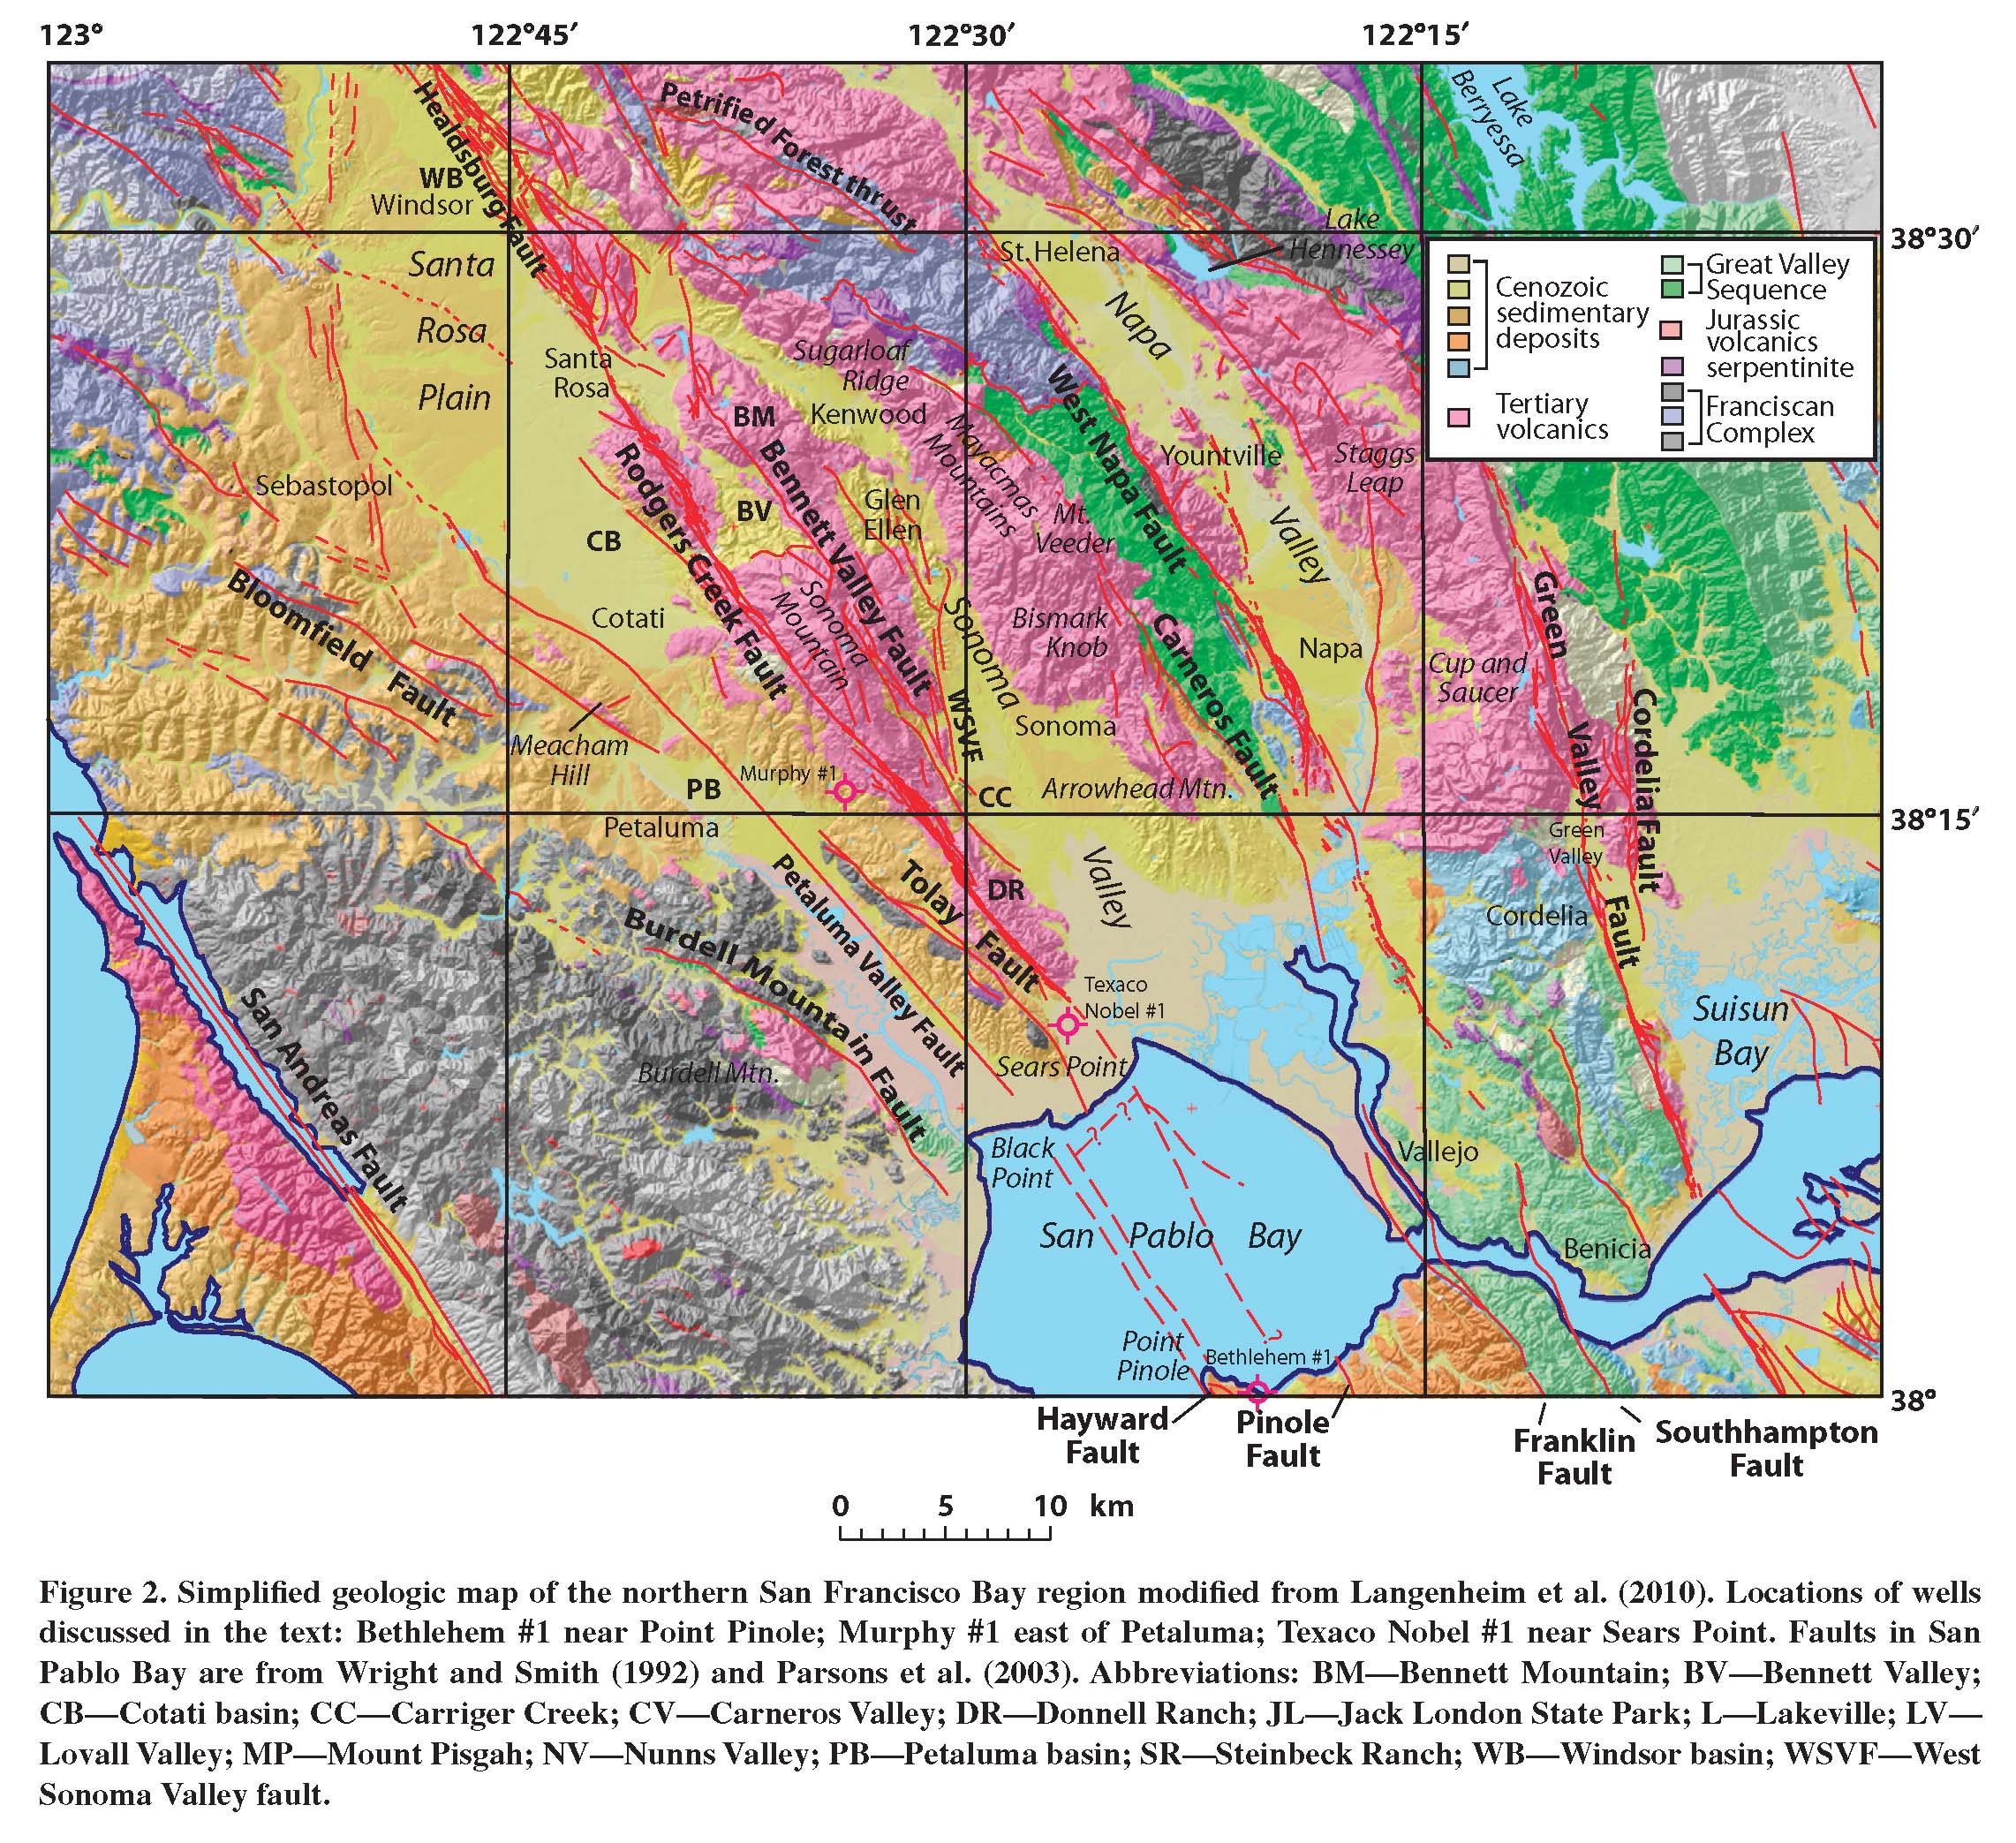
Here is another map from the Wagner et al., 2011 paper. This map shows how the CF and WNF systems relate to each other.Just south of the word “Napa,” the WNF lines stop at the edge of the Tertiary volcanics that are mapped in pink. South of that, the geology is mapped as Cenozoic sedimentary deposits. It is possible that the WNF continues south, but has not been found to displace the geologic units in that area.
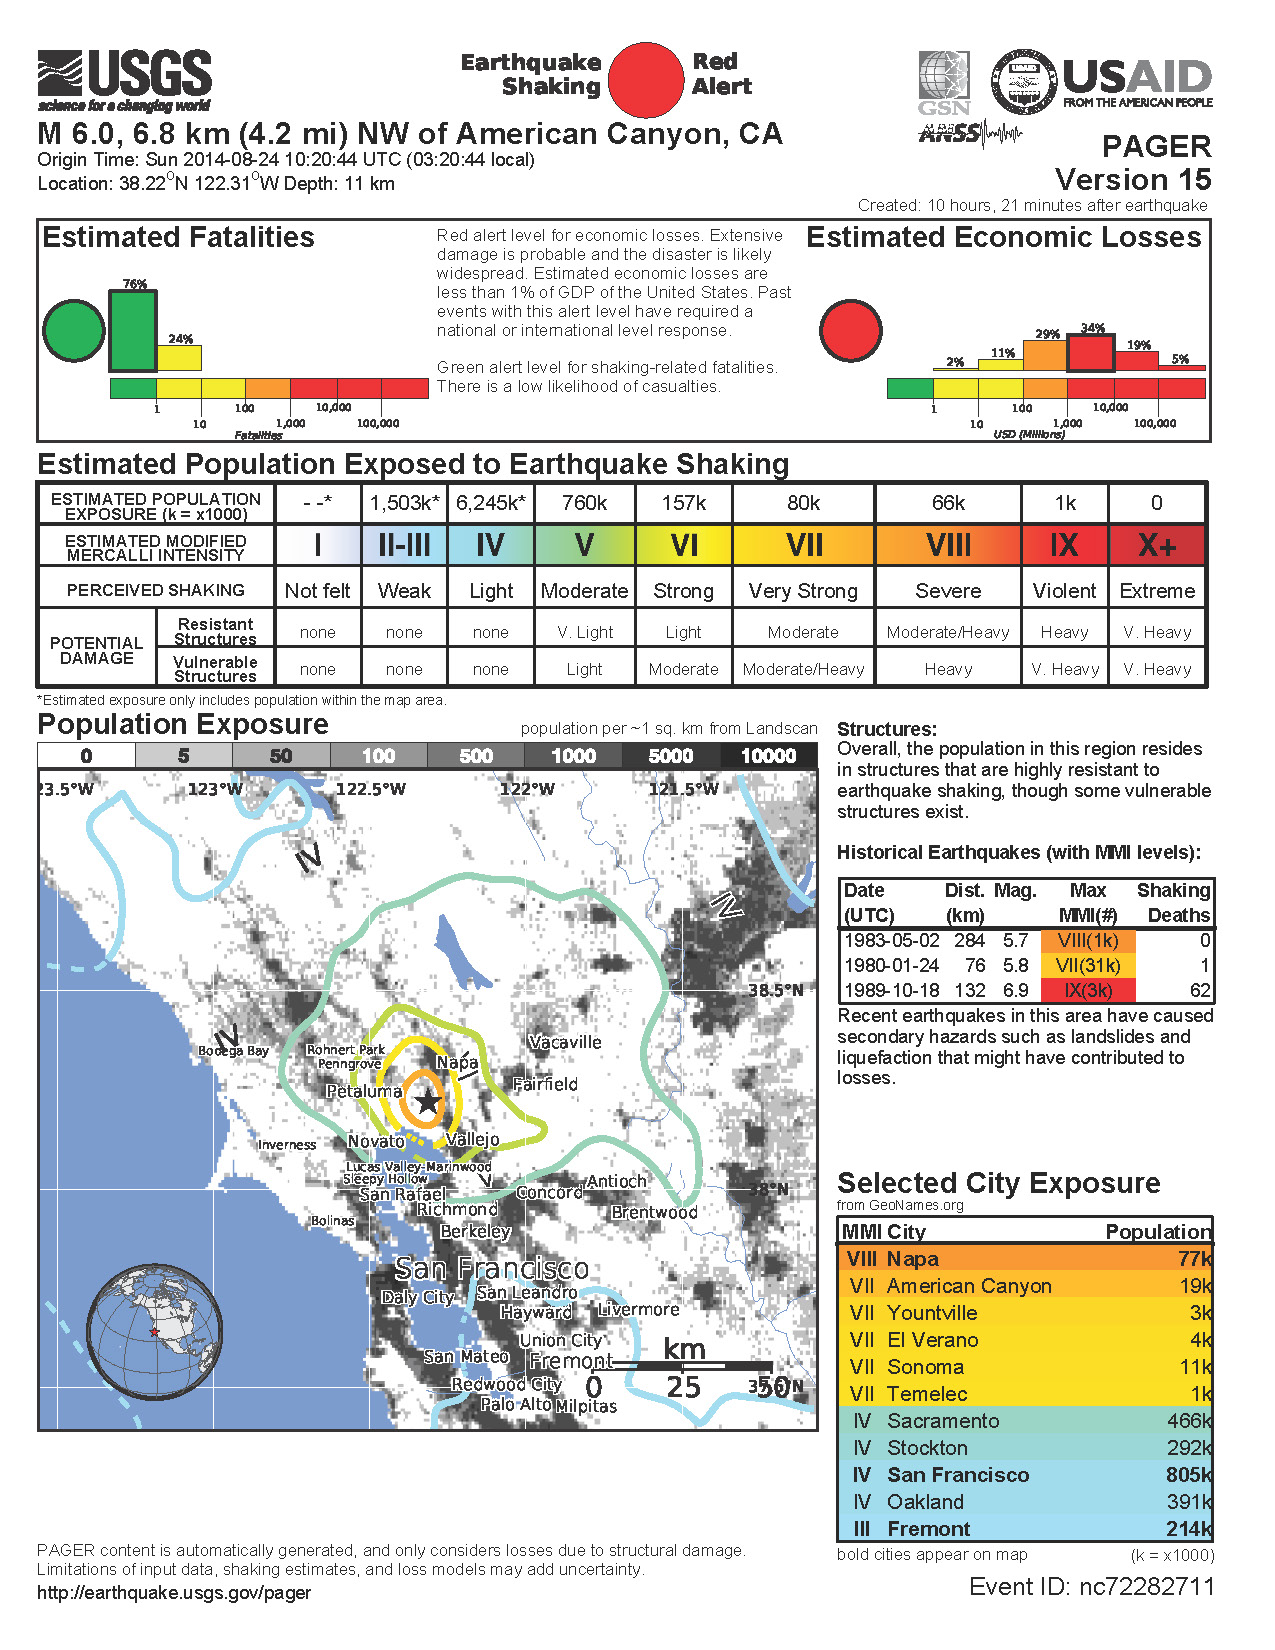
Here is the USGS PAGER page that shows an automated estimate of damage to people and infrastructure. This is useful for govt. agencies who may be responsible to plan evacuations and assistance to internally displaced people.
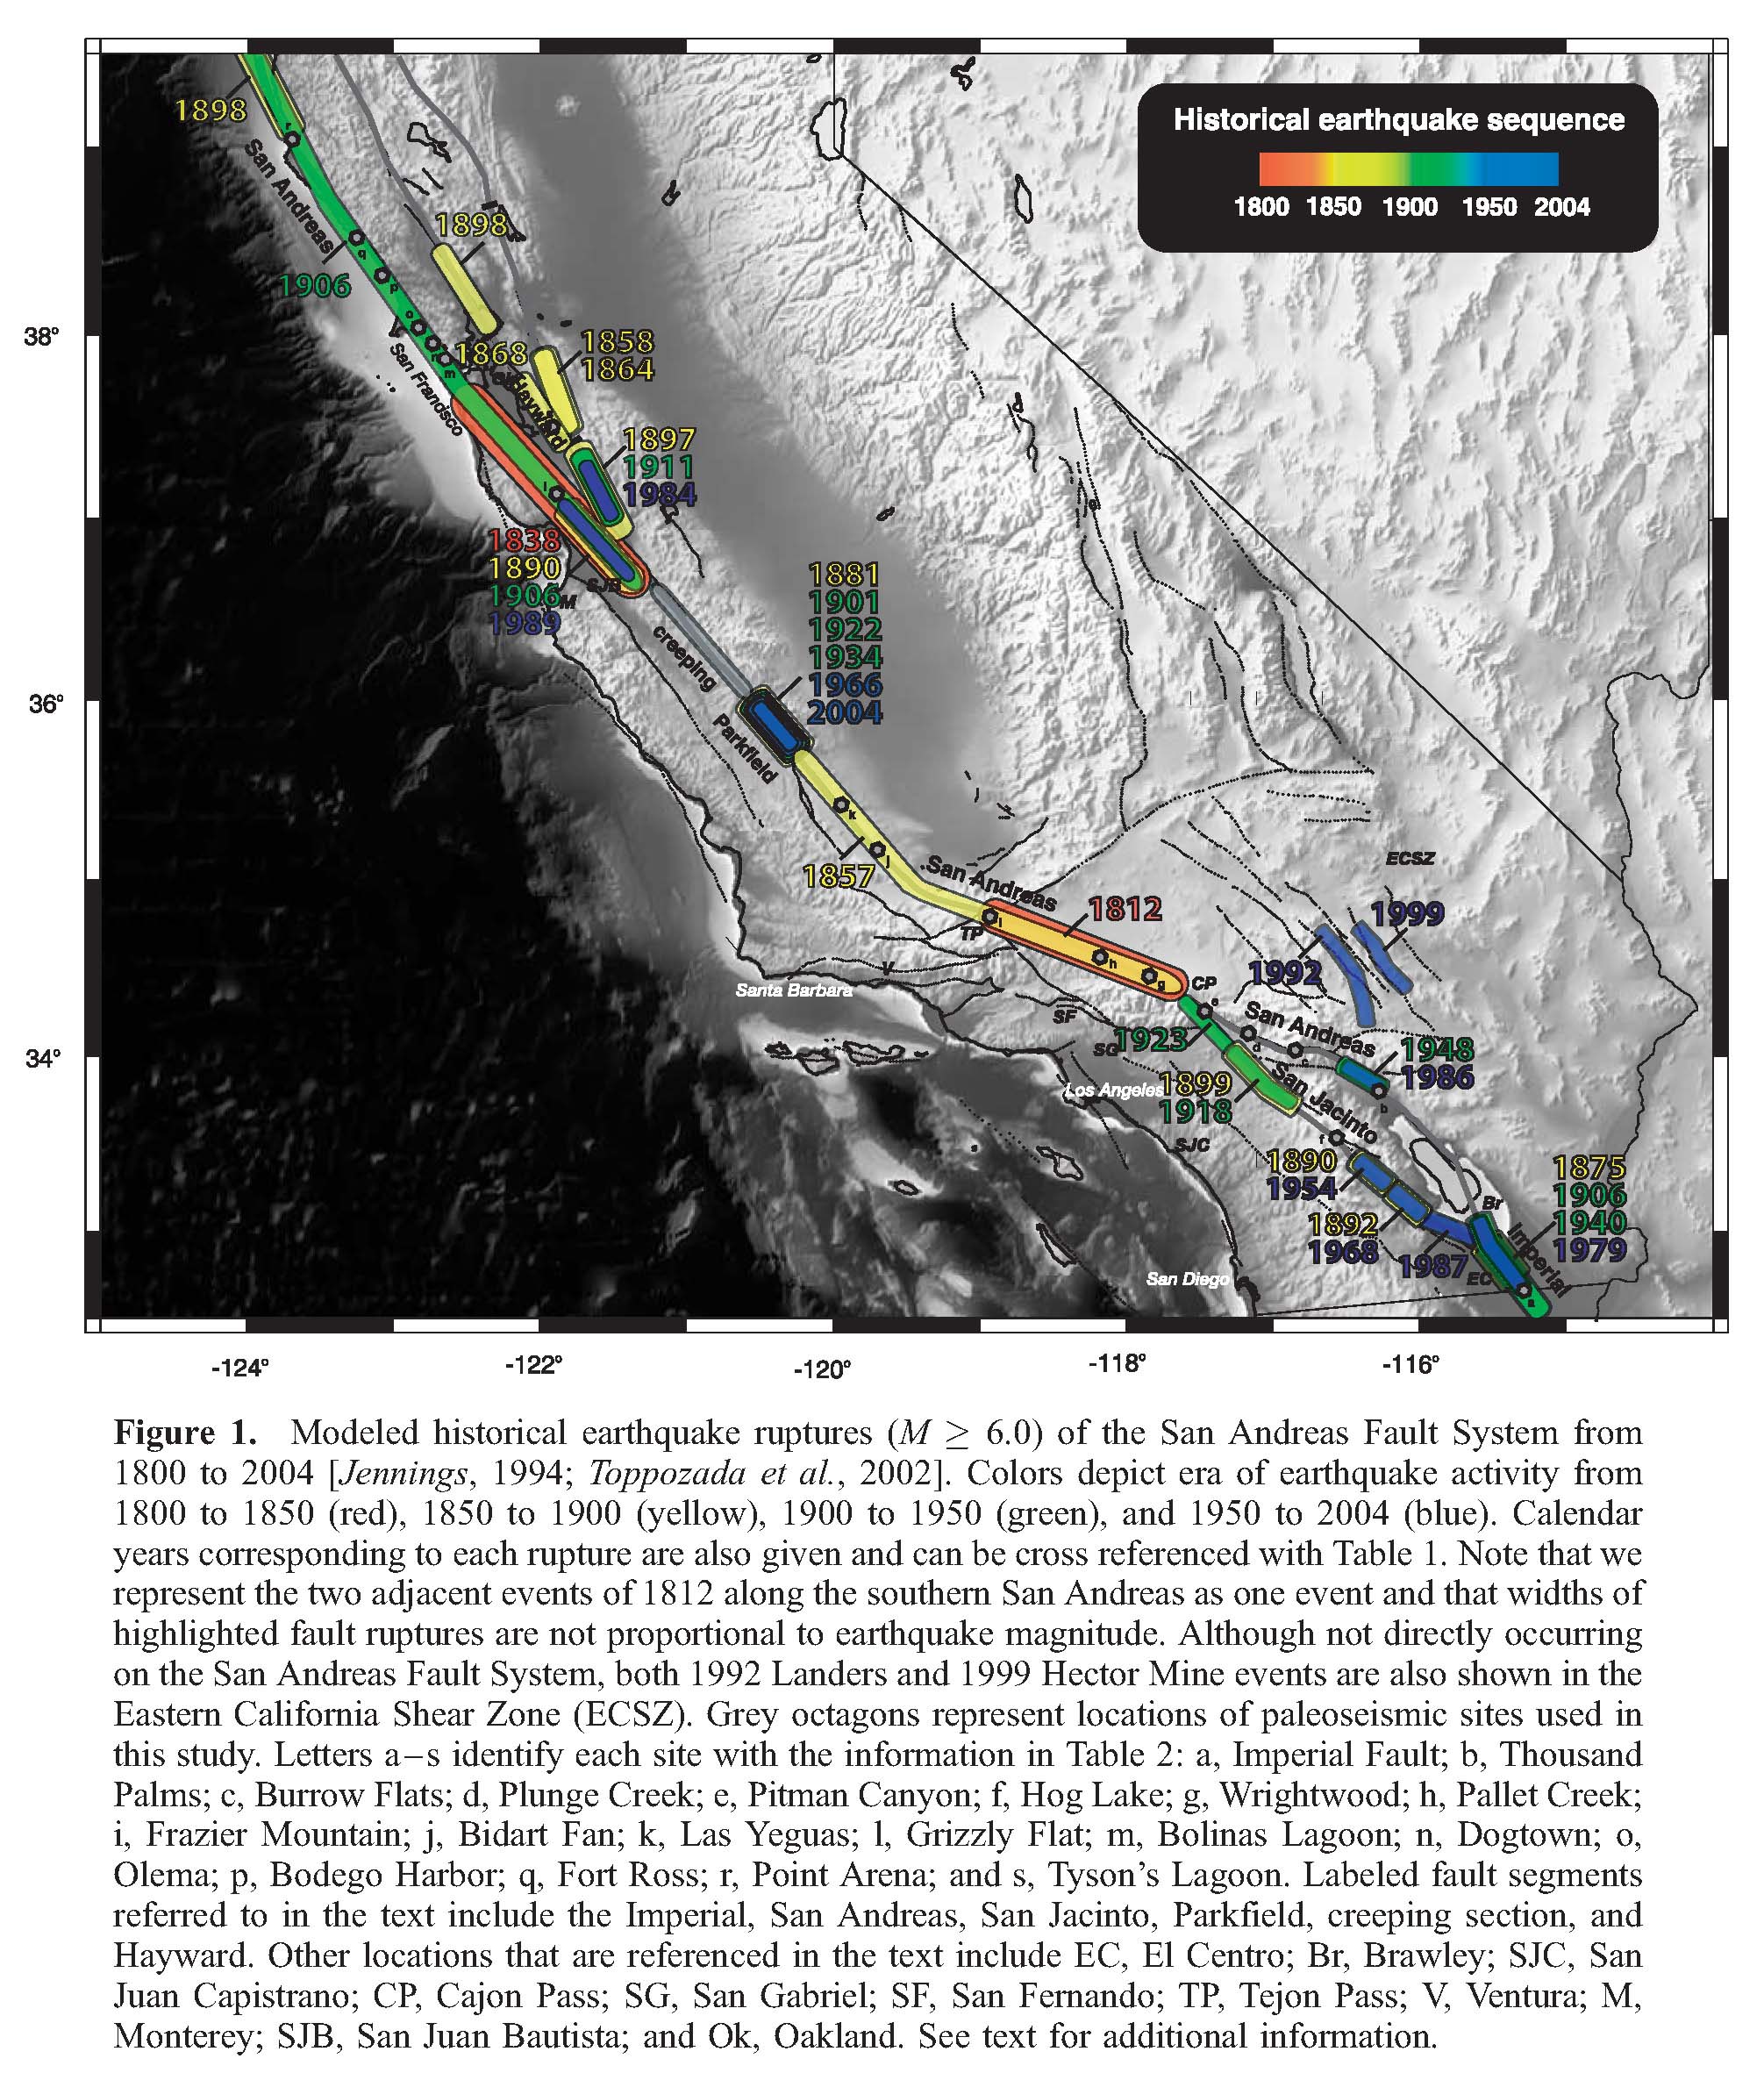
Here is a map that shows the historic ruptures along the SAF and inboard fault systems (Smith and Sandwell, 2006). The GVF shows a rupture in 1858 and 1864. The Rogers Creek/Maacama fault sustem shows a rupture in 1898. The Hayward fault ruptured in 1868.
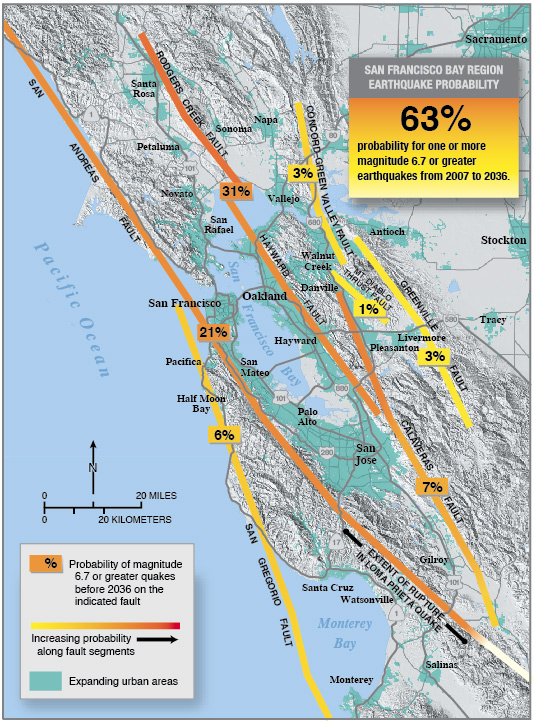
This is a map that shows the earthquake probabilities for the faults in the SF Bay area. This is part of the 2008 Uniform California Earthquake Rupture Forecast (UCERF). Compiled by USGS, Southern California Earthquake Center (SCEC), and the California Geological Survey (CGS), with support from the California Earthquake Authority. Here is a 10 MB high resolution version of the map. Here is a short document that discusses the Hayward fault earthquake of 1868 and what we might expect on the HF in the future.
Here is a photo database of damage from this earthquake.
Here is a summary of observations made by the media.
Here is a photo gallery documenting damage from the earthquake.
Here is a great summary of this earthquake swarm.
Here is a link to a video taken from a drone.
Smith, B. R., and D. T. Sandwell (2006), A model of the earthquake cycle along the San Andreas Fault System for the past
1000 years, J. Geophys. Res., 111, B01405, doi:10.1029/2005JB003703.
Wagner, D. L.; Saucedo, G. J.; Clahan, K. B.; Fleck, R. J.; Langenheim, V. E.; McLaughlin, R. J.; Sarna-Wojcicki, A. M.; Allen, J. R.; Deino, A. L., 2011. Geology, geochronology, and paleogeography of the southern Sonoma volcanic field and adjacent areas, northern San Francisco Bay region, California, Geosphere, 7: 658 – 683
The carneros fault is probably not included in the Quaternary fault and fold database because it has not been demonstrated to offset Quaternary deposits (until now). Maybe it will be added once all the investigations from this earthquake are completed and researchers can unequivocally link it to this fault.
I really like your event summaries!
thanks rick!