New Guinea Earthquake Update #2

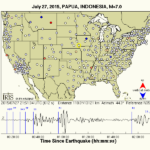
There have been a few more data products produced for this earthquake (that has not had any aftershocks).
IRIS has produced some educational material, called “teaching moments” (or, could be called, learning moments, heheh). However, their data are often poorly developed, using simplified and incorrect maps. For example, take a look at the pdf linked to their page (or the zipped ppt file) and you will see that they use the USGS plate boundaries for this region, which are not correct (a brief literature review shows this to be the case: even though there are still differences between authors of different papers, the USGS fault lines do not agree with any of them). Here is their page.
From the IRIS page, there are links to other data sources. If we rely on IRIS for just the data, they deliver! (in contrast to their teachable moments.)
Below are two animations that show visualizations of seismic waves propagating through the USArray (an array of seismometers, largely paid for my the economic stimulus at the beginning of the Obama administration). I place a screenshot of the animation above each animation.
This first animation shows the vertical (z) motion as recorded by seismometers throughout the continental USA. The seismograph below the map shows the seismic waves as recorded at the seismometer highlighted in yellow on the map.


This second animation shows the three component (Z, N-S, E-W) motion as recorded by seismometers throughout the continental USA. The seismograph below the map shows the seismic waves as recorded at the seismometer highlighted in yellow on the map.


Here is a photo of the seismograph from the Humboldt State University, Dept. of Geology, Benioff Seismometer (via their facebook page). The New Guinea M = 7.0, the Nevada M = 4.5, and the Alaska M = 6.9 earthquake are all shown.


Here is a screenshot of the seismometer data from the Pacific Northwest Seismic Network, via their facebook page. The New Guinea M = 7.0 and the Alaska M = 6.9 earthquake are both shown.

New Guinea Earthquake Update #1

Here is an update on the M = 7.0 New Guinea earthquake. Here is my first post about this earthquake.
As I mentioned, there has been a flurry of seismic activity along the New Britain and Solomon trenches to the east and earthquakes along the Molucca Strait to the west.
I put together a map that shows the moment tensor for this earthquake, which shows a west-northwest striking thrust/reverse earthquake fault plane solution. There is a subduction zone to the north of this island and several large E-W striking fault systems that cross the island. Some of these fault systems are mapped as fold-and-thrust belts (compression) and some fault systems are strike-slip systems (shear). The moment tensor is not parallel to these mapped fault systems (at the global scale), so the local scale of the faults is probably a little more complicated.


Here is a map that shows these fault systems and plate boundaries of the region. I cannot tell who’s map this is, but here is the link from where I got it.


I posted about the tectonics of this region during some earthquakes from 2014/12/06. For that post, I found a generalized tectonic map of the region from Baldwin et al. (2012).


Here is a great series of cross sections through the island, with a map to show where the cross sections are located (North is to the right; Baldwin et al., 2012). Click on the map to see a larger version. Today’s M 7.0 earthquake is located close to cross section E. Along the northern margin of the island is a left-lateral strike slip Sorong fault zone (SFZ). Further to the south are the E-W striking Papuan (east of cross-section E) and Western (west of cross-section E) fold-and-thrust belts (PFTB and WFTB respectively). Today’s M 7.0 earthquake probably occurred on a thrust fault in one of these fold-and-thrust belts.


The USGS has a tectonic summary poster for this region of the world. I included a cross section of the seismicity from this poster on the above map (cross section C-C’ ).
There is a new PAGER alert; the estimated casualties did not change, but the spatial variation in ground shaking estimates changed slightly. Look at the maps to see how the shaking intensity contours are different. This change is common as the first PAGER alert is created automatically from a computer model, while later versions incorporate more data and interpretations and re-calculations from real people.
Here is PAGER version 1:


Here is PAGER version 3:


Seismic Activity Nearby:

    The plate boundaries to the east have continued to be very active in the past few years.

  • 2014.12.06 M 6.8
  • 2015.05.15 M 7.5
  • 2015.03.29 M 7.5
    Here are some pages that show some earthquakes in the Molucca Sea to the west.

  • 2014/11/15 M 7.1
  • 2014/11/21 M 6.5
  • 2014/11/26 M 6.8
  • 2015/03/17 M 6.2
  • 2015/05/20 M 6.8 (also a couple compilation maps)
  • 2015/05/21 M 5.7

Here is a compilation of some of the earthquakes to the east of PNG.


Here is an animation of earthquake epicenters, with color representing depth. The animation begins in January, 1975 and extends through today. If you want to download the video file, here is the link.

New Guinea Earthquake!

Moments ago we had a large magnitude earthquake (M = 7.0) on land in northeastern New Guinea, Indonesia. Here is the USGS website for this earthquake.
Here is a preliminary map that shows estimates of ground shaking intensity based upon a computer generated model. As seismological data are analyzed by real people and “Did You Feel It?” observations are submitted online, these estimates of ground shaking will be improved.


Here is the initial PAGER report, which is an estimate of damage to people and their belongings based upon an overlay of the intensity estimate modeled above with population and infrastructure data. At this point, the probability for casualties is low (though still exists).

    The plate boundaries to the east have continued to be very active in the past few years.

  • 2014.12.06 M 6.8
  • 2015.05.15 M 7.5
  • 2015.03.29 M 7.5

Here is a post where I summarize the seismicity of this New Britain/Solomon region. Here is a map where I show how these subduction zone earthquakes are aligned with the regional strike of the subduction zones.

Small Earthquake near Point Arena!

Today we had a small magnitude, M = 3.5, earthquake near Point Arena. Based upon the location and focal mechanism, I interpret this to have been a north-northwest striking right-lateral (dextral) strike-slip earthquake. The fault that ruptured is likely either the San Andreas fault (SAF), or a nearby synthetic fault. We cannot tell solely based upon the location and focal mechanism, so it is possible that this was a east-northeast striking left lateral fault, conjugate to the SAF (though this seems much less likely). Here is the USGS web page for this earthquake.
Here is a map showing the plate boundary and active faults in this region. I have plotted the focal mechanism, which is a fault plane solution that provides two possible fault orientations. There is a legend on the map for focal mechanisms/moment tensors. Please review these web sites for more information on focal mechanisms (wiki & USGS) and moment tensors (wiki & USGS).


I also plot the Did You Feel It map, that shows the shaking intensity results from real observations. These are based upon reports from real people, who use the USGS online web form to describe their observations from the earthquake (e.g. shaking chandelier, cracks in walls, etc.). In the lower right corner, I show a USGS plot that displays how (1) the DYFI observations show a decay in ground shaking intensity with distance from the earthquake and (2) how the Ground Motion Prediction Equations (attenuation relations) also reflect this decay in ground motions with distance from the earthquake (in km). Note how the model do a reasonable job at fitting the observations.
Here is a map that shows how the SAF crosses the landscape south of Pt. Arena. I found this online here.


This is a map that shows the generalized location of the SAF at the location where the fault leaves land for a marine setting. The fault comes back on land in Shelter Cove. This image comes from a Geological Society of America Field Trip Guidebook. The underlying map is a shaded relief map that is based upon 1 meter resolution LiDAR data (high resolution topographic data).

Fox Islands Earthquake!

Tonight we had a large earthquake along the Aleutian subduction zone. Here is the USGS web page for this M = 6.9 earthquake.
Here is a map that shows some of the large earthquakes in this region from 1996 through 2015. Refer to the moment tensor legend to help interpret the moment tensors for each earthquake. All, but one, are compressional solutions. Note how all the compressional earthquakes have roughly the same strike, oriented relative to the plate convergence vectors (blue arrows). The Aleutian arc may have slip partitioning that results in clockwise rotation of blocks instead of forearc sliver faults. I would have suspected that the strike of the thrust earthquakes would rotate with the strike of the subduction zone (like that occurs at the intersection of the New Britain and Solomon trenches).


Note how the thrust earthquakes are aligned with the subduction zone faults. I have another map that shows more place names for this region.


This map shows today’s earthquakes and some aftershocks (orange and red circles).

Along the Aleutian subduction zone, the Pacific plate subducts beneath the North America plate. Here is a map and cross section showing how the Juan de Fuca plate subducts beneath the North America plate, an analogy to the Aleutian subduction zone.


Here is a map that shows historic earthquake slip regions as pink polygons (Peter Haeussler, USGS). Dr. Haeussler also plotted the magnetic anomalies (grey regions), the arc volcanoes (black diamonds), and the plate motion vectors (mm/yr, NAP vs PP). Today’s M 6.9 earthquake occurred in the eastern part of the 1957 M = 8.6 earthquake region.


I put together some maps and animations for the 2014/06/23 M = 7.9 Rat Islands Earthquake. Here is a map showing the epicenters for the earthquakes from about a month prior to the 7.9 earthquake.


There were some recorded tsunami waves generated by the M = 7.9 earthquake. These were posted online by the NWS NATIONAL TSUNAMI WARNING CENTER PALMER AK
435 PM AKDT MON JUN 23 2014.


Here is a map that shows the seismicity (1960-2014) for this plate boundary. This is the spatial extent for the videos below.


Here are two videos that show animations of the seismicity from 1960 until today.
The first one leaves the epicenters on the screen for the entire animation. Here is a link to the file to save to your computer.


This animation has a moving time window (~1 year), so that 1 year after the earthquake, it is removed from the map. Here is a link to the file to save to your computer.

Further to the east was the 1964/03/27 M 9.2 Good Friday Earthquake. Below is an educational video from the USGS that presents material about subduction zones and the 1964 earthquake and tsunami in particular.
Youtube Source IRIS
WMV file for downloading.
mp4 file for downloading.

Animation & graphics by Jenda Johnson, geologist
Directed by Robert F. Butler, University of Portland
U.S. Geological Survey consultants: Robert C. Witter, Alaska Science Center Peter J. Haeussler, Alaska Science Center
Narrated by Roger Groom, Mount Tabor Middle School
Maps from Google Earth. Video from US Army Corps of Engineers. Tsunami animation from National Oceanic & Atmospheric Administration (NOAA). Photographs from US Geological Survey.
Errata: 1) Fourth Ave., not Fourth St. 2) After 2min48sec the epicenter was shifted N. Should be ESE of that, closer to Prince William Sound. Apologies from animator.

Earthquake near the Santa Cruz Islands (western Pacific)!

We just had an earthquake near the Santa Cruz Islands in the western Pacific Ocean. Here is the USGS web page for this earthquake.
Here is a map that I quickly put together with the moment tensor from the M 7.0 earthquake. I also plot the M 6.7 earthquake from a week ago (here is my page where I discuss that M 6.7 earthquake and the regional tectonics of this region).


There have been some reports of strong ground shaking as evidenced by this “Did You Feel It?” map.


It is interesting that the observations are larger than the modeled estimates of ground shaking:


Here is the pager report that is an estimate of damage to people and their belongings.

Earthquake in the Solomons!

While I was away from the office, we had a M 6.7 earthquake near the Solomon Islands. Here is a link to the USGS website for the M = 6.7 and M = 6.0 earthquakes.
While the epicenter plots near the Solomon trench (a subduction zone), the hypocentral depth does not permit an interpretation that would place this earthquake on the subduction zone. The Woodlark Basin is a region that is extending north-south from oceanic spreading ridges. These spreading ridges are connected by transform plate boundary strike-slip fault systems. The M = 6.7 earthquake appears to have ruptured one of these strike-slip faults.
Here is a map (North is “up” ) that I just put together showing the epicenter from the M 6.7 earthquake, along with its moment tensor. I placed a moment tensor / focal mechanism legend in the upper right corner of the map. There is more material from the USGS web sites about moment tensors and focal mechanisms (the beach ball symbols). There was also a M = 6.0 reverse/thrust earthquake (compressional) in New Britain, along the New Britain trench on 2015.06.30. This entire region is fairly tectonically active, with numerous large magnitude earthquakes in the past two years. I summarize some of these earthquakes below. Both moment tensors and focal mechanisms are solutions to seismologic data that reveal two possible interpretations for fault orientation and sense of motion. One must use other information, like the regional tectonics, to interpret which of the two possibilities is more likely. Based on the orientation of the transform boundaries associated with the Woodlark Basin spreading ridges, I interpret this to be a north striking right lateral earthquake.


Here is a generalized tectonic map of this region (credit IRIS).


The earthquake actually generated a very small short period tsunami. Here is a plot from NOAA. Note that the amplitude of the sea level variation shows a marked increase half way through the time series.


Here is an animation showing the earthquakes from the last 30 days. Here is the link if you want to download the video.


In May of 2015, there was a thrust/reverse fault earthquake to the east of this M 6.7 earthquake. Here is a summary map that I put together with that, along with some other recent earthquakes plotted. The page for the May earthquake is here.


There were also three M = 6.8-6.9 earthquakes further to the south along a transform plate boundary (mapped as a subduction zone by the USGS). Here is a map that shows the location of this May earthquake swarm.

Finally, further to the North, along the New Britain trench, we have had a series of earthquakes since 2000. I plot these in this map and discuss them a little further on this page.


I put together this map to show how the New Britain and Solomon trenches meet. Earthquakes along the New Britain trench have principal stress aligned perpendicular to the New Britain trench and earthquakes along the Solomon trench have principal stresses aligned perpendicular to the Solomon trench due to strain partitioning in the upper plate. I provide more links and explanations about these earthquakes on this page.

Springfield Earthquake!

It took me a couple days to catch up with things, so I missed posting about this earthquake until now.
We had a Mw = 4.2 earthquake northeast of Eugene on the morning of 2015.07.04. Here is the USGS web page for this earthquake. The hypocentral depth is 9.9 km, well above the Cascadia subduction zone fault (which is at approximately 52 km depth in this location, based upon McCrory et al., 2012).
Here is a map that shows the faulting in and around the Willamette River Valley. Eugene and Springfield are in the southern portion of the map and Salem is in the northernmost portion of the map. I rubbersheeted (georeferenced) this map from the Bob Yeats text, Living with Earthquakes in the Pacific Northwest (Yeats, 2004). The entire text from Yeat’s book is online and available as a pdf. There is a Quaternary fault (active in at least the last 2.5 million years) called the Upper Willamette River fault (UWRF) that strikes northwest and aligns sub-parallel to hwy 58 (the orange line in the southeast/lower-right part of the map). The epicenter is plotted as an orange dot. I placed the moment tensor for this earthquake, along with a legend showing how to interpret the moment tensor. There are blue arrows showing a northeast-southwest oriented maximum stress orientation (compression in the direction of the blue arrows). The UWRF points directly at the epicenter, so it may be that the UWRF extends further to the northwest.


This is the “Did You Feel It?” map that uses the Modified Mercalli Intensity Scale to display the relative ground shaking across the region. This earthquake was broadly felt. These data are based upon the results from observations made by people as reported to the USGS on this web page.


This plot shows how the ground motions attenuate with distance from the earthquake. The green line (and orange line, which is difficult to see) is based upon empirical models of ground shaking based upon seismologic records from thousands of earthquakes in California. The blue dots are observations from real people and the orange dots are the median observed intensities for different distance bins (with bars that show the uncertainty to +-1 standard deviation). The take away is that the further away from the epicenter, the lower the ground motions. Secondly, that the empirical relations fit the data pretty well, but not perfectly. Note the large variation in ground motions at any given Hypocentral Distance (in km).


Here is a figure from McCaffrey et al. (2007) that shows how the North America plate is possibly chopped up into blocks. Each “block” has a structural affinity to itself (positions within each block move together in a similar direction/orientation that are statistically different than the motions of positions on adjacent blocks). The upper map shows the motions of these positions as they move related to “stable” North America. Each arrow is a vector that show the direction and magnitude of the rate of movement (mm/yr) at that position. The middle panel shows the relative northward motion of these positions at latitudes of 40, 42.5, and 45 degrees north (transects are shown in color on the upper panel/map). The steps in the rates show the boundaries of the blocks as modeled by McCaffrey et al. (2007). The lowest panel shows a schematic of these blocks as they relate to each other. I am not yet sure how the UWRF fits into this block model, but it is a part of the tectonics in this region.

Andaman Sea Earthquake!

Today we had a small earthquake in the Andaman Sea, west of Thailand and east of the Andaman Isles (India).
The Andaman Sea is a region of backarc spreading and connects the Sumatra fault (a (strike-slip) sliver fault that accommodates oblique motion on the Sunda subduction zone offshore of Sumatra and the Andaman/Nicobar Islands), with the strike-slip Sagaing fault in Myanmar/Burma. I have two pages that discuss the historic subduction zone earthquakes along the Sunda subduction zone. The first page covers the 2004 earthquake in general. The second page discusses various measures of energy released during the 2004 earthquake.

    Here are the USGS web pages for the earthquakes displayed on the map below.

  • 1971.03.28 M 6.3 (not labeled on map, but very near to the M 5.8 from 2015)
  • 2004.12.26 M 7.2
  • 2005.07.24 M 7.2
  • 2008.06.27 M 6.6
  • 2009.08.10 M 7.5
  • 2010.06.12 M 7.5
  • 2015.07.03 M 5.8

Below is a map of the region. The M 5.8 did not have a moment tensor nor focal mechanism calculated, but I placed a generic strike-slip focal mechanism in an orientation that aligns with transform plate boundary that likely ruptured during this earthquake. The M 5.8 epicenter is depicted by a red and black star. I pose that this was a right-lateral strike slip earthquake along a transform plate boundary (shown in blue). Note that I have also added updated fault locations in this area, based upon seismicity (the USGS located plate boundaries are not quite correct; mine are imperfect too, but are consistent with the seismicity). The USGS fault lines have a stepped appearance and the ones that I drew look more smooth.
I placed moment tensors for some of the largest earthquakes in this region. The 2009 and 2008 earthquakes in the northwest are extensional, so are probably in the downgoing India plate (extension from bending of the plate or slab pull). The 2010 and 2005 earthquakes in the southwest are strike-slip and may be due to the oblique subduction (strain partitioning). There is a legend that shows how moment tensors can be interpreted. Moment tensors are graphical solutions of seismic data that show two possible fault plane solutions. One must use local tectonics, along with other data, to be able to interpret which of the two possible solutions is correct. The legend shows how these two solutions are oriented for each example (Normal/Extensional, Thrust/Compressional, and Strike-Slip/Shear). There is more about moment tensors and focal mechanisms at the USGS.


Here is a graphic that depicts how a sliver fault accommodates the strain partitioning from oblique subduction.


This is a general plate tectonic map of the region from Subarya et al. (2006). The Sumatra fault is the right-lateral strike-slip fault that rips through the center of the Island of Sumatra. The Sagaing fault is the right-lateral strike-slip fault extending into Myanmar/Burma north of the Andaman Sea. The purple arrows show the plate motion related to the oceanic spreading ridges in the Andaman Sea.


This map shows how the Sunda subduction zone and Sagaing fault extend into Asia (Wang et al., 2012). This figure was later modified and included in Wang et al. (2014). Click on the map to see it at a larger scale.


Here is a figure from Wang et al. (2014) that incorporates both the preceding maps. Below is the text that goes along with this figure (from the original Wang document). Click on the map to see it at a larger scale.

Major tectonic elements of the Myanmar region and the extreme variation in rainfall that influence the preservation of tectonic landforms. (a) Crustal thickness associated with the major plates and tectonic blocks of the region. The blue arrow shows the direction of Indian plate motion relative to Sunda plate [e.g., Socquet et al., 2006]. The black arrow shows the opening direction of the Central Andaman spreading center. The velocity is in mm/yr. (b) Two major fault systems accommodate the northward translation of the Indian plate into Eurasia. These are the northern extension of the Sunda megathrust and the Sagaing fault system, which form the western and eastern margin of the Burma Plate. Conjugate right- and left-lateral faults of the Shan plateau and southern China accommodate southwestward extrusion of the Sichuan-Yunnan block around the eastern Himalayan syntaxis. (c) Extreme variations in annual rainfall across the region result in extreme variations in preservation of tectonic landforms. The precipitation data are from GPCC global data [Rudolf and Schneider, 2005].


Here is an animation showing seismicity in this region from 1970 through July 3, 2015. The largest earthquakes (magnitude greater than 6.0) are plotted as grey circles. Note how there is a large increase in seismicity associated with the 2004 Sumatra Andaman subduction zone earthquake. There is also a swarm of activity associated with the outer rise earthquakes (the largest strike-slip earthquakes ever recorded on a seismograph).

    References:

  • Rudolf, B., and U. Schneider, 2005. Calculation of gridded precipitation data for the global land-surface using in-situ gauge observations,
    paper presented at Proceedings of the 2nd Workshop of the International Precipitation Working Group IPWG.
  • Subarya, C., Chlieh, M., Prawirodirdjo, L., Avouac, J., Bock, Y., Sieh, K., Meltzner, A.J., Natawidjaja, D.H., McCaffrey, R., 2006. Plate-boundary deformation associated with the great Sumatra–Andaman earthquake: Nature, v. 440, p. 46-51.
  • Socquet, A., C. Vigny, N. Chamot-Rooke, W. Simons, C. Rangin, and B. Ambrosius (2006), India and Sunda plates motion and deformation along their boundary in Myanmar determined by GPS, J. Geophys. Res., 111, B05406, doi:10.1029/2005JB003877.
  • Wang, Y., K. Sieh, S. T. Tun, K.-Y. Lai, and T. Myint, 2014. Active tectonics and earthquake potential of the Myanmar region, J. Geophys. Res. Solid Earth, 119, 3767–3822, doi:10.1002/2013JB010762.