Today there was an earthquake in a region that we don’t hear about that often. Madagascar is off the coast of southeastern Africa and the oceanic basin to the west is likely formed as part of the East Africa Rift system, but also due to the post Gondwana plate tectonics. Madagascar was once part of India, back when India was part of Gondwana.
Today’s (and of the last few days) earthquakes are located along the Comoros Archipelago, volcanic islands formed from hotspot volcanism.
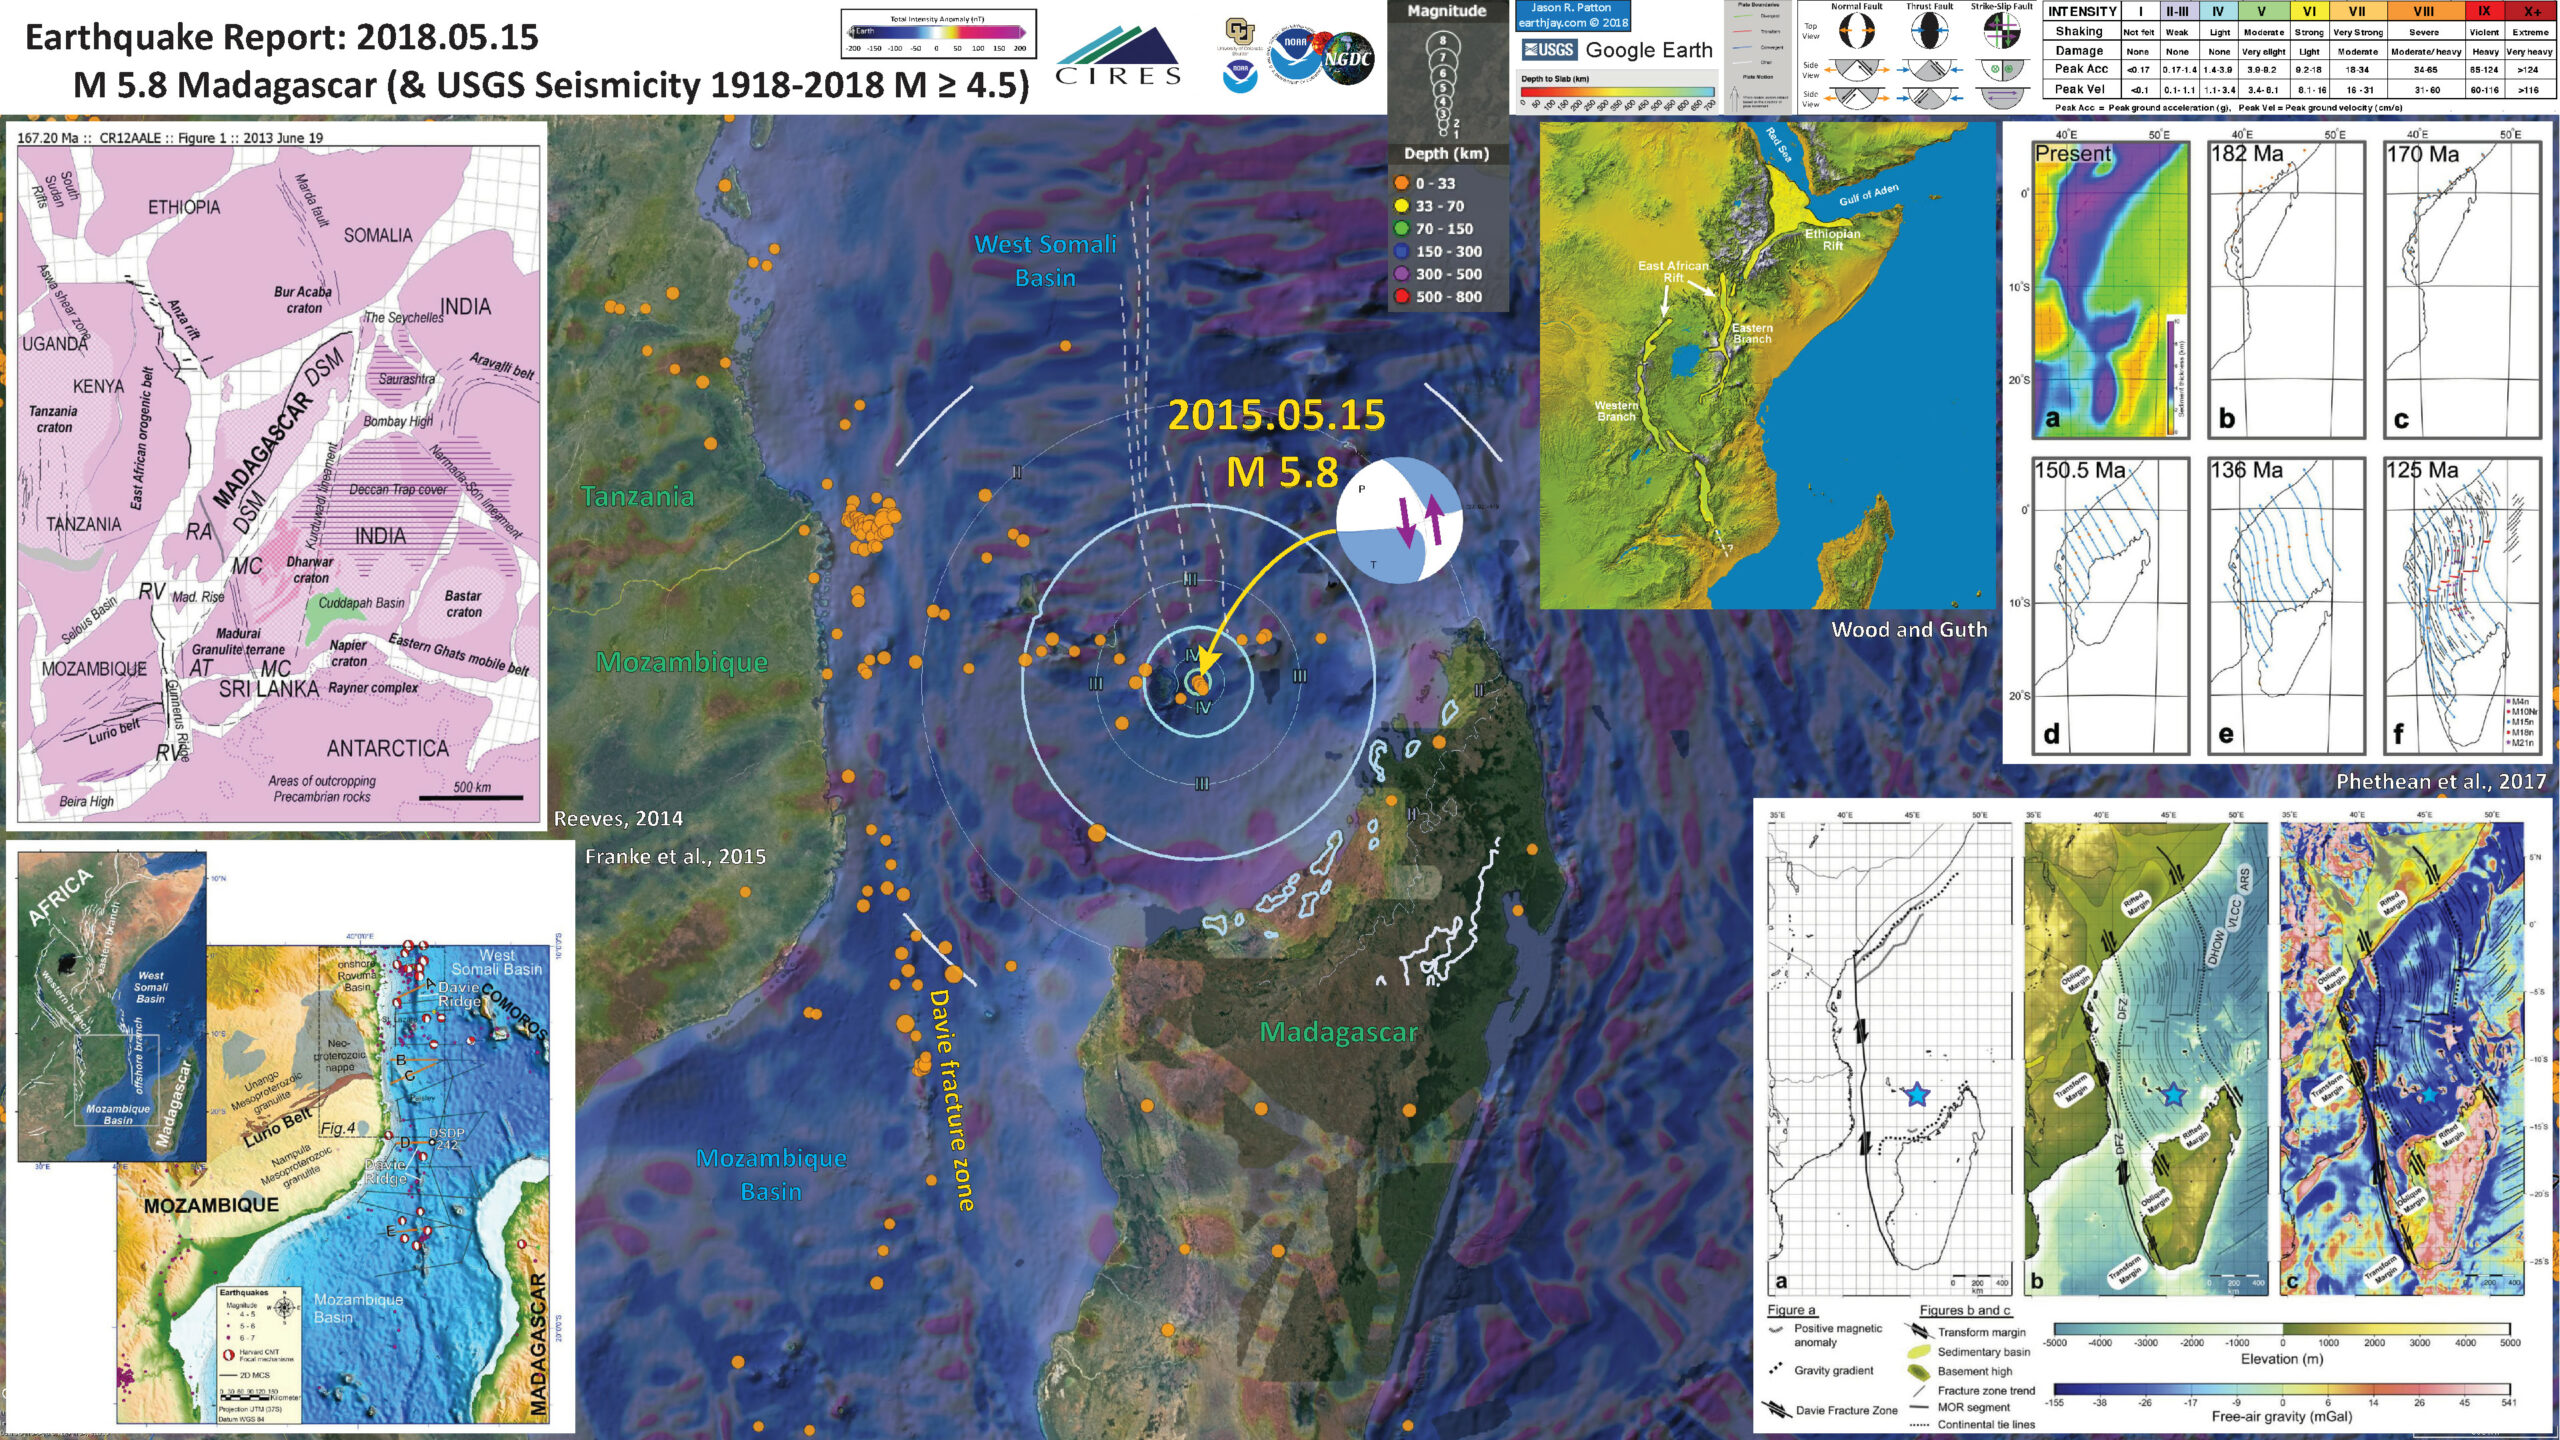
There exist fracture zones in this region. Below, we see that these fracture zones have been interpreted as right-lateral strike-slip faults. However, the relative offsets of magnetic anomalies (and spreading ridges) show that these faults are instead left-lateral. So, that is my interpretation for this M 5.8 earthquake, a left-lateral strike-slip earthquake. I placed white dashed lines in the poster below to show where some of these fracture zones may be located, based upon the magnetic anomaly data (EMAG2).
Below is my interpretive poster for this earthquake
I plot the seismicity from the past month, with color representing depth and diameter representing magnitude (see legend). I include earthquake epicenters from 1918-2018 with magnitudes M ≥ 4.5.
I plot the USGS fault plane solutions (moment tensors in blue and focal mechanisms in orange) for the M 5.8 earthquake.
- I placed a moment tensor / focal mechanism legend on the poster. There is more material from the USGS web sites about moment tensors and focal mechanisms (the beach ball symbols). Both moment tensors and focal mechanisms are solutions to seismologic data that reveal two possible interpretations for fault orientation and sense of motion. One must use other information, like the regional tectonics, to interpret which of the two possibilities is more likely.
- I also include the shaking intensity contours on the map. These use the Modified Mercalli Intensity Scale (MMI; see the legend on the map). This is based upon a computer model estimate of ground motions, different from the “Did You Feel It?” estimate of ground motions that is actually based on real observations. The MMI is a qualitative measure of shaking intensity. More on the MMI scale can be found here and here. This is based upon a computer model estimate of ground motions, different from the “Did You Feel It?” estimate of ground motions that is actually based on real observations.
-
I include some inset figures.
- In the upper center right is a figure from James Wood and Alex Guth, showing the rift systems in eastern Africa.
- In the upper left corner is a figure showing the estimated (reconstructed) location of Madagascar within Gondwana (Reeves, 2014).
- In the lower left corner is a map that shows the East Africa Rift system, along with the offshore branch (associated with the Davie fracture zone). The M 5.8 earthquake is just to the east of the larger scale map (Franke et al., 2015).
- In the upper right corner is a figure that shows a reconstruction of the position of Madagascar (Phethean et al., 2017). The blue lines are pathway lines showing how Madagascar moved away from Africa. Spreading ridges are shown in red. The offsets of the spreading ridges show left lateral strike slip offsets of these ridges.
- In the lower right corner is a map that shows the free-air gravity data that Phethean et al. (2017) used to make their reconstruction. Note that they interpret these faults as right lateral strike-slip. This interpretation is in contrast to the relative offsets of the oceanic spreading ridges. I placed a blue star in the general location of today’s M 5.8 earthquake.

USGS Earthquake Pages
- 2018.05.15 M 5.8 Comoros
These are from this current sequence
Some Relevant Discussion and Figures
- Here is the plate reconstruction figure from Phethean et al. (2017).
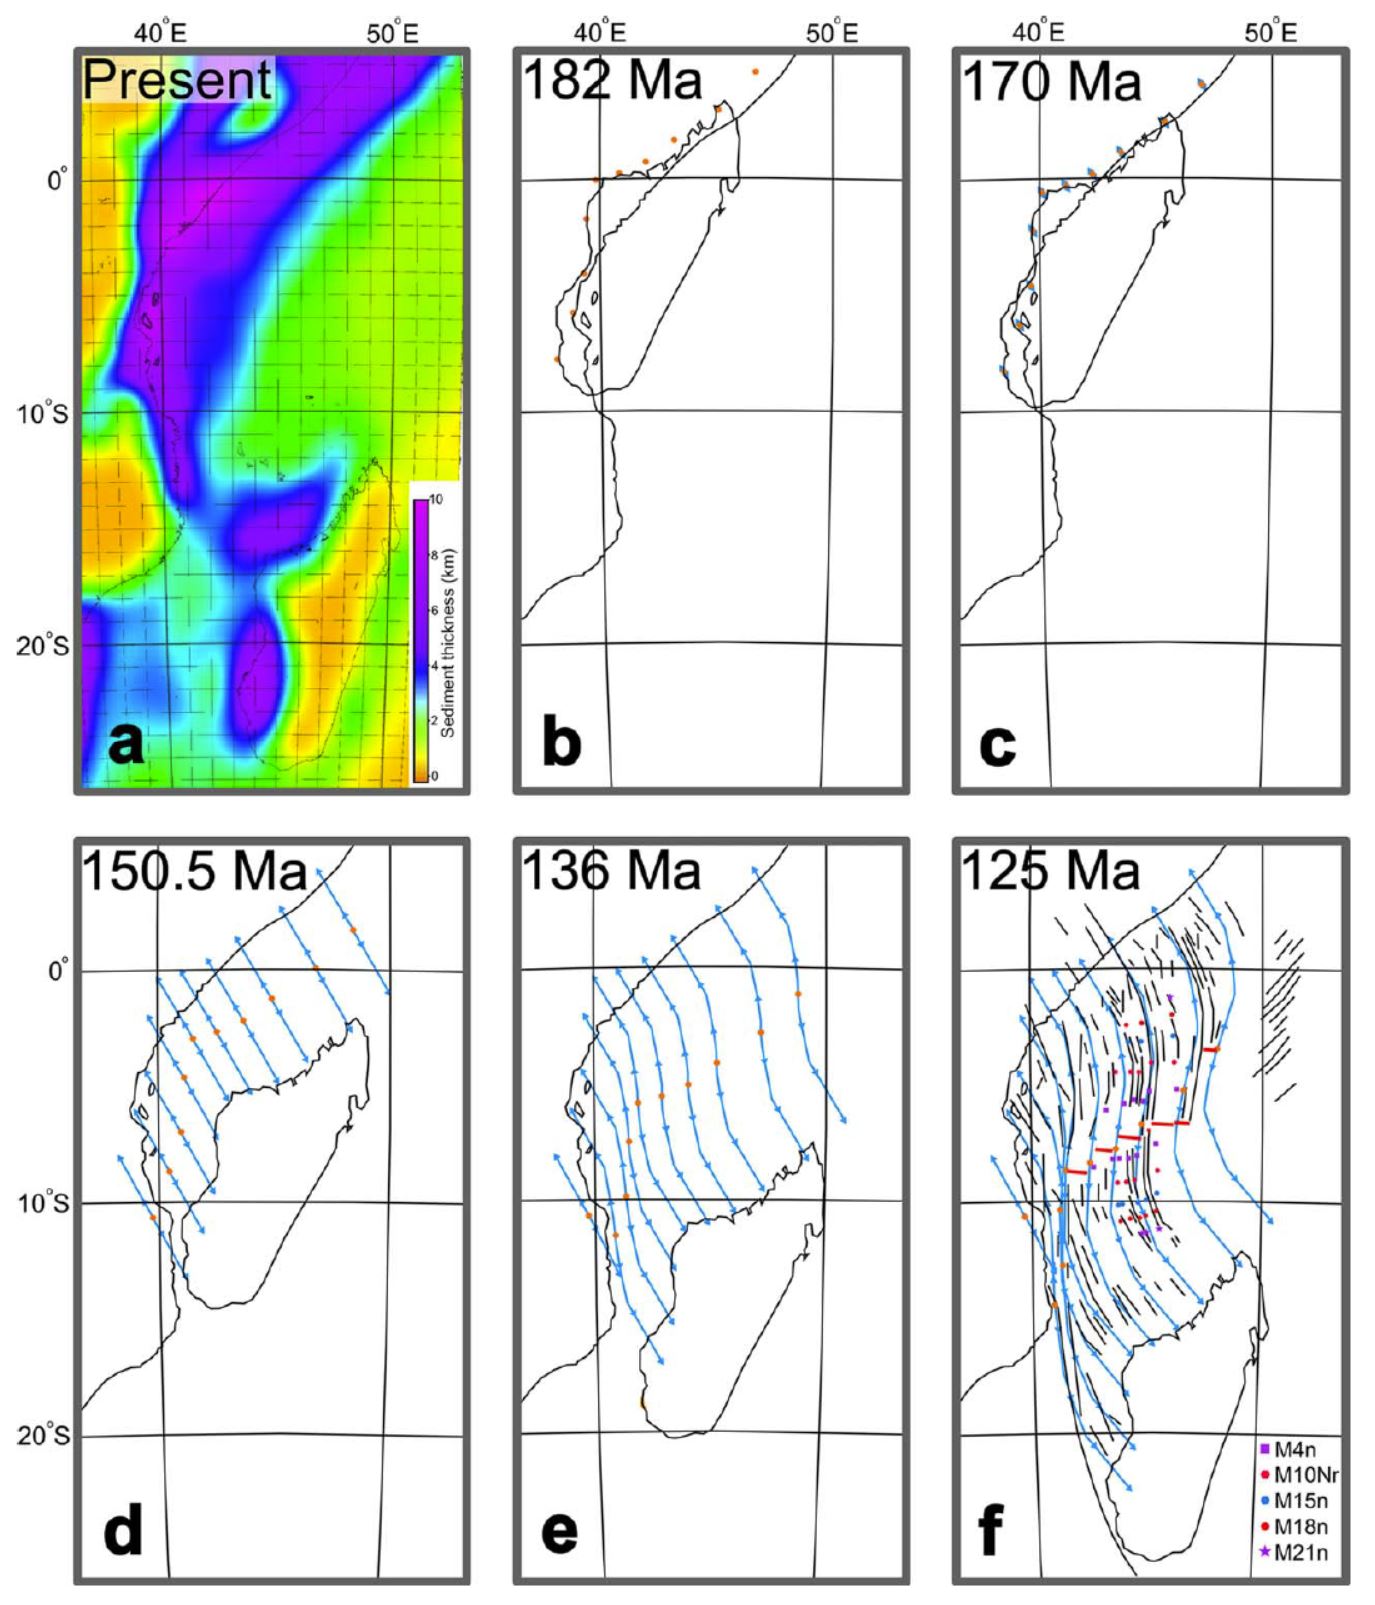
Plate tectonic reconstruction of Madagascar’s escape from Africa from the Early Jurassic to the cessation of spreading in the Cretaceous. Madagascar is shown without the remainder of East Gondwana (India, Antarctica, and Australia) attached. (a) Present-day sediment thickness in the Western Somali Basin taken from the CRUST1.0 model. (b–e) The key stages of Madagascar’s motion out of Africa. Modeled flow lines are shown as blue-arrowed lines where the center of symmetry is marked by orange circles. (f) Madagascar’s present-day position, which is reached at around 125 Ma. Flow lines closely match the fracture zone pattern of the basin (additional black lines), and the basin’s predicted final symmetry (orange circles) lies in good agreement with the interpreted extinct mid-ocean ridge system (red lines). Locations of magnetic anomalies used to temporally constrain plate motions shown with symbols as interpreted by Davis et al. [2016].
- Here is the summary figure, showing their interpretation of the different fracture zones (Phethean et al., 2017).

(a) Commonly interpreted basin configuration, where the continent-ocean transition is assumed to follow the DFZ [e.g., Bunce and Molnar, 1977; Coffin and Rabinowitz, 1987; Gaina et al., 2013]. (b) Schematic of the basin configuration suggested in this study, with strike-slip tectonics dominating along the edge of the Rovuma Basin, while much of the Tanzania Coastal Basin should be considered as an obliquely rifted margin. The Davie Fracture Zone is a major ocean-ocean fracture zone, not the continent-ocean transform margin. DFZ, Davie Fracture Zone; DHOW, Dhow Fracture Zone; VLCC, Very Large Crude Carrier Fracture Zone; ARS, Auxiliary Rescue and Salvage Fracture Zone. (c) Free-air gravity overlain with interpretation as for Figure 9b
- This is the map from Franke et al. (2015) showing the EAR system, including the offshore branch, the Davie Ridge. These authors work offshore and use seismic reflection and bathymetric data to show the extension in the offshore basins, as they respond to EAR extension.
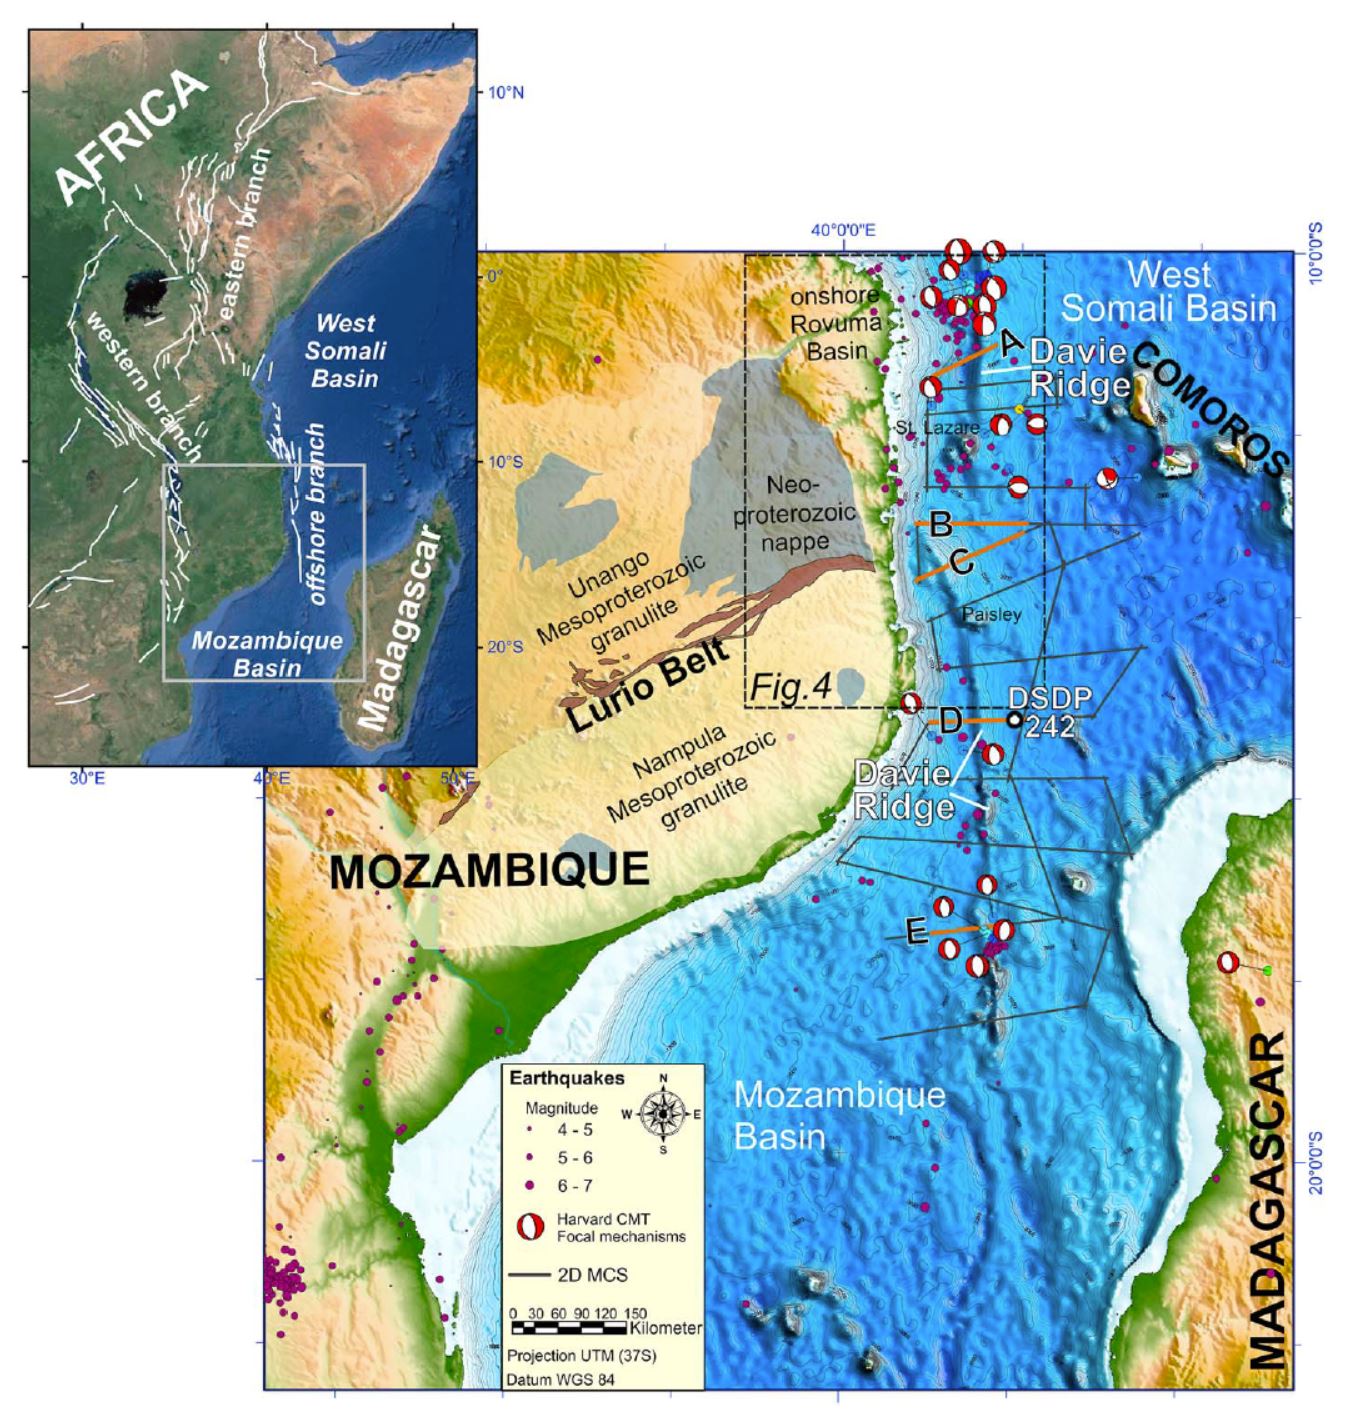
General geological overview of the study area. Dark grey lines indicate the position of geophysical profiles acquired during R/V Sonne cruise SO-231 in 2014. Earthquake locations and magnitudes (1973–2014; mb>4.0) are shown as magenta circles according to the National Earthquake Information Center catalog and earthquake moment tensors from the Global Centroid Moment Tensor catalog [Ekström et al., 2012]. The Lurio Belt separates the northern from the southern high-grade metamorphic basement of northern Mozambique [Emmel et al., 2011]. The inlay shows the main faults of the western and eastern branches of the East African Rift System (from Chorowicz [2005] and Macgregor [2015]).
- Emerick and Duncan (1983) demonstrated the age progression for the volcanic islands in this region. Below is a map showing the paths for the Cororos and Seychelles hotspots.
- Here is a plot showing the ages for the rocks studied by Emerick and Duncan (1982).
- This is a fantastic plot that shows how hotspot volcanism has a finite time at the surface (for any given location) as the plate moves across the hotspot (Emerick and Duncan, 1982).
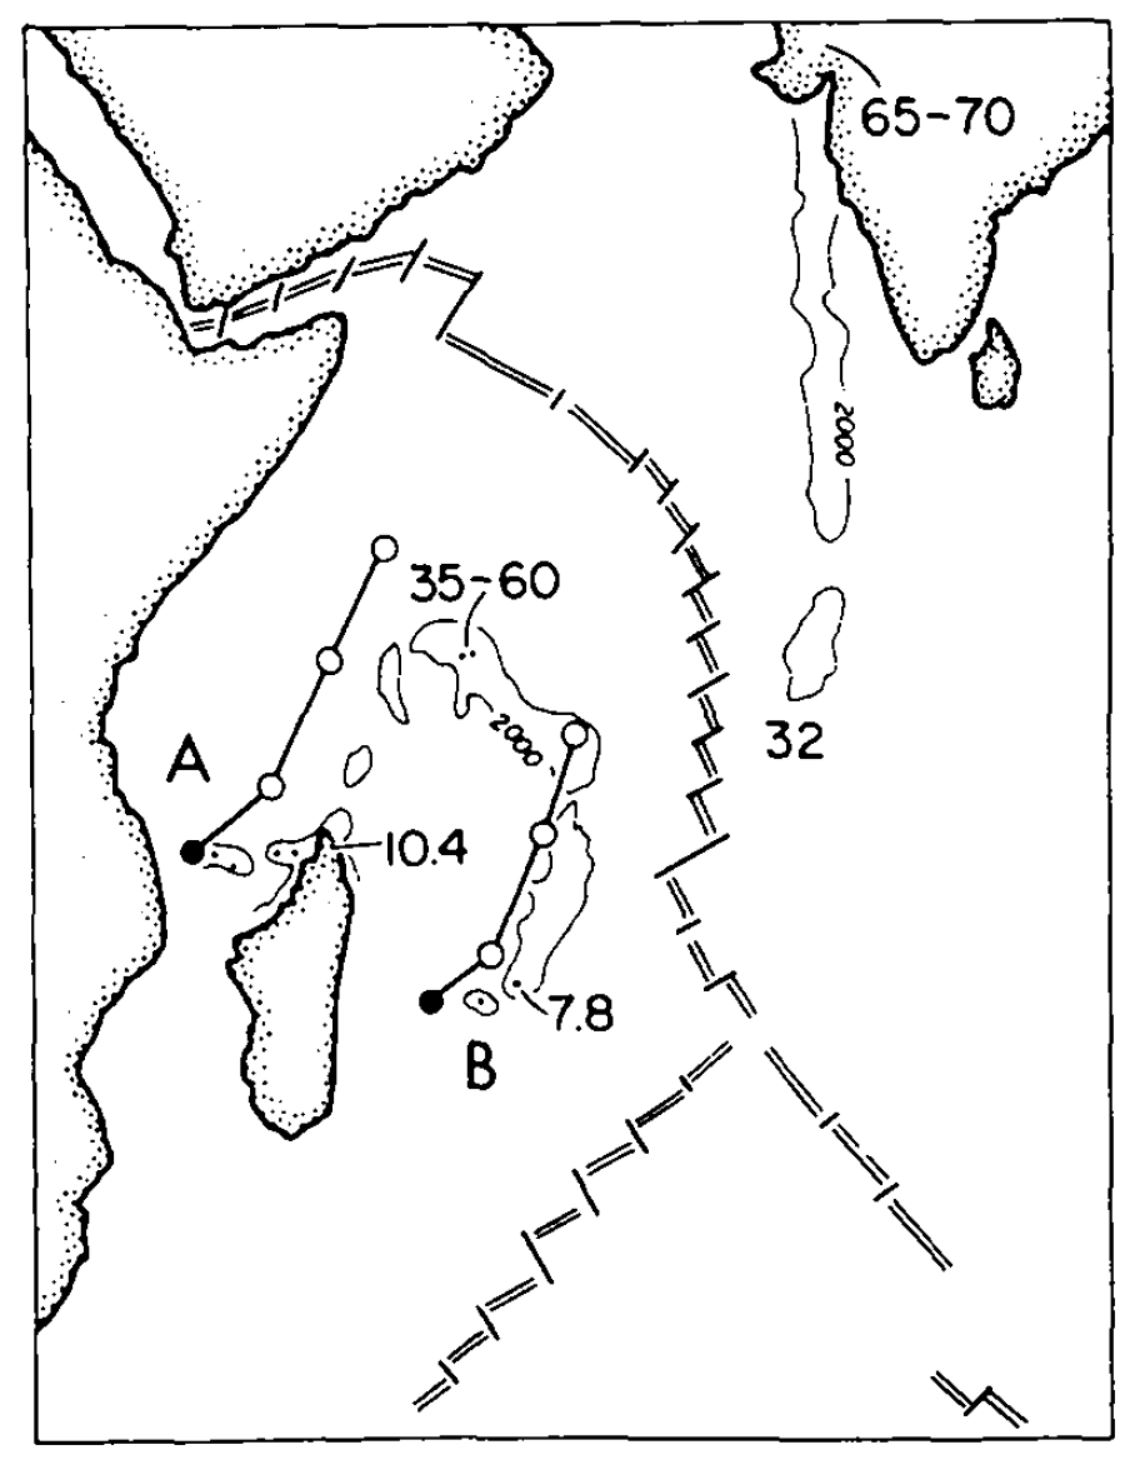
Hotspot paths predicted by African absolute motions [3], which are shown as solid lines connected by circles of 20 m.y. increments, are systematically offset from the observed paths for the Comores (A) and Reunion (B) hotspots, outlined by the 2000 m bathymetric contour. The difference between predicted and observed paths can be used to determine Somali-African relative motion between 0 and 10 m.y.B.P. For the period 10-60 m.y. the predicted paths parallel the observed paths, indicating no significant relative motion prior to about 10 m.y. ago. The reported ages for the Comores trend are from this paper and reference 7; for the Reunion trend, from references 24-26, 37, 38.
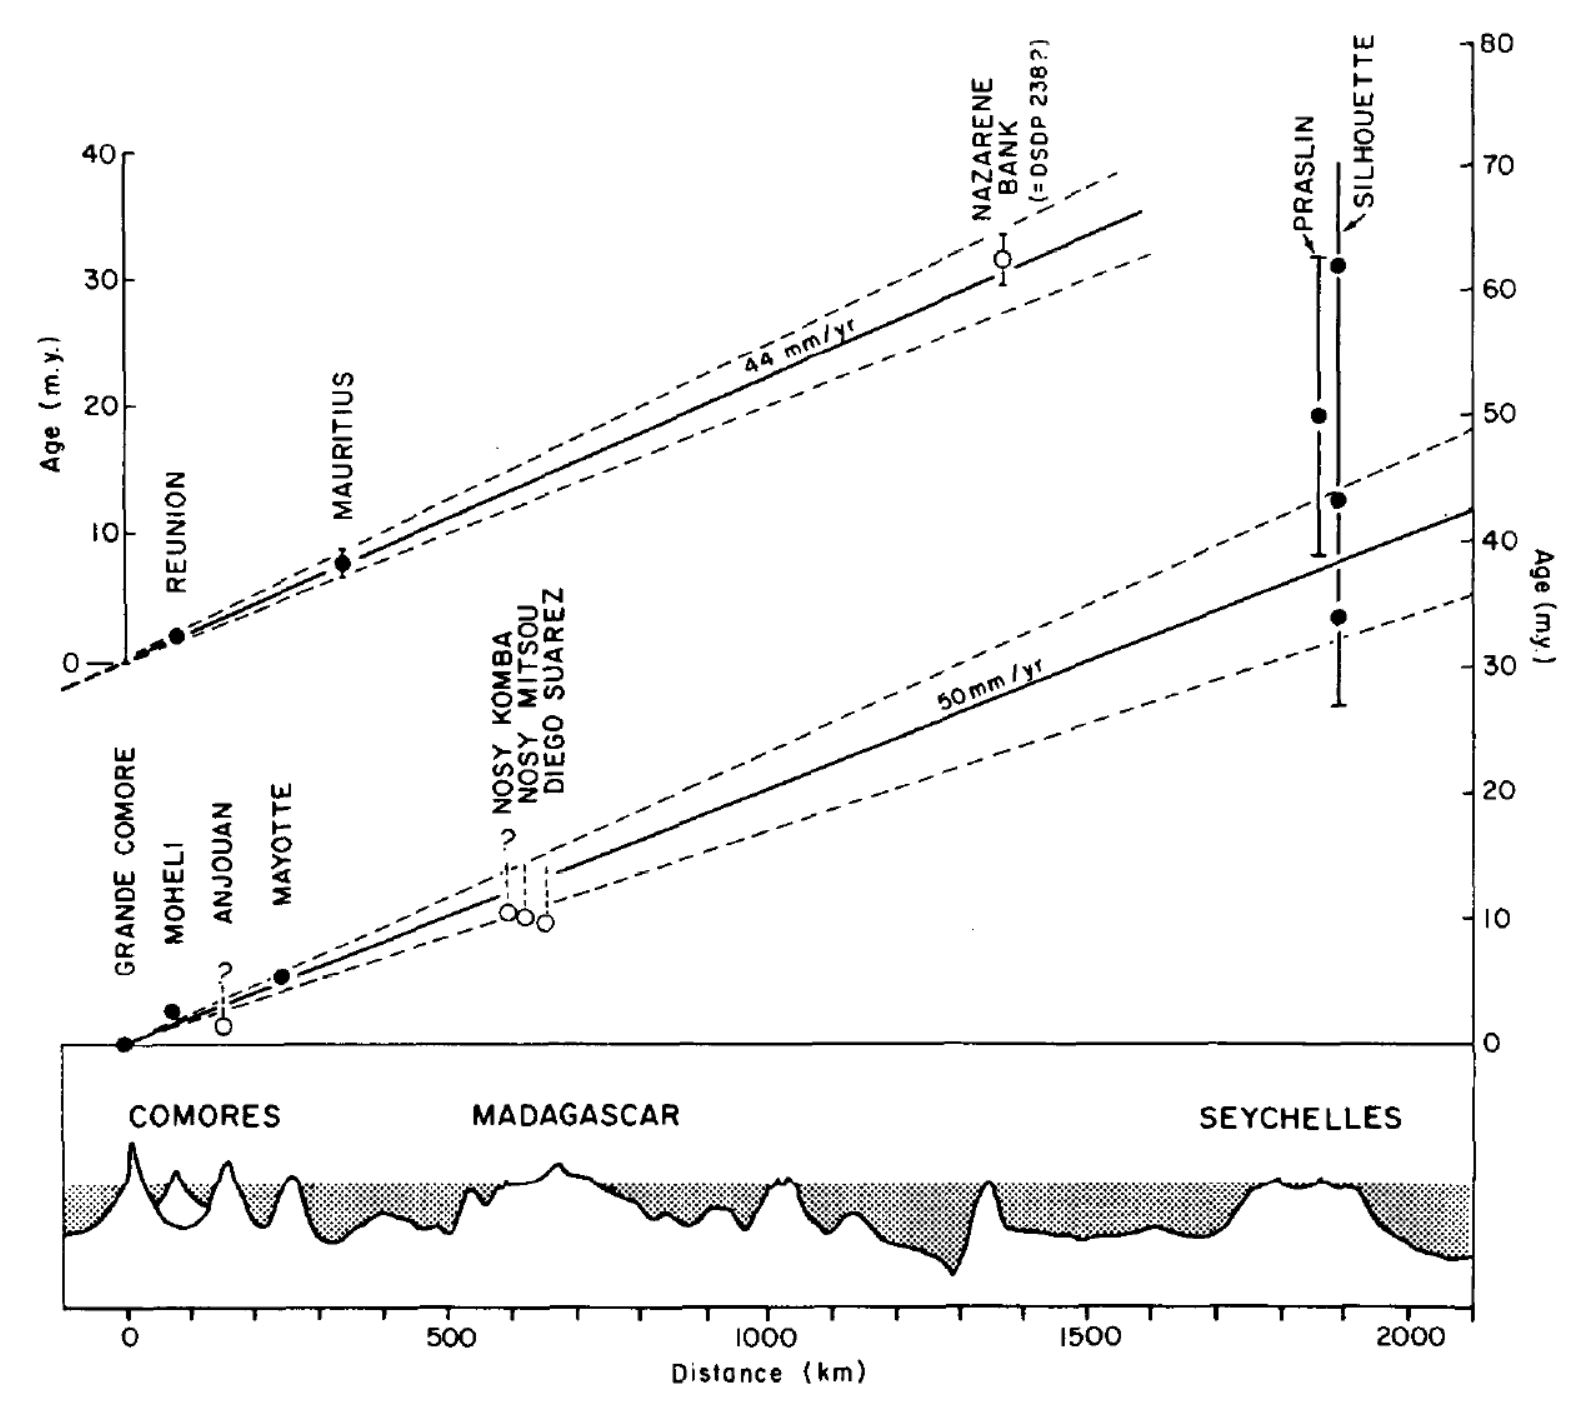
A. Distance from present hotspot activity at Grande Comore, measured along the trend of the Comores Islands to Seychelles Islands lineament, is plotted against ages of initial volcanism at several localities (Table 1, and [7,9]). The solid circles represent best age estimates of initial volcanism, whereas the open circles represent minimum ages of volcanism at each site. A rate of migration of volcanism of 50 mm/yr best fits the new K-Ar ages for shield-building lavas at Grande Comore and Mayotte and the minimum age of volcanism in northern Madagascar. Igneous activity in the Seychelles at about 40 m.y. B.P. is consistent with this trend. Generalized topography from reference 4. B. Reported ;adiometric ages along the Reunion hotspot trend [24,25] yield a rate of migration of volcanism of 44 mm/yr. An early Oligocene age for DSDP site 238 on the southern end of the Chagos-Laccadive Ridge 1261 provides a minimum age for the Nazarene Bank region of the Mascarene Plateau, which was sundered from the Chagos-Laccadive Ridge by spreading across the Central Indian Ridge about 32 m.y. ago.
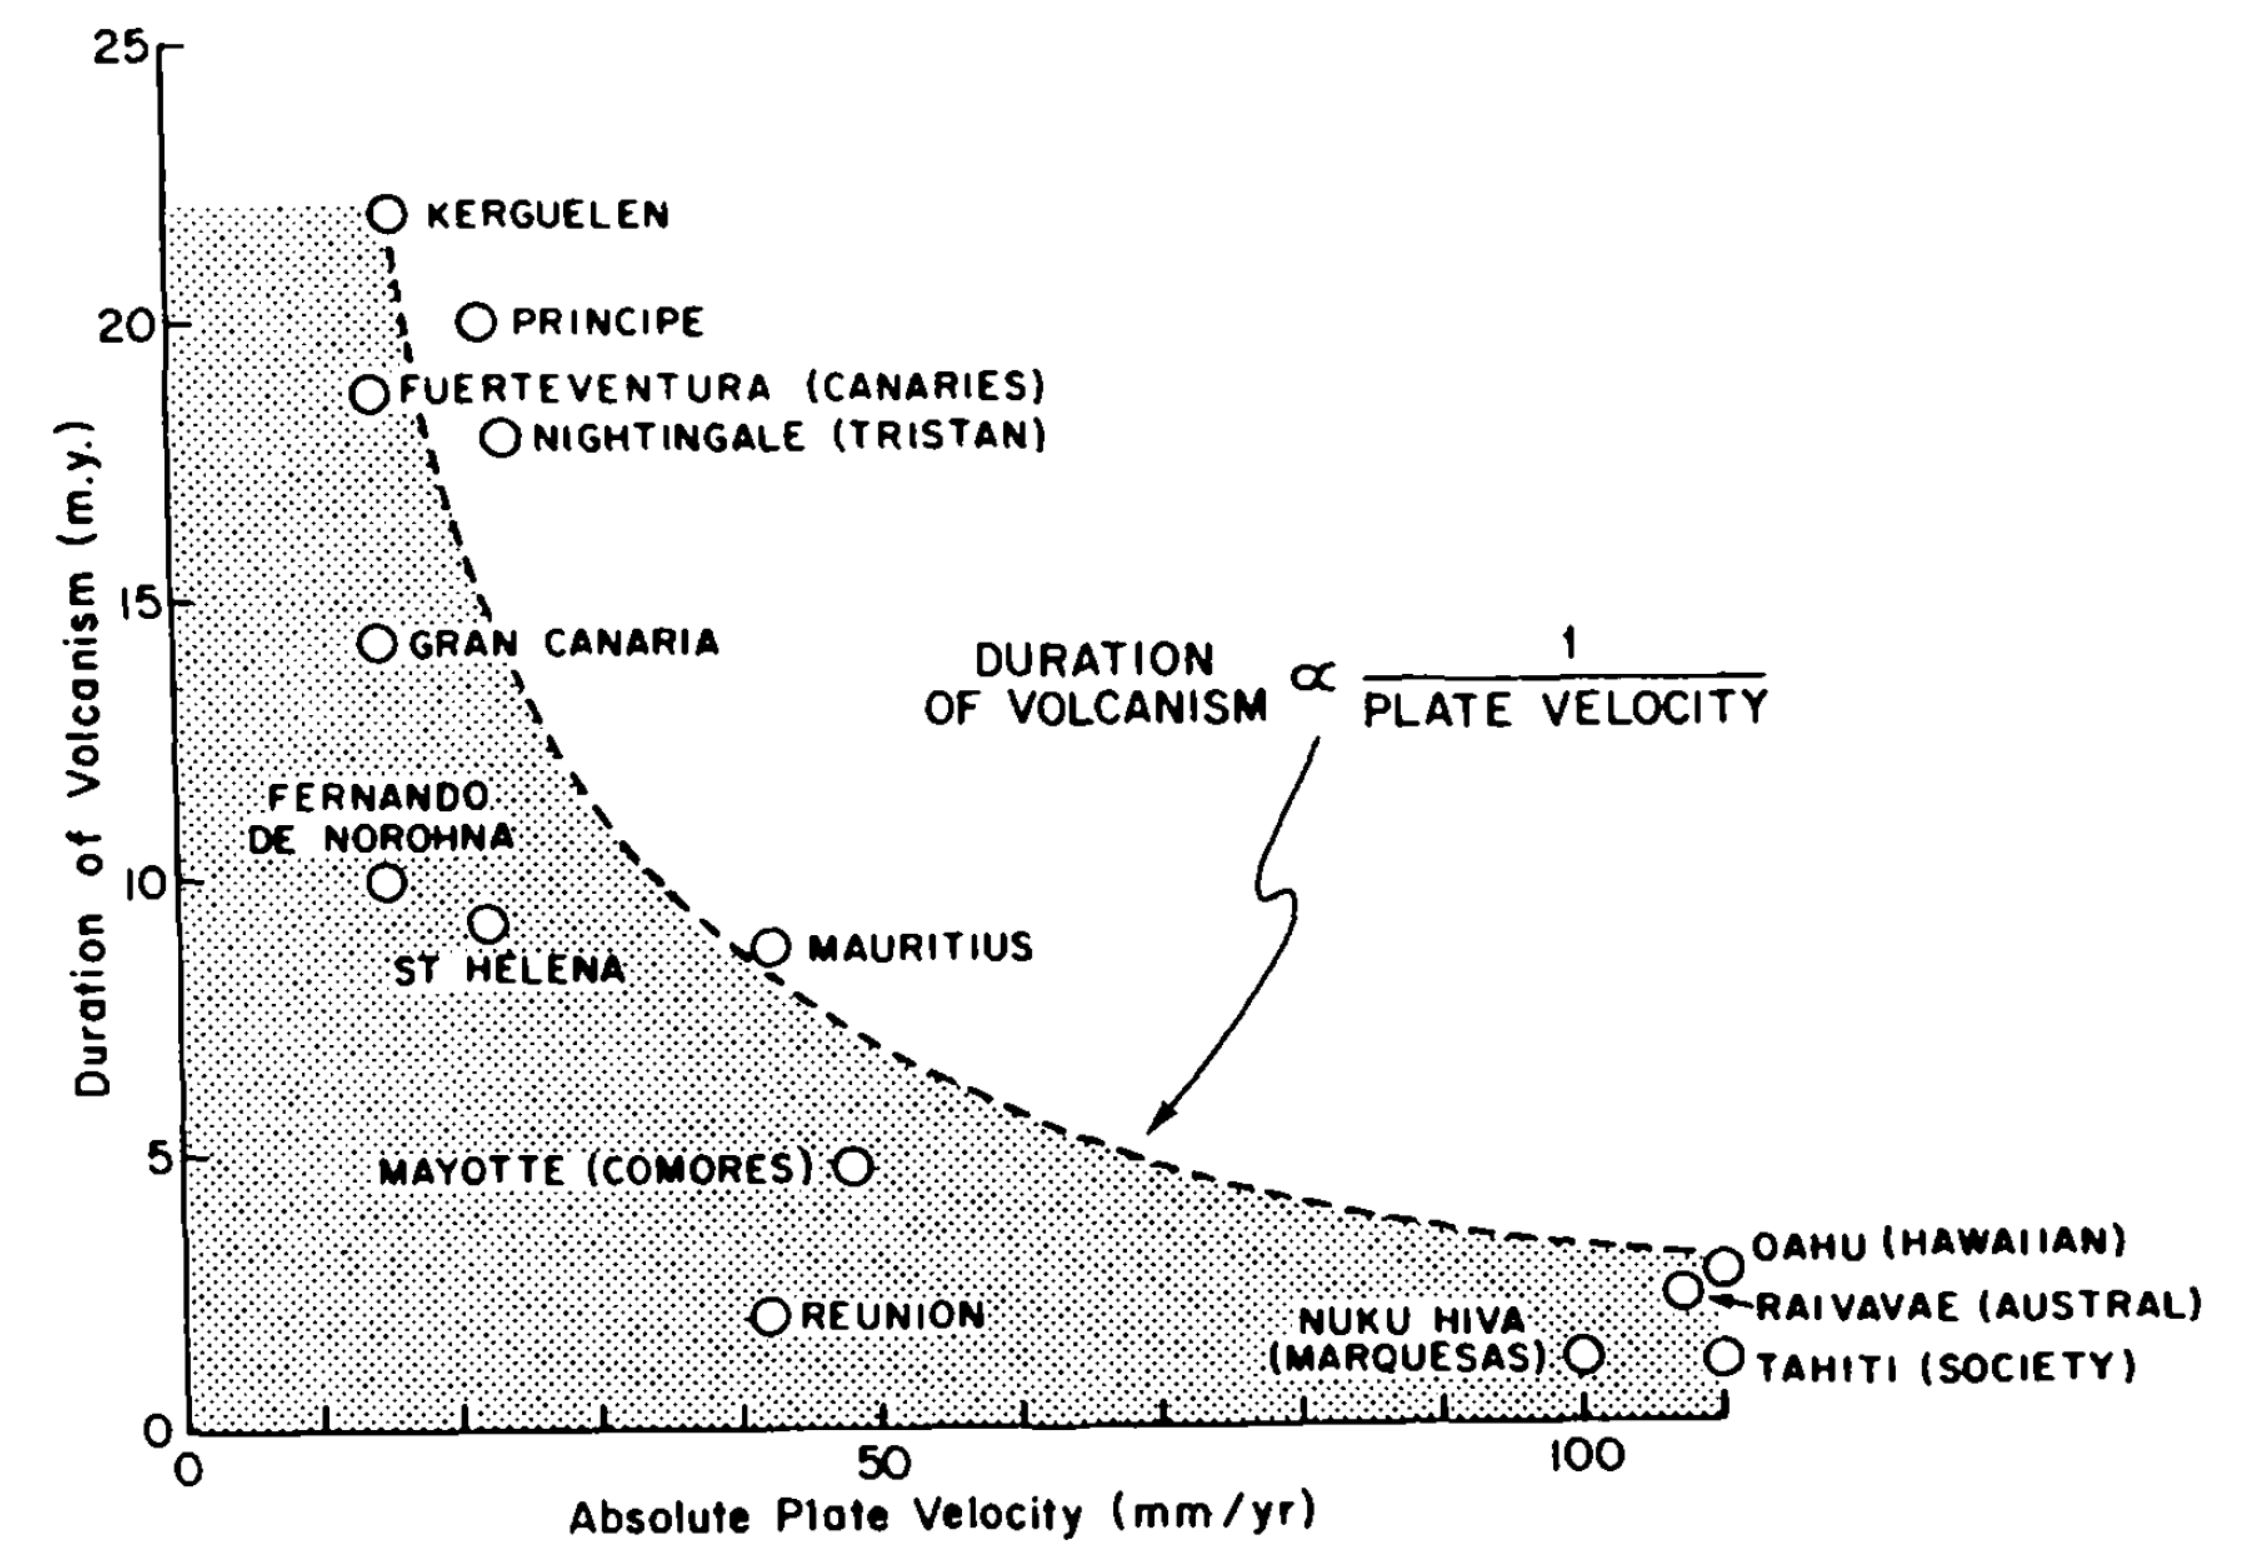
Duration of volcanism at oceanic islands is proportional to the inverse of plate velocity over mantle hotspots, which determines how long magmas are available for eruption. The dashed curve fits the maximum observed eruptive histories. Other data fall below this line due to incomplete sampling or unfinished volcanism.
Geologic Fundamentals
- For more on the graphical representation of moment tensors and focal mechnisms, check this IRIS video out:
- Here is a fantastic infographic from Frisch et al. (2011). This figure shows some examples of earthquakes in different plate tectonic settings, and what their fault plane solutions are. There is a cross section showing these focal mechanisms for a thrust or reverse earthquake. The upper right corner includes my favorite figure of all time. This shows the first motion (up or down) for each of the four quadrants. This figure also shows how the amplitude of the seismic waves are greatest (generally) in the middle of the quadrant and decrease to zero at the nodal planes (the boundary of each quadrant).

- There are three types of earthquakes, strike-slip, compressional (reverse or thrust, depending upon the dip of the fault), and extensional (normal). Here is are some animations of these three types of earthquake faults. The following three animations are from IRIS.
Strike Slip:
Compressional:
Extensional:
- This is an image from the USGS that shows how, when an oceanic plate moves over a hotspot, the volcanoes formed over the hotspot form a series of volcanoes that increase in age in the direction of plate motion. The presumption is that the hotspot is stable and stays in one location. Torsvik et al. (2017) use various methods to evaluate why this is a false presumption for the Hawaii Hotspot.
- Here is a map from Torsvik et al. (2017) that shows the age of volcanic rocks at different locations along the Hawaii-Emperor Seamount Chain.

A cutaway view along the Hawaiian island chain showing the inferred mantle plume that has fed the Hawaiian hot spot on the overriding Pacific Plate. The geologic ages of the oldest volcano on each island (Ma = millions of years ago) are progressively older to the northwest, consistent with the hot spot model for the origin of the Hawaiian Ridge-Emperor Seamount Chain. (Modified from image of Joel E. Robinson, USGS, in “This Dynamic Planet” map of Simkin and others, 2006.)

Hawaiian-Emperor Chain. White dots are the locations of radiometrically dated seamounts, atolls and islands, based on compilations of Doubrovine et al. and O’Connor et al. Features encircled with larger white circles are discussed in the text and Fig. 2. Marine gravity anomaly map is from Sandwell and Smith.
Social Media
Mw=5.9, NORTHWEST OF MADAGASCAR (Depth: 16 km), 2018/05/15 15:48:08 UTC – Full details here: https://t.co/mGz2IBUaoK pic.twitter.com/2XHrXB4SB3
— Earthquakes (@geoscope_ipgp) May 15, 2018
#DíaDelMaestro #HappyJongHyunDay #DíaDelMaestro #FelizMartes #FelizMiercoles #Pamandzi #ULTIMAHORA #Noticias #Madagasca #Africa #Earthquake #Sismo #temblor #terremoto #Pamanandzi #Mayotte Primeras Imágenes del sismo de 5.8 en Mayotte. pic.twitter.com/3HxNBY6CfG
— Cristopher MG. (@GCristoher) May 15, 2018
Actual scientific paper preprint on volcano-tectonic crisis east of Mayotte by Anne Lemoine posted @EarthArXiv a few days ago: https://t.co/KflEX3hjJg
— Eric Fielding (@EricFielding) March 2, 2019
- 2018.05.15 M 5.8 Madagascar
- 2018.03.08 M 5.6 Mozambique and Malawi
- 2017.04.03 M 6.5 Botswana
- 2016.9.10 M 5.7 Tanzania
Africa
Earthquake Reports
- Franke, D., W. Jokat, S. Ladage, H. Stollhofen, J. Klimke, R. Lutz, E. S. Mahanjane, A. Ehrhardt, and B. Schreckenberger (2015), The offshore East African Rift System: Structural framework at the toe of a juvenile rift, Tectonics, 34, 2086–2104, doi:10.1002/2015TC003922.
- Phethean, Jordan J.J. and Kalnins, Lara M. and van Hunen, Jeroen and Biffi, Paolo G. and Davies, Richard J. and McCaffrey, Ken J.W., 2016. Madagascar’s escape from Africa : a high-resolution plate reconstruction for the Western Somali Basin and implications for supercontinent dispersal in Geochemistry, geophysics, geosystems., 17 (12). pp. 5036-5055.
- Reeves, C. 2014. The position of Madagascar within Gondwana and its movements during Gondwana dispersal. J. Afr. Earth Sci., http://dx.doi.org/10.1016/j.jafrearsci.2013.07.011