This afternoon my time, there was a large earthquake in the Caribbean.
https://earthquake.usgs.gov/earthquakes/eventpage/us7000pcdl/executive
This magnitude M 7.6 earthquake happened along a right-lateral transform plate boundary, the Swan Island fault. At transform plate boundaries, the plates moves side-by-side.
The USGS earthquake mechanism shows that the earthquake was a strike-slip earthquake.
Since the Swan Island fault is a right-lateral strike-slip fault, the earthquake mechanism, and the aftershocks align with this mapped fault, i interpret this as a left-lateral strike-slip fault earthquake.
Strike-slip earthquakes can generate tsunami, though they are smaller than for tsunami generated by subduction zone earthquakes. Tsunami are more likely if earthquake fault slip is shallow or if the earthquake ruptured the seafloor.
The USGS finite fault slip model suggests that there was up to about 12 meters of slip, with about 8 meters slip at the seafloor.
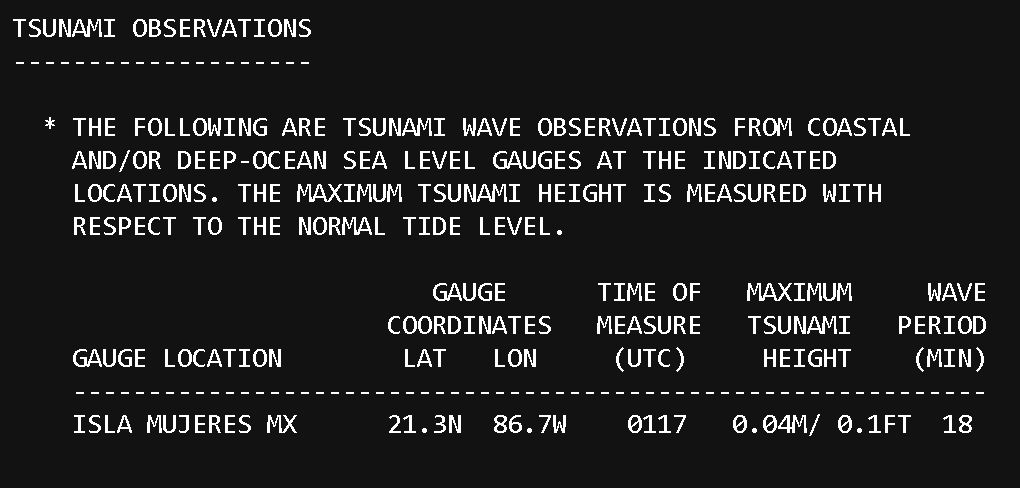
There was a tsunami observed at the Isla Mujeres tide gage, a location almost due west of the earthquake. Many of the other tide gages in the region were not operating at the time of the earthquake.
The tsunami appears to have a maximum amplitude of about 6 cm and a wave height of about 10 cm.
See the below diagram for more information about the difference between amplitude and wave height.
The National Tsunami Warning Center initially used a magnitude of 8.0 as a basis for their tsunami alerting.
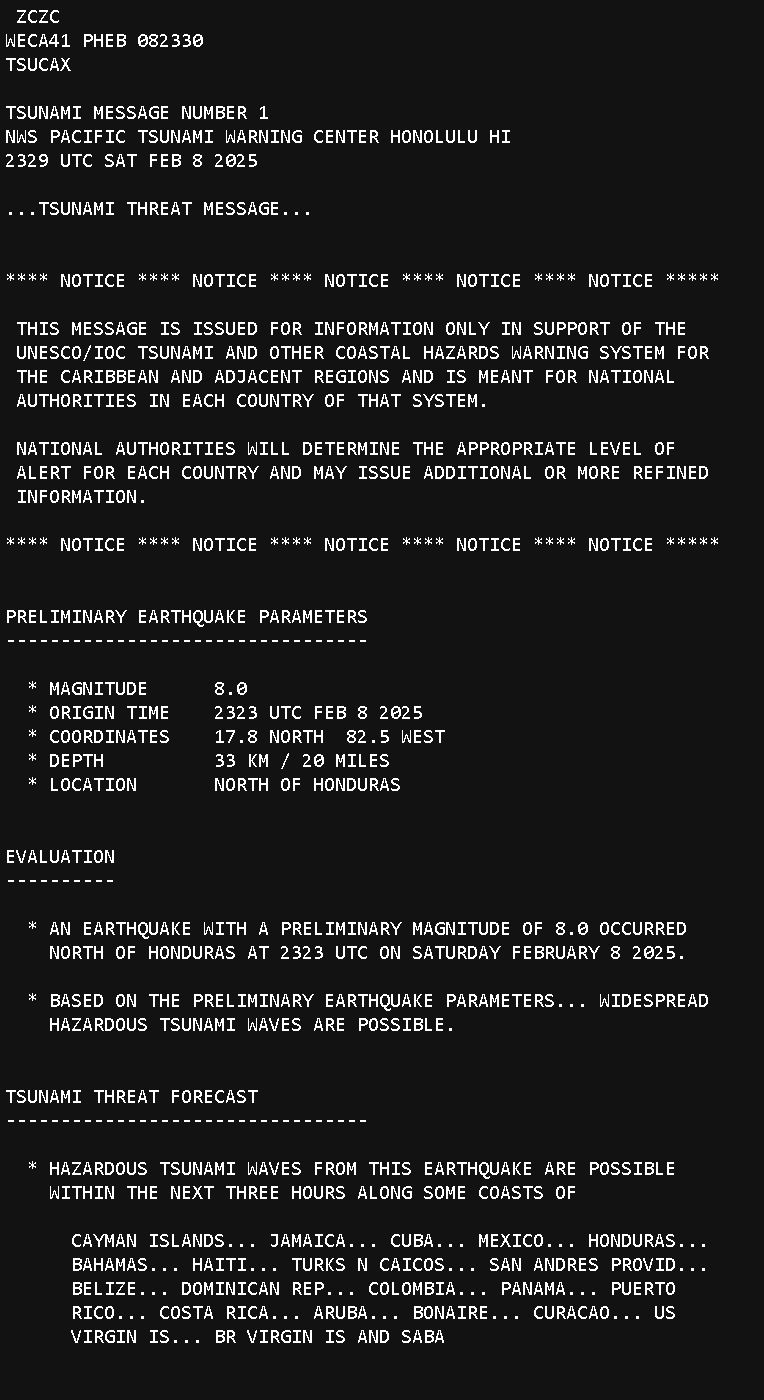
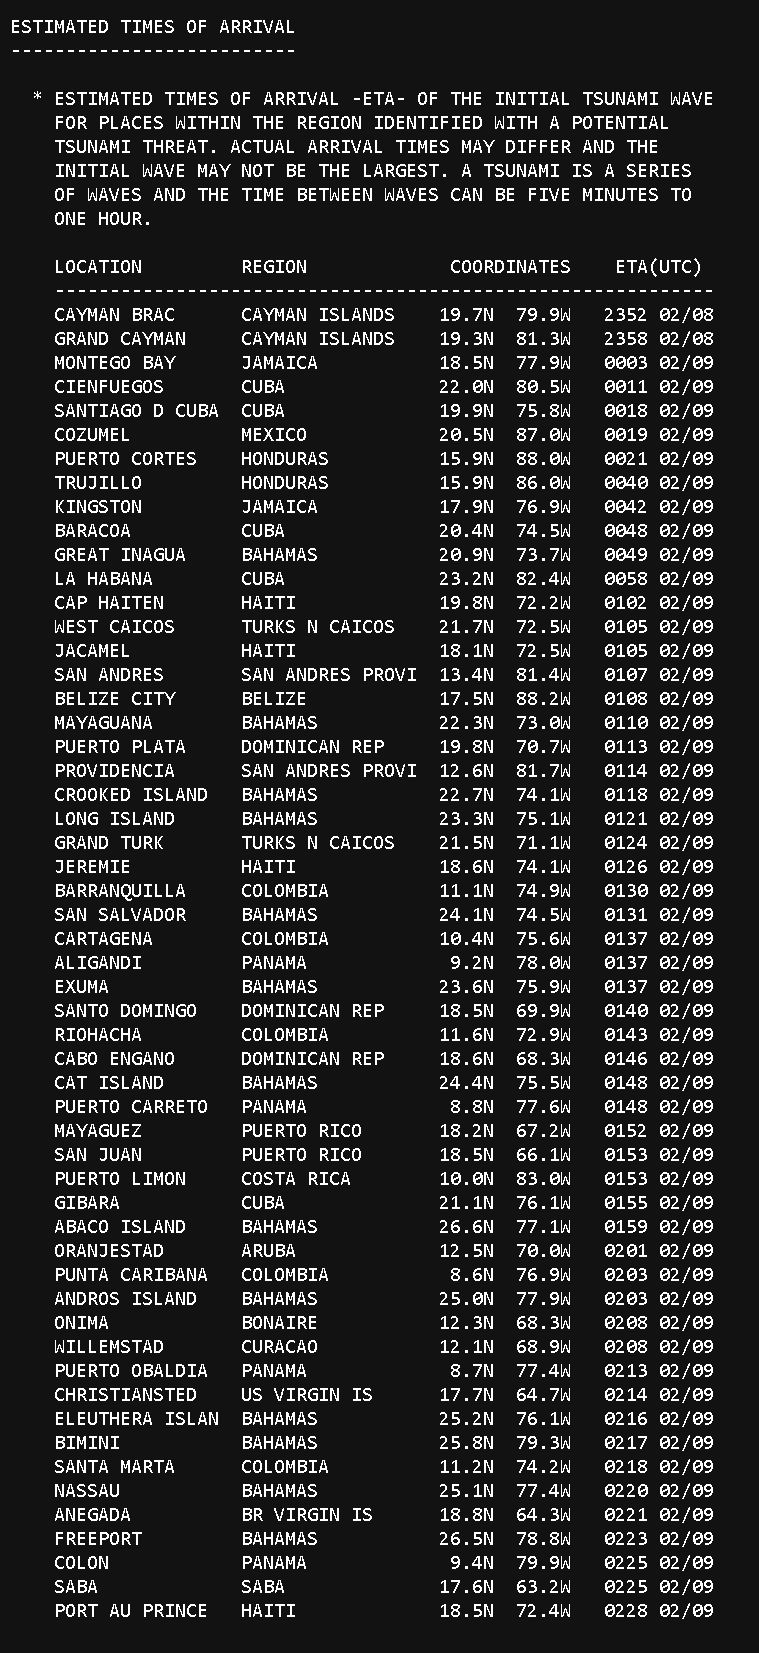
In this first message, the PTWC provided estimated arrival times for coastal locations.
In the final message, the PTWC listed the tsunami observations.
Below is my interpretive poster for this earthquake
- I plot the seismicity from the past month, with diameter representing magnitude (see legend). I include earthquake epicenters from 1924-2024 with magnitudes M ≥ 3.0 in one version.
- I plot the USGS fault plane solutions (moment tensors in blue and focal mechanisms in orange), possibly in addition to some relevant historic earthquakes.
- A review of the basic base map variations and data that I use for the interpretive posters can be found on the Earthquake Reports page. I have improved these posters over time and some of this background information applies to the older posters.
- Some basic fundamentals of earthquake geology and plate tectonics can be found on the Earthquake Plate Tectonic Fundamentals page.
- In the lower right corner is a map showing the plate tectonic boundaries (from the GEM).
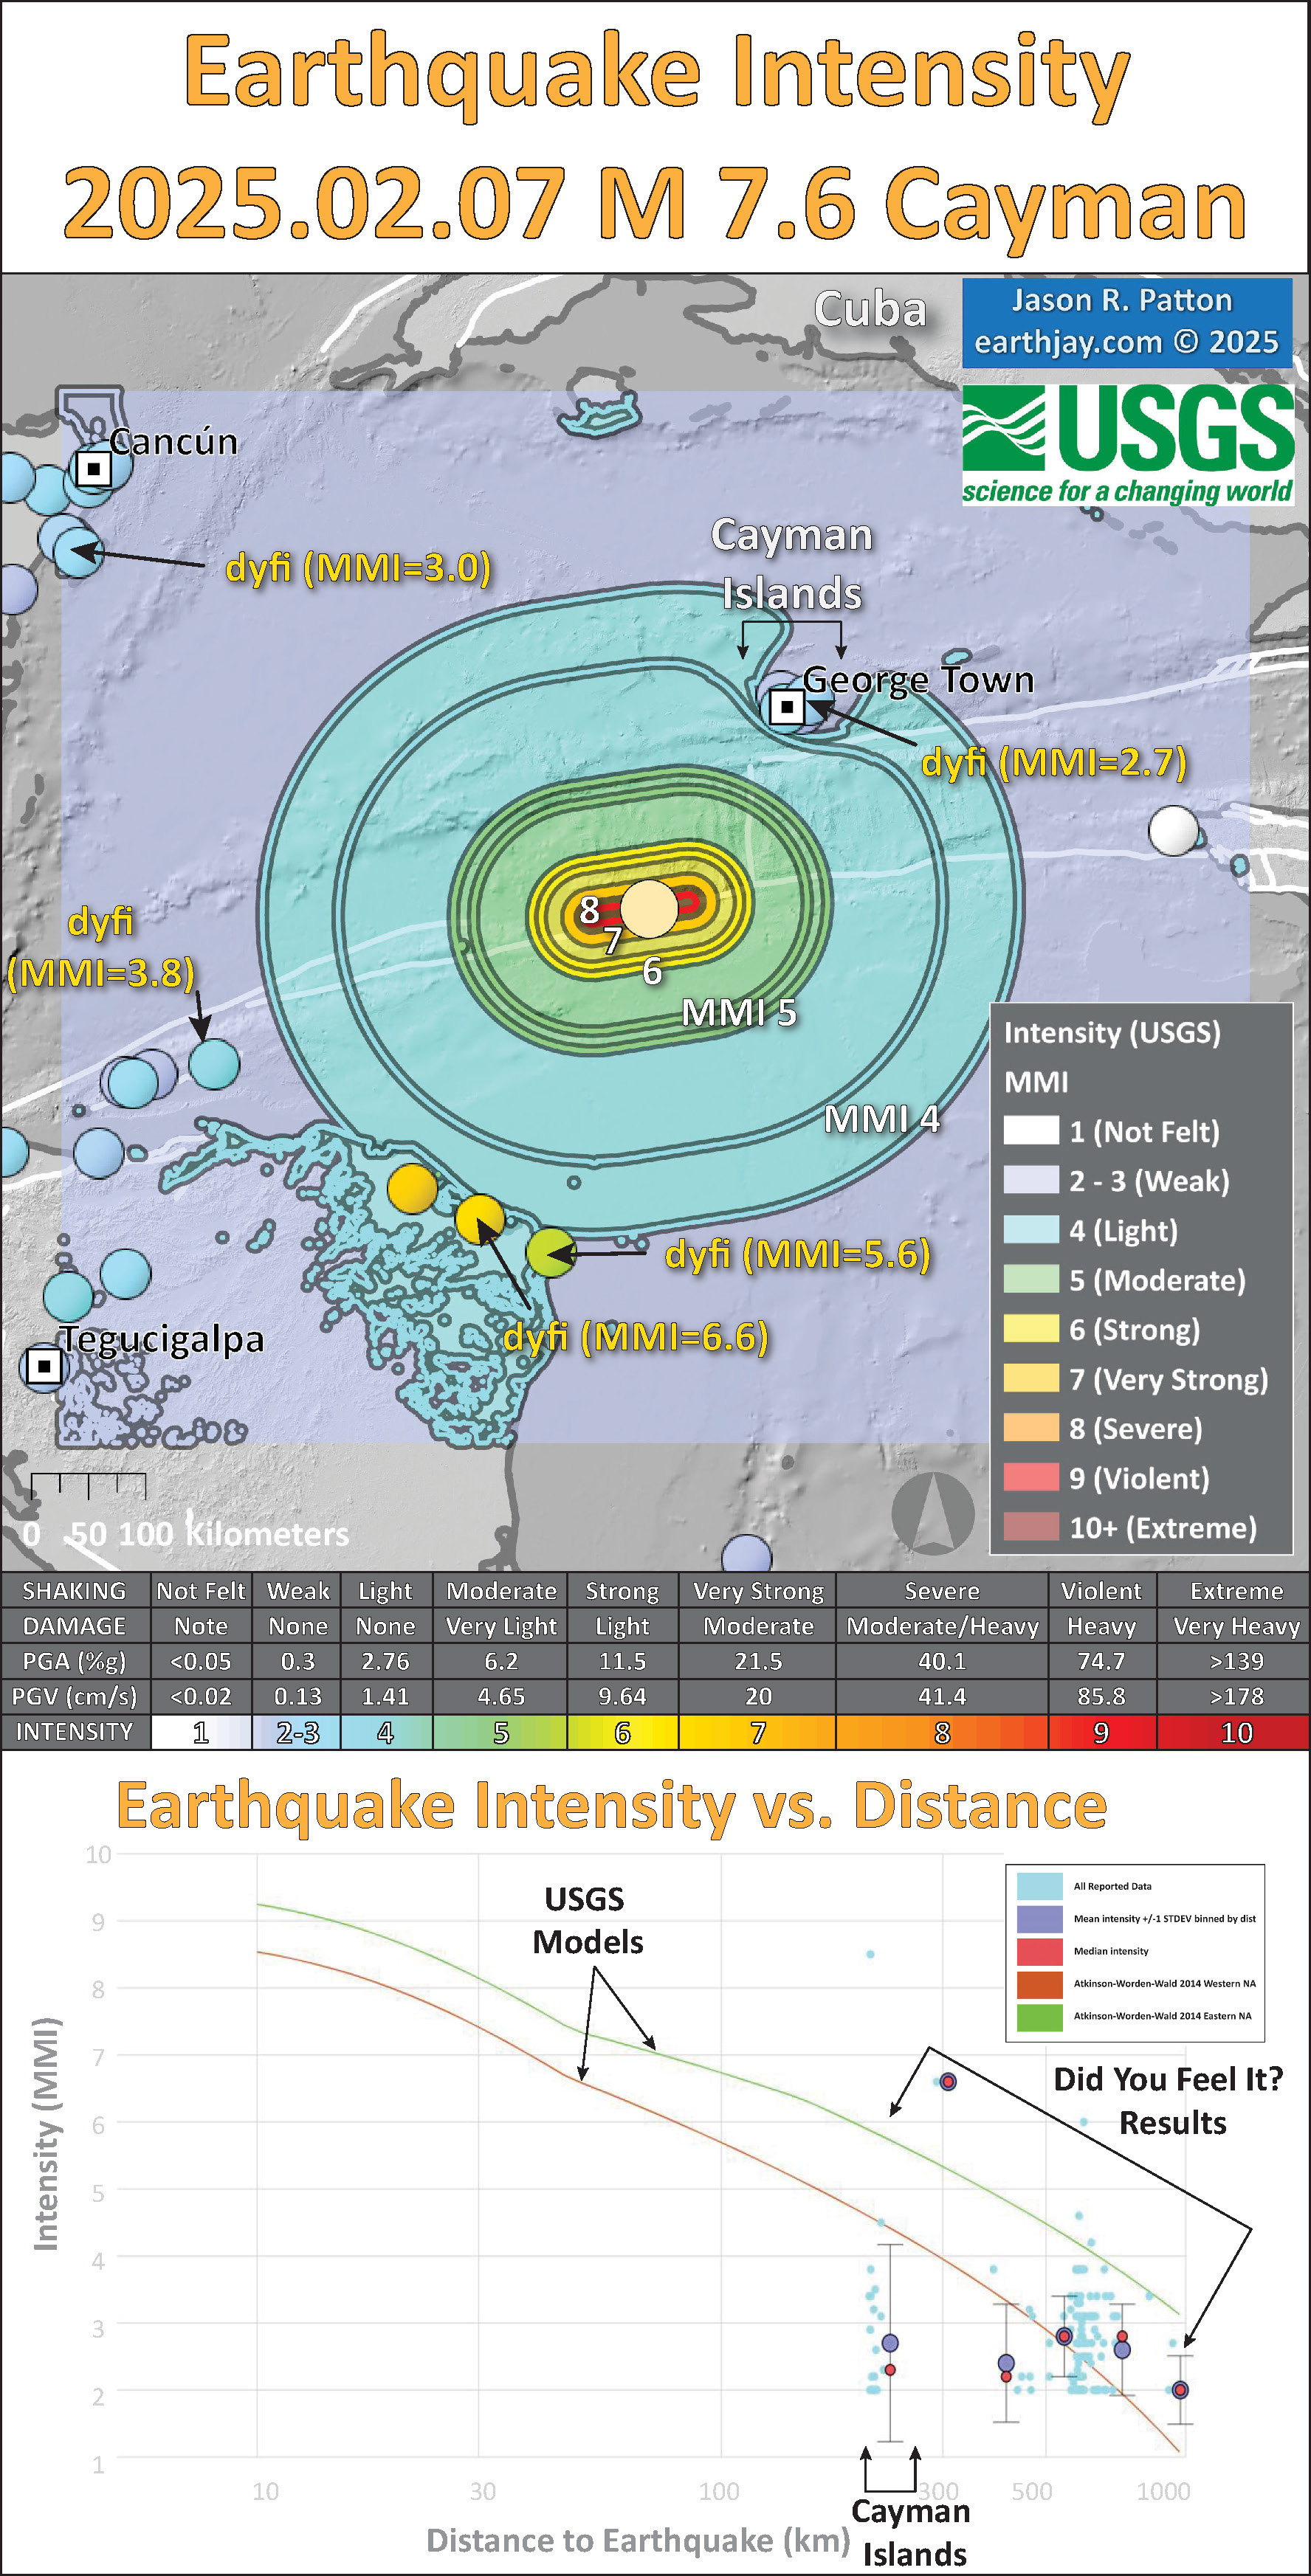
- In the lower left corner is a map that shows the M 7.6 earthquake intensity using the modified Mercalli intensity scale. Earthquake intensity is a measure of how strongly the Earth shakes during an earthquake, so gets smaller the further away one is from the earthquake epicenter. The map colors represent a model of what the intensity may be. The USGS has a system called “Did You Feel It?” (DYFI) where people enter their observations from the earthquake and the USGS calculates what the intensity was for that person. The dots with yellow labels show what people actually felt in those different locations.
- To the right of the intensity map is a plot that shows the same intensity (both modeled and reported) data as displayed on the map. Note how the intensity gets smaller with distance from the earthquake.
- Above the intensity vs. distance plot is the USGS finite fault model for the M 7.6 earthquake. They model slip on a rectangular fault and color represents how much the fault moved (up to about 12 meters).
- In the upper left corner is a map from Symithe et al. (2015) showing the plates, their boundaries, and earthquake mechanisms for some significant earthquakes. These mechanisms reveal what type of fault is formed at the plate boundaries.
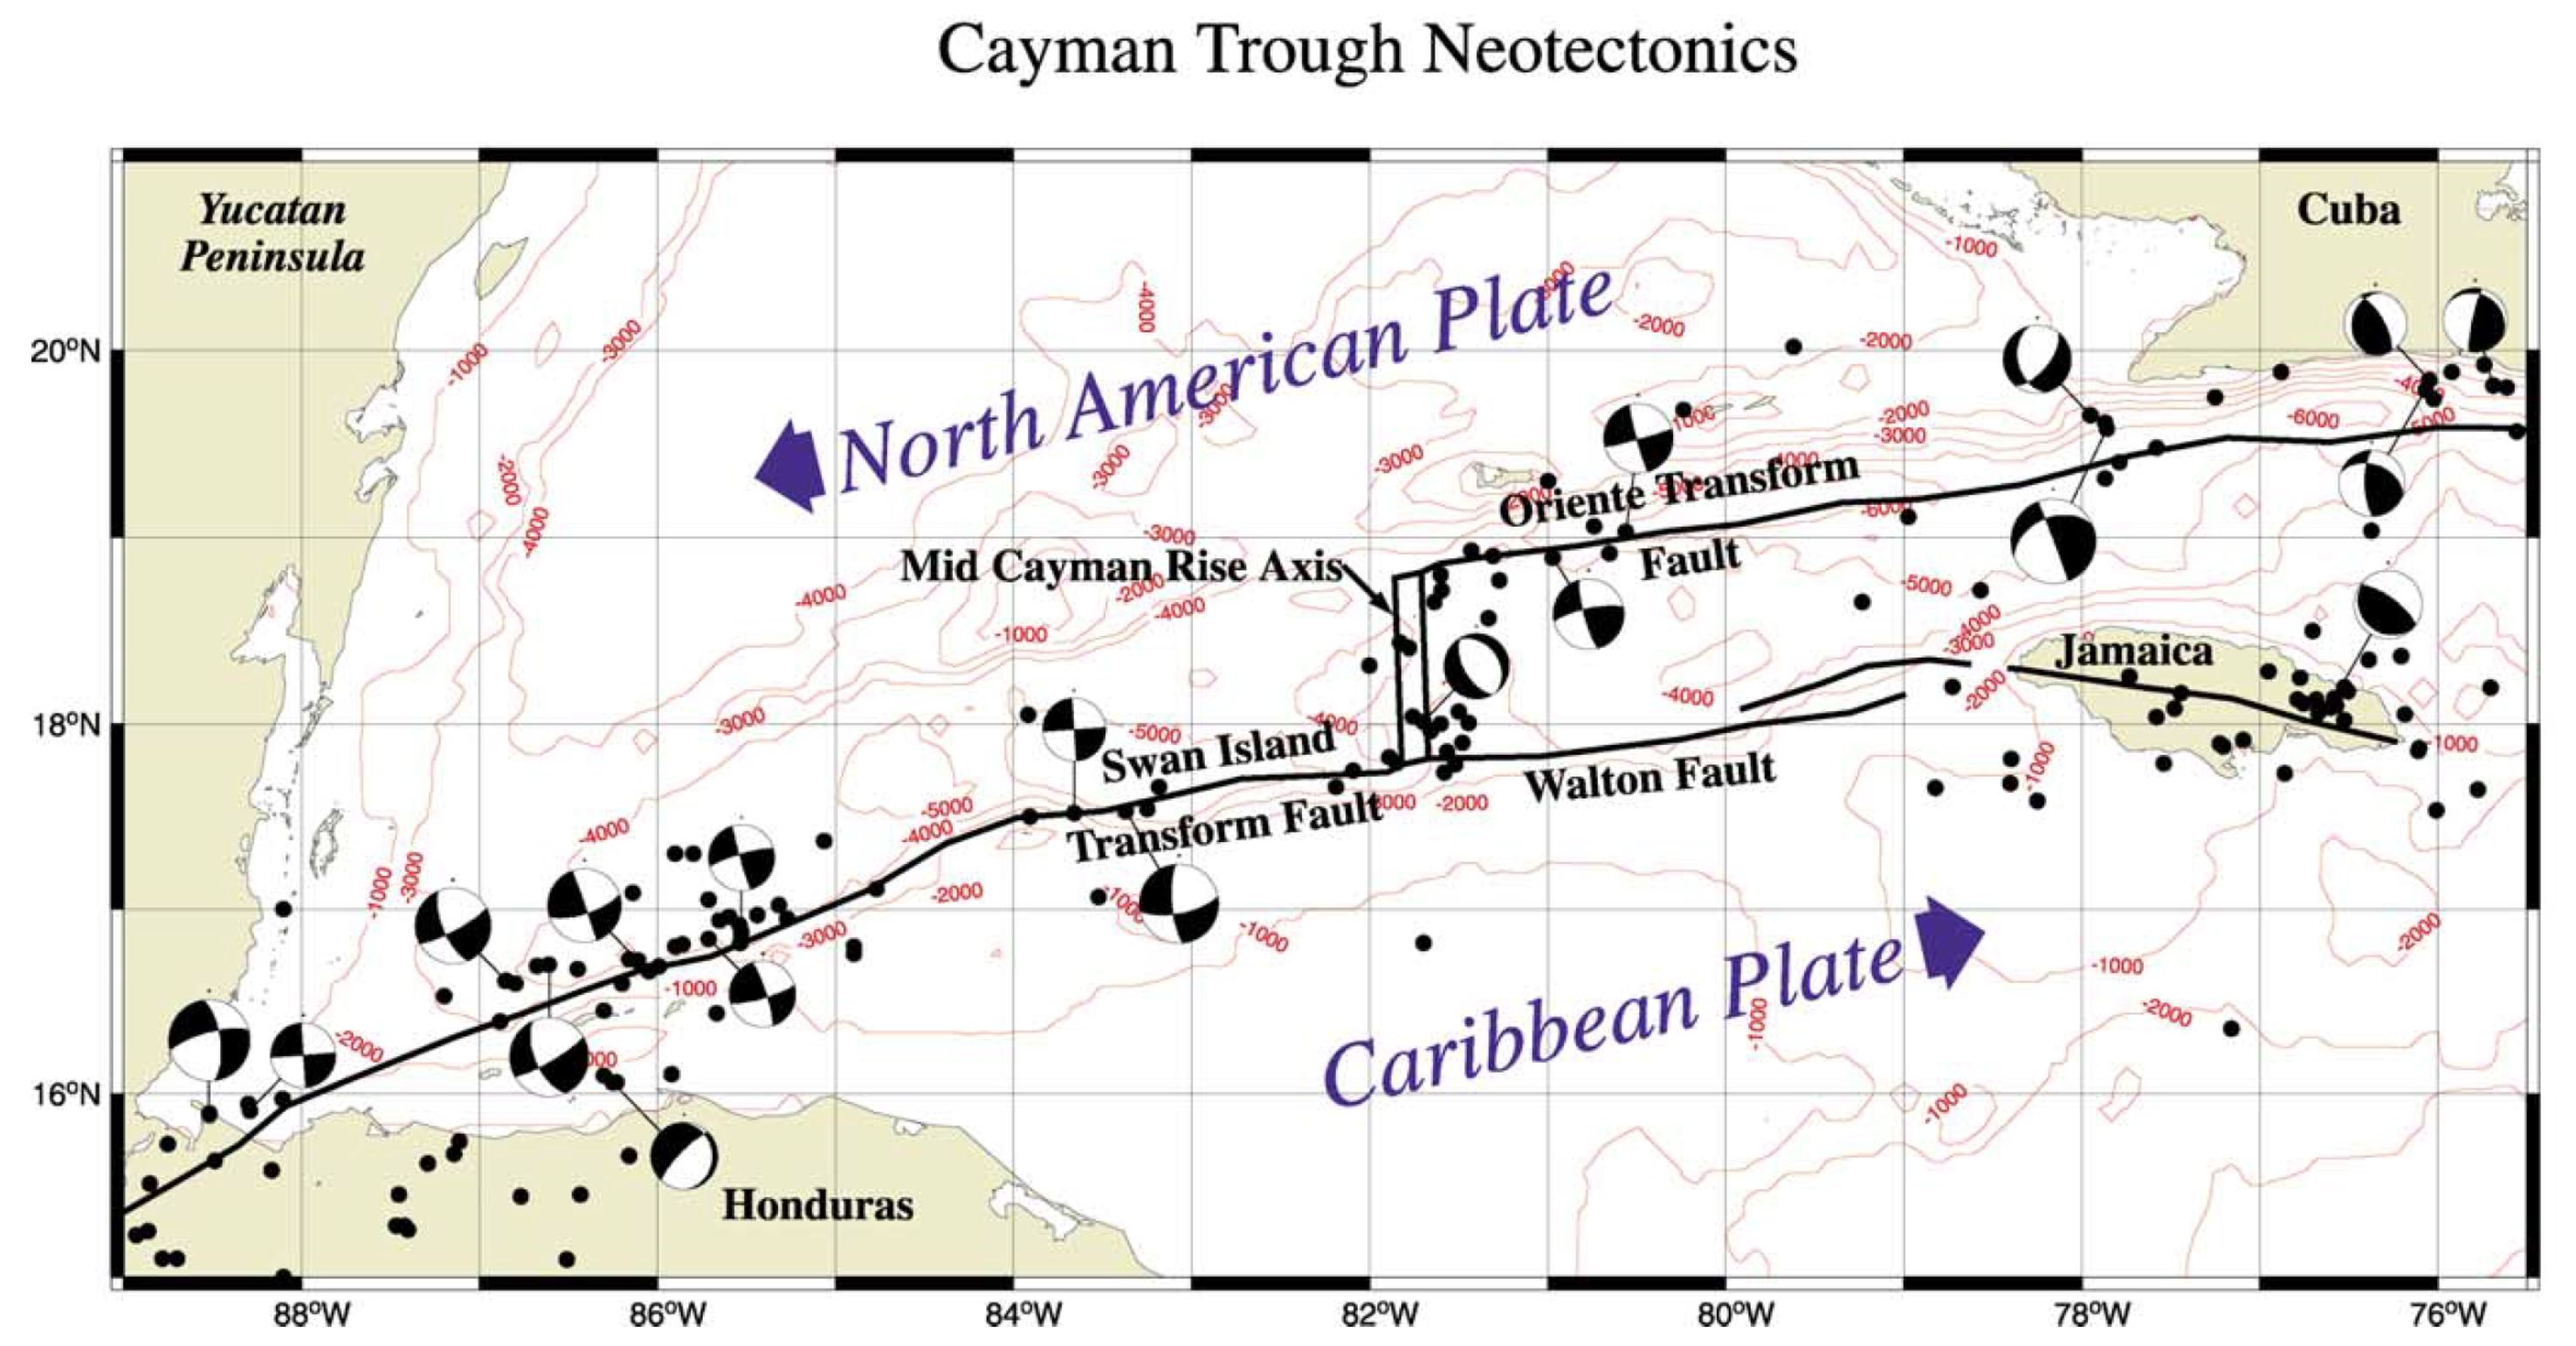
- To the right of the Symithe map is a map from Mann et al. (1991) that shows the faults and magnetic anomalies that are evidence for the oceanic spreading ridge that forms the Cayman trough.
I include some inset figures. Some of the same figures are located in different places on the larger scale map below.
- Here is the map with a month’s seismicity plotted.

Other Report Pages
Shaking Intensity
- Here is a figure that shows a more detailed comparison between the modeled intensity and the reported intensity. Both data use the same color scale, the Modified Mercalli Intensity Scale (MMI). More about this can be found here. The colors and contours on the map are results from the USGS modeled intensity. The DYFI data are plotted as colored dots (color = MMI, diameter = number of reports).
- In the upper panel is the USGS Did You Feel It reports map, showing reports as colored dots using the MMI color scale. Underlain on this map are colored areas showing the USGS modeled estimate for shaking intensity (MMI scale).
- In the lower panel is a plot showing MMI intensity (vertical axis) relative to distance from the earthquake (horizontal axis). The models are represented by the green and orange lines. The DYFI data are plotted as light blue dots. The mean and median (different types of “average”) are plotted as orange and purple dots. Note how well the reports fit the green line (the model that represents how MMI works based on quakes in California).
- Below the map and the lower plot is the USGS MMI Intensity scale, which lists the level of damage for each level of intensity, along with approximate measures of how strongly the ground shakes at these intensities, showing levels in acceleration (Peak Ground Acceleration, PGA) and velocity (Peak Ground Velocity, PGV).
- Here is the tectonic map from Symithe et al. (2015). I include their figure caption below in blockquote.
- Here is the tectonic map from Garcia-Casco et al. (2011). I include their figure caption below in blockquote.
- This is another map showing earthquake history, fault location, and earthquake slip direction from Calais et al. (2016). Note how the relative plate motion near Puerto Rico is oriented parallel to the plate boundary (the Puerto Rico trench). This suggests that most of the plate motion would result in strike-slip earthquakes. However, the relative motion is oblique, so subduction zone earthquakes are still possible.
- Here is a map from Calais et al., 2023 that shows the regional tectonics of the Greater Antilles.
- From top to bottom, the maps show the seismicity, the earthquake mechanisms, and the GPS plate velocities (see more about geodesy further down in the report).
- Here is a map from Calais et al., 2023 that shows the earthquake mechanisms associated with the Oriente fault.
- Most of the mechanisms show the left-lateral strike-slip motion along this fault. Though there are some compressional mechanisms (reverse faults) that are in places where the strike-slip fault changes orientation in a way that causes compression.
- Here is the map from Mann et a. (1991). Note how today’s earthquake is in an area that may have overlapping faults of different types.
- This is a map from ten Brink et al., 2002. Earthquake mechanisms are plotted for events along the Oriente, Sean Island, and Walton faults along the Cayman trough.
- This map shows the gravity anomaly map for the region from ten Brink et al. (2002).
- Gravity data can reveal the subsurface structures.
Some Relevant Discussion and Figures
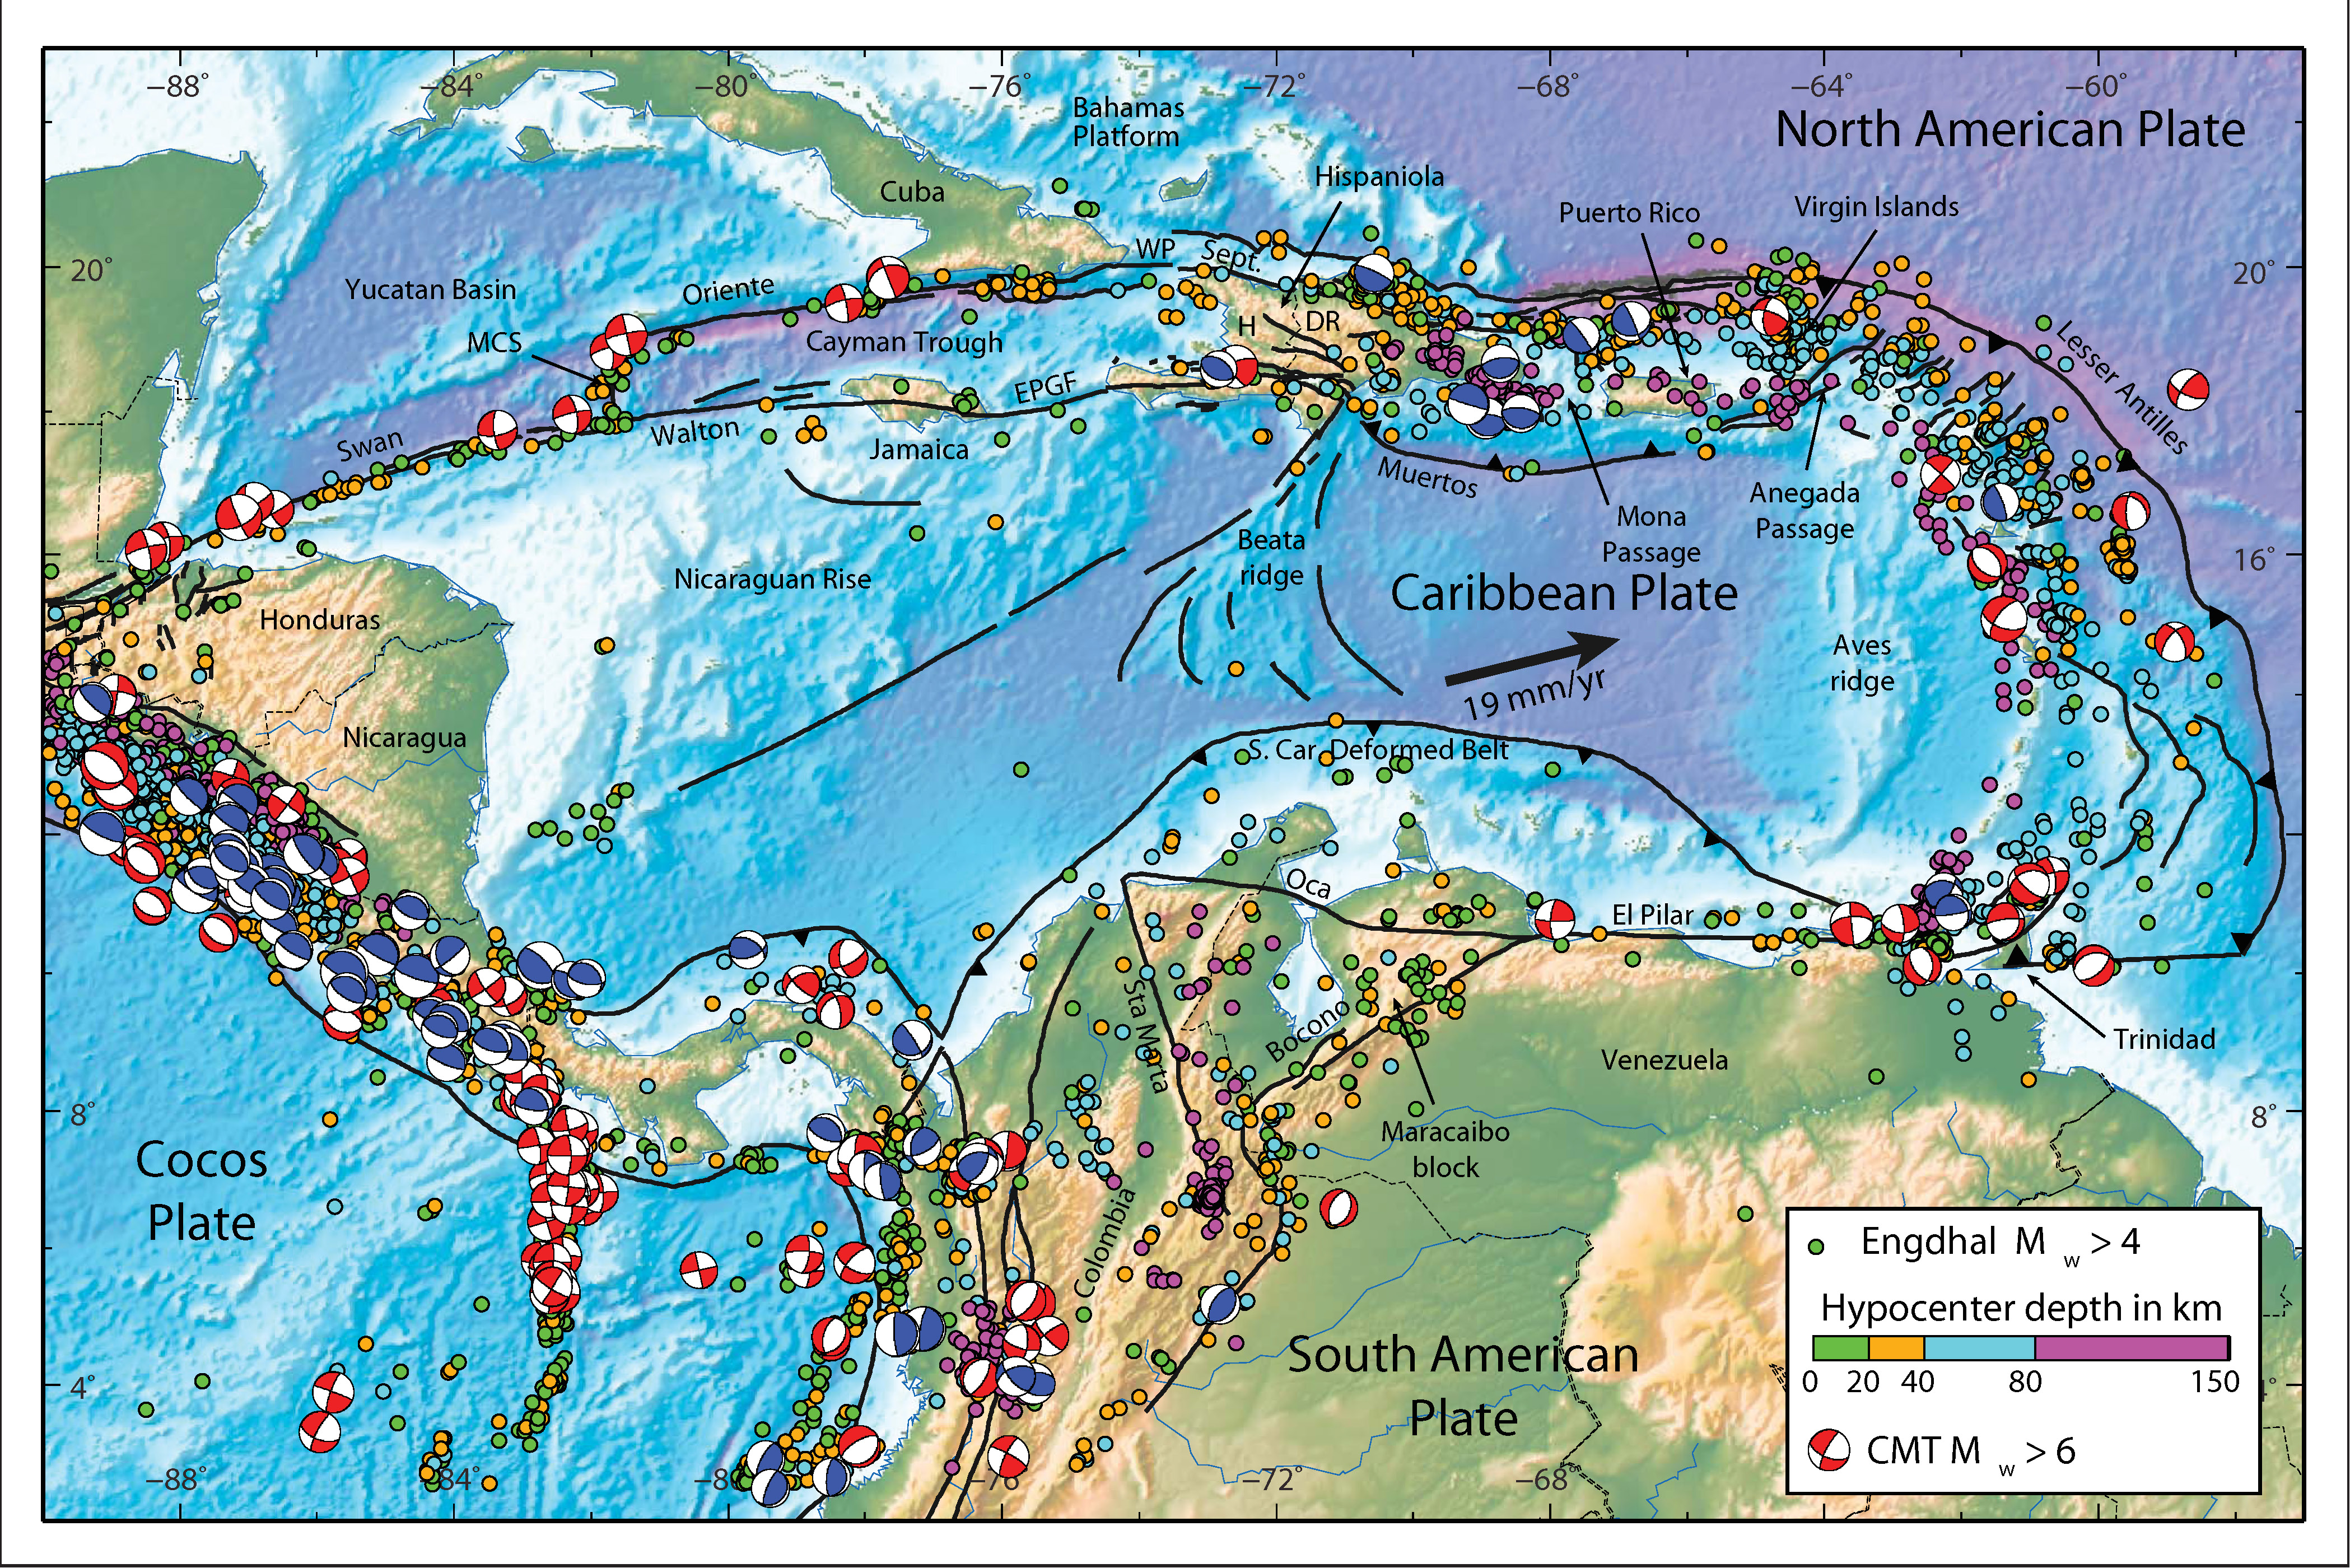
Seismotectonic setting of the Caribbean region. Black lines show the major active plate boundary faults. Colored circles are precisely relocated seismicity [1960–2008, Engdahl et al., 1998] color coded as a function of depth. Earthquake focal mechanism are from the Global CMT Catalog (1976–2014) [Ekstrom et al., 2012], thrust focal mechanisms are shown in blue, others in red. H = Haiti, DR = Dominican Republic, MCS = mid-Cayman spreading center, WP = Windward Passage, EPGF = Enriquillo Plaintain Garden fault.

Plate tectonic configuration of the Caribbean region showing the location of the study cases presented in this issue (numbers refer to papers, arranged as in the issue), and other important geological features of the region (compiled from several sources).

Seismicity and kinematics of the NE Caribbean. The inset shows Caribbean and surrounding plates, red arrows show relative motions in cm/yr: a: NEIC seismicity 1974–2015 is shown with circles colored as a function of depth, stars show large (M > 7) instrumental and historical earthquakes; b: red and blue bars show earthquake slip vector directions derived from the gCMT database [www.globalcmt.org], black arrows show the present-day relative motion of the NA plate with respect to the Caribbean.
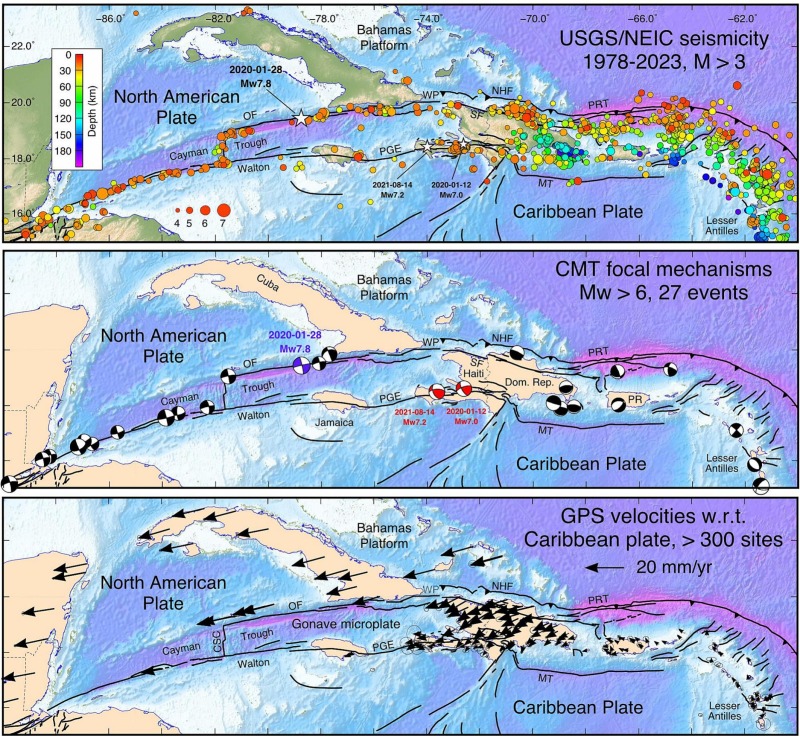
Seismotectonic and plate kinematic setting of the Northern Caribbean plate boundary. Top: 1978 to 2023 seismicity along the Northern Caribbean plate boundary according to the USGS/NEIC catalog, M>3. Note the earthquake cluster north of Cuba (81oW/21oN) and the M<6 events along the western continuation of the Puerto Rico -- North Hispaniola trench round 75oW/20.5oN), which are discussed in the text. Center: source mechanisms for earthquakes with a moment magnitude greater than 6, according to the gCMT catalog. Bottom: GNSS-derived velocities with respect to the Caribbean plate. Note the transition from shallow strike-slip events and plate boundary kinematics west of ~74oW, to a combination of strike-slip and plate-boundary-shortening east of that longitude. OF: Oriente fault, WP: Windward Passage, SF: Septentrional fault, EPG: Enriquillo-Plantain Garden fault, NHF: North Hispaniola fault, PRT: Puerto Rico trench, MT: Muertos trench, CSC: Cayman spreading center, PR: Puerto Rico.
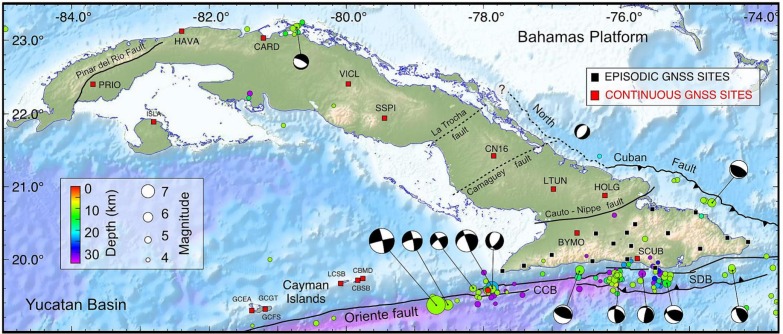
Seismotectonic map of Cuba and its surrounding showing the major active and potentially active faults (discussion in the text), the location of the GNSS sites (continuous and episodic) used in this study, the M>3 seismicity from 1978 to 2023 from the USGS/NEIC catalog, and the focal mechanisms for M>5 earthquakes from the CMT database. One exception is the Mw4.7, Dec 17 2022 normal faulting on a NE-SW oriented fault plane off the North Cuban fault at the toe of the Bahamas Platform. CCB: Cabo Cruz basin, SDB: Santiago Deformed Belt.

A. Tectonic map of Cayman trough region showing strike-slip faults (heavy lines), oceanic crust (gray) in Cayman trough, and magnetic anomaly identifications (numbered bars) (after Rosencrantz et a., 1988). Arrows show relative displacement directions. Fault zones: OFZ – Oriente; DFZ- Dunvale; EPGFZ – Enriquillo-Plantain Garden; WFZ – Walton; SIFZ – Swan Islands; MFZ – Motagua. Bl. Late Miocene reconstruction of Cayman trough. C. Early Miocene reconstruction.
(a) Major morphologic features of the Caribbean plate and its vicinity. Bathymetric data is from ETOPO-5 database. Region inside box is the study area shown in Figs. 1(b) and 4(a),(b). Tectonic interpretation is modified from Mann, Schubert, and Burke (1990). Black arrow: Caribbean plate motion relative to North America. Red arrows: plate motion vectors relative to a hotspot reference (Gripp & Gordon, 1990). (b) General bathymetry of Cayman Trough and its vicinity from ETOPO-5 database and the major faults bounding the trough. Earthquake locations are from the NGDCs Preliminary Determination of Epicenters
database.
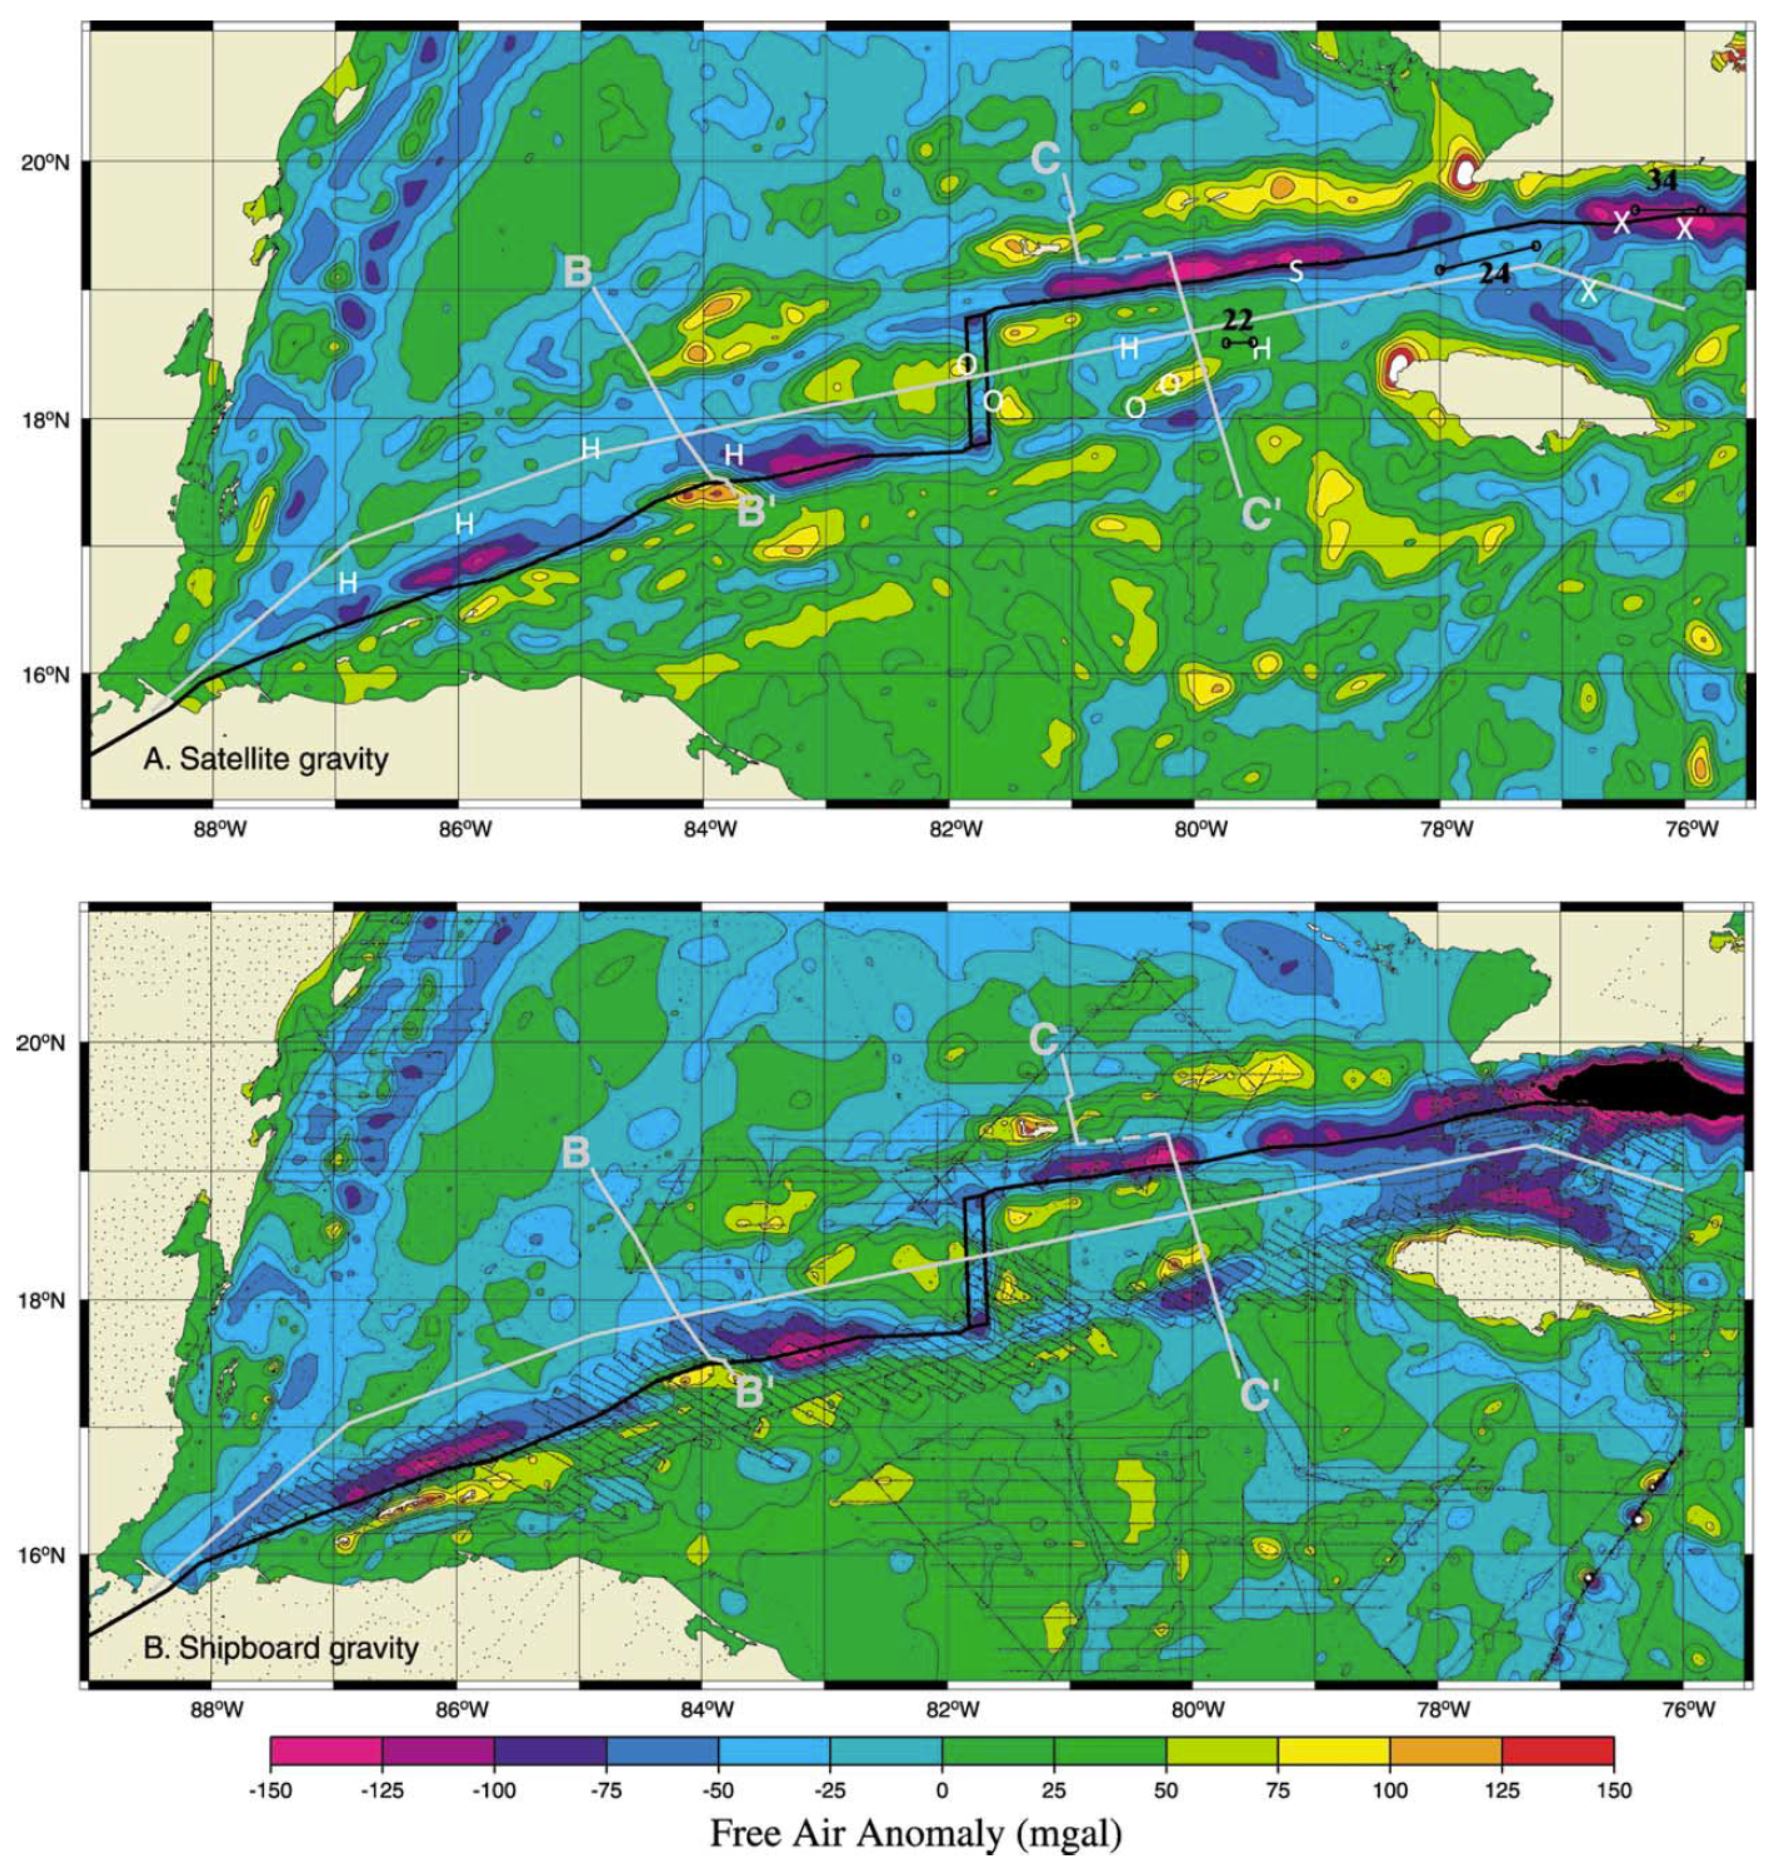
(a) Free-air gravity anomaly map of the central Cayman Trough derived from satellite altimetry data (Sandwell and Smith, 1997). Grid spacing is 1 min. Contour interval is 10 mGal. The locations of the east-west profile along Cayman Trough in Figs. 4(c) and 5 and of profiles B–B0 , and C–C0 in Fig. 4(c) are shown as gray lines. Heavy black lines: Caribbean–North America plate boundary. O, S, and X: locations where rocks with oceanic crust affinity, serpentinized peridotite, and continental crust affinity were dredged, respectively (Perfit and Heezen, 1978). H: locations of heat flow measurements shown in Fig. 8. Numbered lines with open circles are locations of two-ship reversed seismic refraction profiles of Ewing et al. (1960). (b) Free-air gravity anomaly map of the central Cayman Trough from shipboard gravity data. Tracklines and individual points that were used to create the map are shown as thin lines and dots. Heavy lines are as in Fig. 4(a). The data were gridded at 1-min blocks. See text for further details about the processing. (c) Comparison between satellite (solid line) and shipboard (short-dashed line) free-air gravity anomalies derived from their respective gridded data sets along the profiles shown in Fig. 4(a) and (b). The actual shipboard gravity measurements along profiles B–B0 and C–C0 (long-dashed lines) are shown for comparison. The origin in profiles B–B0 and C–C0 is located at their crossings with the east–west profile.
- This plot shows the GPS observations in the Caribbean. Symithe et al. (2015) used these data to estimate the amount of seismogenic coupling (how much the faults are “locked”) in the region.
Geodesy
Geodesy is the study of how the Earth deforms with time. This science goes back many years and has been based on different types of technology through time.
The basic principle is that measurements are made between positions on the surface of the Earth. These same measurements are made at a later time. If the positions moved over time, we can estimate the rate of movement for that position.
Modern geodetic technology is in the form of GPS or GNSS observations made for these positions (sometimes called “benchmarks”),
The maps below have GPS observations for benchmarks across the Caribbean. The rates of motion are represented by arrows.
These arrows have a direction that they point that represents the direction these positions are moving and have a length that represents the rate (the speed, or velocity) that the benchmark is moving.
These arrows are called vectors. The vectors show the direction the different plates move, relative to a fixed reference frame. Every vector is measured relative to some position somewhere.

(top) GPS velocities used in the model shown with respect to the North American plate defined by the velocity of 25 GPS sites located in the stable interior of the plate [Calais et al., 2006]. (bottom) GPS velocities shown with respect to the Caribbean plate as defined in the best fit block model described in the text. Error ellipses are 95% confidence. Blue arrows show GPS velocities from Pérez et al. [2001] in Venezuela because of their large uncertainty and the lack of common sites with our solution, which prevents us from rigorously combining them to our solution. They are not used in the model but used to show that they are consistent with the rest of the velocity field.
- 2016.01.17 1900-2016 Summary northern Caribbean
- 2025.02.08 M 7.6 Cayman Islands
- 2024.11.10 M 6.8 Cuba
- 2021.08.14 M 7.2 Haiti
- 2020.01.28 M 7.7 Cayman Islands
- 2020.01.07 M 6.4 Puerto Rico
- 2019.09.24 M 6.0 Puerto Rico (Mona Passage) Poster
- 2018.08.21 M 7.3 Venezuela
- 2018.01.10 M 7.6 Cayman Trough
- 2016.01.17 M 5.1 pair Cuba
- 2010.01.12 M 7.0 Haiti
Caribbean
General Overview
Earthquake Reports
Social Media
- Frisch, W., Meschede, M., Blakey, R., 2011. Plate Tectonics, Springer-Verlag, London, 213 pp.
- Hayes, G., 2018, Slab2 – A Comprehensive Subduction Zone Geometry Model: U.S. Geological Survey data release, https://doi.org/10.5066/F7PV6JNV.
- Holt, W. E., C. Kreemer, A. J. Haines, L. Estey, C. Meertens, G. Blewitt, and D. Lavallee (2005), Project helps constrain continental dynamics and seismic hazards, Eos Trans. AGU, 86(41), 383–387, , https://doi.org/10.1029/2005EO410002. /li>
- Jessee, M.A.N., Hamburger, M. W., Allstadt, K., Wald, D. J., Robeson, S. M., Tanyas, H., et al. (2018). A global empirical model for near-real-time assessment of seismically induced landslides. Journal of Geophysical Research: Earth Surface, 123, 1835–1859. https://doi.org/10.1029/2017JF004494
- Kreemer, C., J. Haines, W. Holt, G. Blewitt, and D. Lavallee (2000), On the determination of a global strain rate model, Geophys. J. Int., 52(10), 765–770.
- Kreemer, C., W. E. Holt, and A. J. Haines (2003), An integrated global model of present-day plate motions and plate boundary deformation, Geophys. J. Int., 154(1), 8–34, , https://doi.org/10.1046/j.1365-246X.2003.01917.x.
- Kreemer, C., G. Blewitt, E.C. Klein, 2014. A geodetic plate motion and Global Strain Rate Model in Geochemistry, Geophysics, Geosystems, v. 15, p. 3849-3889, https://doi.org/10.1002/2014GC005407.
- Meyer, B., Saltus, R., Chulliat, a., 2017. EMAG2: Earth Magnetic Anomaly Grid (2-arc-minute resolution) Version 3. National Centers for Environmental Information, NOAA. Model. https://doi.org/10.7289/V5H70CVX
- Müller, R.D., Sdrolias, M., Gaina, C. and Roest, W.R., 2008, Age spreading rates and spreading asymmetry of the world’s ocean crust in Geochemistry, Geophysics, Geosystems, 9, Q04006, https://doi.org/10.1029/2007GC001743
- Pagani,M. , J. Garcia-Pelaez, R. Gee, K. Johnson, V. Poggi, R. Styron, G. Weatherill, M. Simionato, D. Viganò, L. Danciu, D. Monelli (2018). Global Earthquake Model (GEM) Seismic Hazard Map (version 2018.1 – December 2018), DOI: 10.13117/GEM-GLOBAL-SEISMIC-HAZARD-MAP-2018.1
- Silva, V ., D Amo-Oduro, A Calderon, J Dabbeek, V Despotaki, L Martins, A Rao, M Simionato, D Viganò, C Yepes, A Acevedo, N Horspool, H Crowley, K Jaiswal, M Journeay, M Pittore, 2018. Global Earthquake Model (GEM) Seismic Risk Map (version 2018.1). https://doi.org/10.13117/GEM-GLOBAL-SEISMIC-RISK-MAP-2018.1
- Storchak, D. A., D. Di Giacomo, I. Bondár, E. R. Engdahl, J. Harris, W. H. K. Lee, A. Villaseñor, and P. Bormann (2013), Public release of the ISC-GEM global instrumental earthquake catalogue (1900–2009), Seismol. Res. Lett., 84(5), 810–815, doi:10.1785/0220130034.
- Zhu, J., Baise, L. G., Thompson, E. M., 2017, An Updated Geospatial Liquefaction Model for Global Application, Bulletin of the Seismological Society of America, 107, p 1365-1385, https://doi.org/0.1785/0120160198
- Bruna, J.L.G., ten Brink, U.S., Munoz-Martin, A., Carbo-Gorosabel, A., and Estrada, P.L., 2015. Shallower structure and geomorphology of the southern Puerto Rico offshore margin in Marine and Petroleum Geology, v. 67, p. 30-56, http://dx.doi.org/10.1016/j.marpetgeo.2015.04.014
- Calais, E., Symithe, S., de Lepinay, B.B., Prepetit, C., 2016. Plate boundary segmentation in the northeastern Caribbean from geodetic measurements and Neogene geological observations in Comptes Rendus Geoscience, v. 348, p. 42-51, http://dx.doi.org/10.1016/j.crte.2015.10.007
- E. Calais(1), O.F. Gonzalez(2), E.D. Arango-Arias(2), B. Moreno(2), R. Palau(2), M. Cutie(2), E. Diez(2), C. 5 Montenegro(2), E. Rodriguez Roche(3), J. Garcia(3), E. Castellanos(4), S. Symithe(5,6, 2023. Current deformation along the northern Caribbean plate boundary from GNSS measurements in Cuba in Tectonophysics, v. 868, https://doi.org/10.1016/j.tecto.2023.230068
- Leroy, S., et al., 2015, Segmentation and kinematics of the North America–Caribbean plate boundary offshore Hispaniola: Terra Nova, v. 27, p. 467–478, https://doi.org/10.1111/ter.12181.
- Manaker, D.M., Calais, E., Freed, A.M., Ali, S.T., Przybylski, P., Mattioli, G., Jansma, O., Prepetit, C., de Chabalier, J.B., 2008. Interseismic Plate coupling and strain partitioning in the Northeastern Caribbean in GJI, v. 174, p. 889-903, doi: 10.1111/j.1365-246X.2008.03819.x
- McHugh, C.M., et al., 2024, Sedimentary signatures of large earthquakes along the submerged Enriquillo–Plantain Garden transpressional plate boundary, northern Caribbean: Geology, v. 52, p. 769–773, https://doi.org/10.1130/G52258.1
- Piety, L.A., Redwine, J.R., Derouin, S.A., Prentice, C.S., Kelson, K.I., Klinger, R.E., and Mahan, S., 2018. Holocene Surface Ruptures on the Salinas Fault and Southeastern Great Southern Puerto Rico Fault Zone, South Coastal Plain of Puerto Rico in BSSA, v. 108, no. 2, p. 619-638, doi: 10.1785/0120170182
- Symithe, S., E. Calais, J. B. de Chabalier, R. Robertson, and M. Higgins, 2015. Current block motions and strain accumulation on active faults in the Caribbean, J. Geophys. Res. Solid Earth, 120, 3748–3774, doi:10.1002/2014JB011779.
- Xu, X., Keller, G.R., and Guo, X., 2015. Dip variations of the North American and North Caribbean Plates dominate the tectonic activity of Puerto Rico–Virgin Islands and adjacent areas in Geological Journal, doi: 10.1002/gj.2708
References:
Basic & General References
Specific References
Return to the Earthquake Reports page.
- Sorted by Magnitude
- Sorted by Year
- Sorted by Day of the Year
- Sorted By Region