Earthquake Report: 2017 Cascadia Summary

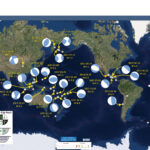
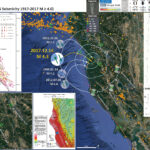
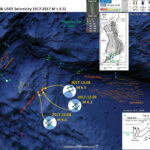
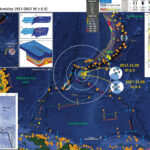
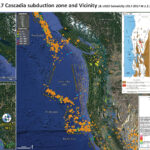
Here I summarize the seismicity for Cascadia in 2017. I limit this summary to earthquakes with magnitude greater than or equal to M 2.5. I prepared reports for 6 of the 7 earthquakes presented (using moment tensors) on the main poster below. The largest magnitude earthquake was the M 5.7 on 2017.09.22.

Below is my CSZ summary poster for this earthquake year

I present larger scale maps for the northern and southern portions of the CSZ on the left side of this interpretive poster.

    I include some inset figures in the poster.

  • In the upper right corner is a map of the Cascadia subduction zone (CSZ) and regional tectonic plate boundary faults. This is modified from several sources (Chaytor et al., 2004; Nelson et al., 2004).
  • To the left of the CSZ map, I include generalized fault map of northern California from Wallace (1990).
  • In the lower right corner I include a diagram from Wallace (1990) that shows the evolution o fhte North America-Pacific plate boundary since the past 29 million years (Ma).
  • To the right of this large scale map, I include the Earthquake Shaking Potential map from the state of California. This is a probabilistic seismic hazard map, basically a map that shows the likelihood that there will be shaking of a given amount over a period of time. More can be found from the California Geological Survey here. I place a blue star in the approximate location of today’s earthquake.


  • Here is the same map, but with USGS seismicity from 1917-2017 with magnitudes M ≥ 2.5. Note how the seismicity along the northern CSZ does not correspond well to the mapped structures. It is as if the Queen Charlotte fault is busting through from the north, as the plate boundary organizes itself.


Cascadia subduction zone: General Overview

2017 Cascadia subduction zone Earthquake Report pages

Earthquake Background Materials

  • There are three types of earthquakes, strike-slip, compressional (reverse or thrust, depending upon the dip of the fault), and extensional (normal). Here is are some animations of these three types of earthquake faults. Many of the earthquakes people are familiar with in the Mendocino triple junction region are either compressional or strike slip. The following three animations are from IRIS.

    Strike Slip:

    Compressional:

    Extensional:

  • Here is a primer that helps people learn how to interpret focal mechanisms and moment tensors. Moment tensors are calculated differently from focal mechanisms, but the interpretation of their graphical solution is similar. This is from the USGS.

  • For more on the graphical representation of moment tensors and focal mechnisms, check this IRIS video out:
  • Here is a fantastic infographic from Frisch et al. (2011). This figure shows some examples of earthquakes in different plate tectonic settings, and what their fault plane solutions are. There is a cross section showing these focal mechanisms for a thrust or reverse earthquake. The upper right corner includes my favorite figure of all time. This shows the first motion (up or down) for each of the four quadrants. This figure also shows how the amplitude of the seismic waves are greatest (generally) in the middle of the quadrant and decrease to zero at the nodal planes (the boundary of each quadrant).

Cascadia subduction zone: Earthquake Reports

  • Click on the earthquake “magnitude and location” label (e.g. “M 5.7 Explorer plate”) to go to the Earthquake Report website for any given earthquake. Click on the map to open a high resolution pdf version of the interpretive poster. More information about the poster is found on the Earthquake Report website.

2017.01.07 M 5.7 Explorer plate

  • In the past 2 days there have been a few earthquakes in the Explorer plate region along the Pacific-North America plate boundary. On March 19 of this year there was a series of earthquakes in this same region (to the southeast of today’s earthquakes). Here is my report for the March 2016 earthquakes.
  • The Cascadia subduction zone (CSZ) is an approximately 1,200-kilometer convergent plate boundary that extends from northern California to Vancouver Island, Canada (inset figure). The Explorer, Juan de Fuca, and Gorda plates are subducting eastwardly below the North American plate. Seismicity, crustal deformation, and geodesy provide evidence that the Cascadia subduction zone is locked and is capable of producing a great (magnitude greater than or equal to 8.5) earthquake (Heaton and Kanamori, 1984; McPherson, 1989; Clarke and Carver, 1992; Hyndman and Wang, 1995; Flück and others, 1997).
  • The Queen Charlotte fault (QCF) is a dextral (right-lateral) transform plate boundary (strike-slip) fault that forms the Pacific-North America plate boundary north of Vancouver Island. There have been a series of earthquakes along this fault system in the last 100 years, including earthquakes in the 1920s, 1940s, and 2010s. At its southern terminus it meets the CSZ and Explorer ridge (a spreading ridge system that forms oceanic lithosphere of the Explorer plate) to form the Queen Charlotte triple junction (QCTJ labeled on the interpretive poster below). I also include a map below showing the earthquakes with magnitudes M ≥ 7.0 for this time period. The southernmost part of the QCF also has a subduction zone beneath the strike-slip fault. This part of the boundary had a subduction zone earthquake in 2012.

  • Here is the same map, but with the seismicity from 1900-2017 plotted. These are USGS earthquakes with magnitudes M ≥ 5.0 for this time period. These are the same earthquakes plotted in the video below.

  • Here is the map with the seismicity from 1900-2017 plotted. These are USGS earthquakes with magnitudes M ≥ 7.0 for this time period. I include the moment tensors from the 2012 and 2013 earthquakes (the only earthquakes for this time period that have USGS moment tensors). The 2012 earthquake generated a tsunami. I discuss the 2012 “Haida Gwai” earthquake here.

2017.03.06 M 4.0 Cape Mendocino

  • We just had an interesting earthquake in the region of the Mendocino triple junction. Recent earthquakes in this region show different fault plane solutions, owing to complexity of this area.
  • In 1983 there was an earthquake ~10 km to the west of today’s earthquake which had a right-lateral oblique compressional focal mechanism. In 2015, there was an earthquake ~15 km to the east of today’s earthquake that also had a right-lateral strike-slip moment tensor. If today’s earthquake was oblique, it would be left-lateral extensional. Today’s earthquake is quite interesting. I will need to think about it further.

2017.06.11 M 3.5 Gorda or NAP?

  • Early this morning, I was awakened by a mild jolt. I thought, well, seems like a M 3+- nearby. I did not get out of bed. The main shaking lasted a couple of seconds, though it seemed that there was some additional shaking for several more seconds afterwards (secondary shaking? I live in the Manila Dunes, which overlie several kms of water saturated sediment.

2017.07.28 M 5.1 Gorda plate (Cascadia)

  • We just had an earthquake in the Gorda plate. The USGS magnitude is 5.1. This earthquake happened a few kilometers southwest of the 2014 M 6.8 earthquake. Based upon the orientation of the faults in the region, today’s earthquake may have occurred on the same fault as the 2014 earthquake (but it is really difficult to tell and just as likely did not).
  • The last earthquake report I prepared for a Gorda plate earthquake happened on 2016.09.25. Here is my report for that earthquake.

2017.09.22 M 5.7 Mendocino fault

  • I was driving around Eureka today, running to the appliance center to get an appliance (heheh). I got a message from a long time held friend (who lives in Salinas, CA). They asked me if I was OK, given that there was an earthquake up here. I thought I had not felt it because I was driving around. However, after looking at the USGS website, I learned the earthquake happened earlier, while I was back working on my house. The main reason I did not feel it is because it was too far away.
  • Today’s M 5.7 earthquake was along the western part of the Mendocino fault (MF), a right-lateral (dextral) transform plate boundary. This plate boundary connects the Gorda ridge and Juan de Fuca rise spreading centers with their counterparts in the Gulf of California, with the San Andreas strike-slip fault system. Transform plate boundaries are defined that they are strike-slip and that they connect spreading ridges. In this sense of the definition, the Mendocino fault and the San Andreas fault are part of the same system. Here is the USGS website for this earthquake.
  • There was a good sized (M 6.5) MF earthquake late last year on 2016.12.08. I present my poster for that earthquake below. Here is my report for that earthquake. Here is the updated report.
  • The San Andreas fault is a right-lateral strike-slip transform plate boundary between the Pacific and North America plates. The plate boundary is composed of faults that are parallel to sub-parallel to the SAF and extend from the west coast of CA to the Wasatch fault (WF) system in central Utah (the WF runs through Salt Lake City and is expressed by the mountain range on the east side of the basin that Salt Lake City is built within).
  • The three main faults in the region north of San Francisco are the SAF, the MF, and the Bartlett Springs fault (BSF). I also place a graphical depiction of the USGS moment tensor for this earthquake. The SAF, MF, and BSF are all right lateral strike-slip fault systems. There are no active faults mapped in the region of Sunday’s epicenter, but I interpret this earthquake to have right-lateral slip. Without more seismicity or mapped faults to suggest otherwise, this is a reasonable interpretation.
  • The Cascadia subduction zone is a convergent plate boundary where the Juan de Fuca and Gorda plates (JDFP and GP, respectively) subduct norteastwardly beneath the North America plate at rates ranging from 29- to 45-mm/yr. The Juan de Fuca and Gorda plates are formed at the Juan de Fuca Ridge and Gorda Rise spreading centers respectively. More about the CSZ can be found here.

  • Here is the 2016.12.08 earthquake report poster from this report.

  • Here is a video of the seismograph for this M 5.7 earthquake. The video was captured by Cindy Scammell, an undergraduate student at the Humboldt State University, Department of Geology. She is lovingly caring for her newborn. Here is a link to download the video. (3 MB mp4)
  • Abbreviations
    • BSF – Bartlett Springs fault
    • CA – California
    • CSZ – Cascadia subduction zone
    • GP – Gorda plate
    • JDFP – Juan de Fuca plate
    • MF – Mendocino fault
    • MMI – Modified Mercalli Intensity Scale
    • SAF – San Andreas fault
    • USGS – U.S. Geological Survey
    • WF – Wasatch fault

2017.12.14 M 4.3 Laytonville

  • This morning there was a small earthquake in a region of northern California between two major faults that are part of the Pacific-North America plate boundary. The M 4.3 earthquake occurred between the San Andreas fault (SAF) to the west and the Maacma fault (MF) to the east. There are no mapped earthquake faults in this region.
  • The San Andreas fault is a right-lateral strike-slip transform plate boundary between the Pacific and North America plates. The plate boundary is composed of faults that are parallel to sub-parallel to the SAF and extend from the west coast of CA to the Wasatch fault (WF) system in central Utah (the WF runs through Salt Lake City and is expressed by the mountain range on the east side of the basin that Salt Lake City is built within).
  • About 75% of the relative plate motion is accommodated along the SAF and its synthetic sister faults in the northern CA region. The rest of the plate boundary motion is accommodated along the Eastern CA shear zone and Walker Lane, along with the Central Nevada Seismic Belt, and the Wasatch fault systems. In Northern CA, there is about 33-37 mm/yr strain accumulated on the SAF plate boundary system. About 18-25 mm/yr is on the SAF, 8-11 mm/yr on the MF, and 5-7 mm/yr on the Bartlett Springs fault system (Geist and Andrews, 2000).
  • The three main faults in the region north of San Francisco are the SAF, the MF, and the Bartlett Springs fault (BSF). I also place a graphical depiction of the USGS moment tensor for this earthquake. The SAF, MF, and BSF are all right lateral strike-slip fault systems. There are no active faults mapped in the region of Sunday’s epicenter, but I interpret this earthquake to have right-lateral slip. Without more seismicity or mapped faults to suggest otherwise, this is a reasonable interpretation.

1992.04.25 M 7.1 Cape Mendocino 25 year remembrance

  • The 25 April 1992 M 7.1 earthquake was a wake up call for many, like all large magnitude earthquakes are.
  • Here is my personal story.
  • I was driving my girlfriend’s car (Jen Guevara) with her and some housemates up to attend a festival at Redwood Park in Arcata. She lived in the old blue house at the base of the bridge abutment on the southwest side of HWY 101 as it crosses Mad River. The house burned down a couple of years ago, but these memories remain. We were driving along St. Louis and about to turn east to cross the 101 towards LK Wood. The car moved left and right. I pulled over as I thought we might have just gotten a flat tire. I got out, inspected the wheels, and there was no flat. We returned to our journey. When we arrived at the park, everyone was talking about how the redwood trees were flopping around like wet spaghetti during the earthquake. I then looked back in my memory and realized that, at the lumber mill that I had parked by when I got the imaginary flat tire, there were tall stacks of milled lumber flopping around. I had dismissed it that they were blowing in the wind. Silly me.
  • Later that night, I was at a reggae concert at the Old Creamery Building in Arcata. At some point, the lights flickered off and on. I figured that someone had accidentally brushed up against the light switch on the wall. BUT, this was the first of two large aftershocks.
  • Even later that night, actually the following morning, I was laying in bed with Jen. The house typically shook when large semi trucks crossed the 101 bridge. However, this time, the shaking had a much longer duration. This was the second of the two major aftershocks. I finally recognized this earthquake as an earthquake and not something else. To my credit, I was dancing during the first major aftershock.

Cascadia subduction zone: Tectonic Background

  • Here is a map of the Cascadia subduction zone, modified from Nelson et al. (2004). The Juan de Fuca and Gorda plates subduct norteastwardly beneath the North America plate at rates ranging from 29- to 45-mm/yr. Sites where evidence of past earthquakes (paleoseismology) are denoted by white dots. Where there is also evidence for past CSZ tsunami, there are black dots. These paleoseismology sites are labeled (e.g. Humboldt Bay). Some submarine paleoseismology core sites are also shown as grey dots. The two main spreading ridges are not labeled, but the northern one is the Juan de Fuca ridge (where oceanic crust is formed for the Juan de Fuca plate) and the southern one is the Gorda rise (where the oceanic crust is formed for the Gorda plate).

  • Here is a version of the CSZ cross section alone (Plafker, 1972). This shows two parts of the earthquake cycle: the interseismic part (between earthquakes) and the coseismic part (during earthquakes). Regions that experience uplift during the interseismic period tend to experience subsidence during the coseismic period.

  • This figure shows how a subduction zone deforms between (interseismic) and during (coseismic) earthquakes. We also can see how a subduction zone generates a tsunami. Atwater et al., 2005.

  • Here is an animation produced by the folks at Cal Tech following the 2004 Sumatra-Andaman subduction zone earthquake. I have several posts about that earthquake here and here. One may learn more about this animation, as well as download this animation here.

Here are some maps of the earthquakes in this region from 1917-2017 with M ≥ 6.5.

  • This is the map used in the animation below. Earthquake epicenters are plotted (some with USGS moment tensors) for this region from 1917-2017 with M ≥ 6.5. I labeled the plates and shaded their general location in different colors.
  • I include some inset maps.
    • In the upper right corner is a map of the Cascadia subduction zone (Chaytor et al., 2004; Nelson et al., 2004).
    • In the upper left corner is a map from Rollins and Stein (2010). They plot epicenters and fault lines involved in earthquakes between 1976 and 2010.


    Here are the USGS websites for all the earthquakes in this region from 1917-2017 with M ≥ 6.5.

  • 1922.01.31 13:17 M 7.3
  • 1923.01.22 09:04 M 6.9
  • 1934-07-06 22:48 M 6.7
  • 1941-02-09 09:44 M 6.8
  • 1949-03-24 20:56 M 6.5
  • 1954-11-25 11:16 M 6.8
  • 1954-12-21 19:56 M 6.6
  • 1980-11-08 10:27 M 7.2
  • 1984-09-10 03:14 M 6.7
  • 1984-09-10 03:14 M 6.6
  • 1991-07-13 02:50 M 6.9
  • 1991-08-17 22:17 M 7.0
  • 1992-04-25 18:06 M 7.2
  • 1992-04-26 07:41 M 6.5
  • 1992-04-26 11:18 M 6.6
  • 1994-09-01 15:15 M 7.0
  • 1995-02-19 04:03 M 6.6
  • 2005-06-15 02:50 M 7.2
  • 2005-06-17 06:21 M 6.6
  • 2010-01-10 00:27 M 6.5
  • 2014-03-10 05:18 M 6.8
  • 2016-12-08 14:49 M 6.5
  • Here is a figure from Chaytor et al. (2004) that shows how they interpret the different faults based upon bathymetric data. Note the north-south striking faults in the northern part of the Gorda plate. However, they are normal faults, not strike slip. So, this makes it more difficult (again) to interpret today’s M 3.5 earthquake.

  • A: Mapped faults and fault-related ridges within Gorda plate based on basement structure and surface morphology, overlain on bathymetric contours (gray lines—250 m interval). Approximate boundaries of three structural segments are also shown. Black arrows indicated approximate location of possible northwest- trending large-scale folds. B, C:
    Uninterpreted and interpreted enlargements of center of plate showing location of interpreted second-generation strike-slip faults and features that they appear to offset. OSC—overlapping spreading center.

  • Here is another figure from Chaytor et al. (2004) that shows the different models for the Gorda plate faults.

  • Models of brittle deformation for Gorda plate overlain on magnetic anomalies modified from Raff and Mason (1961). Models A–F were proposed prior to collection and analysis of full-plate multibeam data. Deformation model of Gulick et al. (2001) is included in model A. Model G represents modification of Stoddard’s (1987) flexural-slip model proposed in this paper.

Cascadia subduction zone Earthquake Reports


San Andreas fault

Basin and Range

References

  • Atwater, B.F., Musumi-Rokkaku, S., Satake, K., Tsuju, Y., Eueda, K., and Yamaguchi, D.K., 2005. The Orphan Tsunami of 1700—Japanese Clues to a Parent Earthquake in North America, USGS Professional Paper 1707, USGS, Reston, VA, 144 pp.
  • Burgette, R. et al., 2009. Interseismic uplift rates for western Oregon and along-strike variation in locking on the Cascadia subduction zone in Journal of Geophysical Research, v. 114, B01408, doi:10.1029/2008JB005679
  • Chaytor, J.D., Goldfinger, C., Dziak, R.P., and Fox, C.G., 2004. Active deformation of the Gorda plate: Constraining deformation models with new geophysical data: Geology v. 32, p. 353-356.
  • Dengler, L.A., Moley, K.M., McPherson, R.C., Pasyanos, M., Dewey, J.W., and Murray, M., 1995. The September 1, 1994 Mendocino Fault Earthquake, California Geology, Marc/April 1995, p. 43-53.
  • Frisch, W., Meschede, M., Blakey, R., 2011. Plate Tectonics, Springer-Verlag, London, 213 pp.
  • Geist, E.L. and Andrews D.J., 2000. Slip rates on San Francisco Bay area faults from anelastic deformation of the continental lithosphere, Journal of Geophysical Research, v. 105, no. B11, p. 25,543-25,552.
  • Goldfinger, C., Nelson, C.H., Morey, A., Johnson, J.E., Gutierrez-Pastor, J., Eriksson, A.T., Karabanov, E., Patton, J., Gràcia, E., Enkin, R., Dallimore, A., Dunhill, G., and Vallier, T., 2012. Turbidite Event History: Methods and Implications for Holocene Paleoseismicity of the Cascadia Subduction Zone, USGS Professional Paper # 1661F. U.S. Geological Survey, Reston, VA, 184 pp.
  • Irwin, W.P., 1990. Quaternary deformation, in Wallace, R.E. (ed.), 1990, The San Andreas Fault system, California: U.S. Geological Survey Professional Paper 1515, online at: http://pubs.usgs.gov/pp/1990/1515/
  • McCrory, P. A., Blair, J. L., Oppenheimer, D. H., and Walter, S. R., 2006. Depth to the Juan de Fuca slab beneath the Cascadia subduction margin; a 3-D model for sorting earthquakes U. S. Geological Survey
  • McLaughlin, R.J., Sarna-Wojcicki, A.M., Wagner, D.L., Fleck, R.J., Langenheim, V.E., Jachens, R.C., Clahan, K., and Allen, J.R., 2012. Evolution of the Rodgers Creek–Maacama right-lateral fault system and associated basins east of the northward-migrating Mendocino Triple Junction, northern California in Geosphere, v. 8, no. 2., p. 342-373.
  • Nelson, A.R., Asquith, A.C., and Grant, W.C., 2004. Great Earthquakes and Tsunamis of the Past 2000 Years at the Salmon River Estuary, Central Oregon Coast, USA: Bulletin of the Seismological Society of America, Vol. 94, No. 4, pp. 1276–1292
  • Plafker, G., 1972. Alaskan earthquake of 1964 and Chilean earthquake of 1960: Implications for arc tectonics in Journal of Geophysical Research, v. 77, p. 901-925.
  • Rollins, J.C. and Stein, R.S., 2010. Coulomb stress interactions among M ≥ 5.9 earthquakes in the Gorda deformation zone and on the Mendocino Fault Zone, Cascadia subduction zone, and northern San Andreas Fault: Journal of Geophysical Research, v. 115, B12306, doi:10.1029/2009JB007117, 2010.
  • Stoffer, P.W., 2006, Where’s the San Andreas Fault? A guidebook to tracing the fault on public lands in the San Francisco Bay region: U.S. Geological Survey General Interest Publication 16, 123 p., online at http://pubs.usgs.gov/gip/2006/16/
  • USGS Quaternary Fault Database: http://earthquake.usgs.gov/hazards/qfaults/
  • Wallace, Robert E., ed., 1990, The San Andreas fault system, California: U.S. Geological Survey Professional Paper 1515, 283 p. [http://pubs.usgs.gov/pp/1988/1434/].
  • Wang, K., Wells, R., Mazzotti, S., Hyndman, R. D., and Sagiya, T., 2003. A revised dislocation model of interseismic deformation of the Cascadia subduction zone Journal of Geophysical Research, B, Solid Earth and Planets v. 108, no. 1.

Earthquake Report: 2017 Summary

Here I summarize Earth’s significant seismicity for 2017. I limit this summary to earthquakes with magnitude greater than or equal to M 6.5. There were only 6 earthquakes greater than or equal to M 7.0 in 2017 (compared to 17 for 2016) and only one earthquake larger than M 8.0. I am sure that there is a possibility that your favorite earthquake is not included in this review. Happy New Year.
However, our historic record is very short, so any thoughts about whether this year (or last, or next) has smaller (or larger) magnitude earthquakes than “normal” are limited by this small data set.

Below is my summary poster for this earthquake year

  • I include moment tensors for the earthquakes included in the reports below.
  • Click on the map to see a larger version.


2017 Earthquake Report Pages

2017 Subsidiary Earthquake Report Pages

Other Annual Summaries

Earthquake Background Materials

  • There are three types of earthquakes, strike-slip, compressional (reverse or thrust, depending upon the dip of the fault), and extensional (normal). Here is are some animations of these three types of earthquake faults. Many of the earthquakes people are familiar with in the Mendocino triple junction region are either compressional or strike slip. The following three animations are from IRIS.

    Strike Slip:

    Compressional:

    Extensional:

  • Here is a primer that helps people learn how to interpret focal mechanisms and moment tensors. Moment tensors are calculated differently from focal mechanisms, but the interpretation of their graphical solution is similar. This is from the USGS.

  • For more on the graphical representation of moment tensors and focal mechnisms, check this IRIS video out:
  • Here is a fantastic infographic from Frisch et al. (2011). This figure shows some examples of earthquakes in different plate tectonic settings, and what their fault plane solutions are. There is a cross section showing these focal mechanisms for a thrust or reverse earthquake. The upper right corner includes my favorite figure of all time. This shows the first motion (up or down) for each of the four quadrants. This figure also shows how the amplitude of the seismic waves are greatest (generally) in the middle of the quadrant and decrease to zero at the nodal planes (the boundary of each quadrant).

2017 Earthquake Reports

  • Click on the earthquake “magnitude and location” label (e.g. “M 6.9 Fiji”) to go to the Earthquake Report website for any given earthquake. Click on the map to open a high resolution pdf version of the interpretive poster. More information about the poster is found on the Earthquake Report website.

    2017.01.03 M 6.9 Fiji

  • We just had a large earthquake along the West Fiji Ridge, one of the spreading ridges that forms the North Fiji Basin. Here is the USGS website for this M 7.2 earthquake.
  • This earthquake was relatively shallow and, probably since it was an extensional earthquake with a relatively low magnitude, did not pose a tsunami hazard or risk. There was a tsunami with a height of ~10 cm recorded in Fiji. Here is the final tsunami threat message from the Pacific Tsunami Warning Center in Hawaii.


    2017.01.10 M 7.3 Celebes Sea

  • Catching up on some earthquake reports on a Friday night. This earthquake happened on 2017.01.10 in a region to the west of the Molluca Strait. I have reported on Molucca Strait earthquakes several times before as this is a very seismically active region. To the north and east of the Molucca Strait is a subduction zone, where the Philippine Sea plate (PSP) subducts westward beneath the Sunda plate (SP), forming the Philippine Trench. This M 7.3 earthquake is within the PSP at a depth of about 600 km. Here is the USGS web page for this earthquake.

  • This is the same poster, but includes earthquakes since 1900 with magnitudes M ≥ 6.5.


    2017.01.22 M 7.9 Bougainville

  • Last night (my time) we had a large earthquake along a plate boundary that is one of the most tectonically active regions in the world. There was an earthquake with a magntude of M 7.9 along the San Cristobal Trench (north of the South Solomon Trench). Here is the USGS website for this M 7.9 earthquake. This earthquake seems to be related to a series of earthquakes that started (at least) in December of 2016. This M 7.9 has a similar depth as the 12/17 M 7.9 further to the north. However, today’s earthquake is about 40+- km deeper than the subduction zone fault as suggested by Hayes et al. (2012).

  • There have been several observations of tsunami in the region. This table comes from the Pacific Tsunami Warning Center. There was no likelihood for a tsunami to hit the west coast of the continental USA.

  • Here is my interpretive poster from the 12/17 M 7.9 Bougainville Earthquake, possibly (probably) related to today’s M 7.9 earthquake. This is my Earthquake Report for the 12/17 earthquake.

  • Here is my interpretive poster from the 12/08 earthquake along the South Solomon Trench. This is my Earthquake Report for this M 7.8 earthquake.


    2017.03.05 M 6.5 New Britain

  • We just had an earthquake with a USGS magnitude of M 6.5 along the subduction zone formed by the convergence of the Solomon Sea plate on the south and the South Bismarck plate on the north.
  • Here is the USGS website for this M 6.5 earthquake.

  • Earlier, I discussed seismicity from 2000-2015 here. The seismicity on the west of this region appears aligned with north-south shortening along the New Britain trench, while seismicity on the east of this region appears aligned with more east-west shortening. Here is a map that I put together where I show these two tectonic domains with the seismicity from this time period (today’s earthquakes are not plotted on this map, but one may see where they might plot).


    2017.03.29 M 6.6 Kamchatka

  • This earthquake happened last night as I was preparing course materials for this morning. Initially it was a magnitude 6.9, but later modified to be M 6.6.
  • This earthquake happened in an interesting region of the world where there is a junction between two plate boundaries, the Kamchatka subduction zone with the Aleutian subduction zone / Bering-Kresla Shear Zone. The Kamchatka Trench (KT) is formed by the subduction (a convergent plate boundary) beneath the Okhtosk plate (part of North America). The Aleutian Trench (AT) and Bering-Kresla Shear Zone (BKSZ) are formed by the oblique subduction of the Pacific plate beneath the Pacific plate. There is a deflection in the Kamchatka subduction zone north of the BKSZ, where the subduction trench is offset to the west. Some papers suggest the subduction zone to the north is a fossil (inactive) plate boundary fault system. There are also several strike-slip faults subparallel to the BKSZ to the north of the BKSZ. These are shown in two of the inset maps below.


    2017.04.03 M 6.5 Botswana

  • This is a very interesting M 6.5 earthquake, which was preceded by a probably unrelated M 5.2 earthquake. Last September, there was an M 5.7 earthquake in Tanzania along the western shores of Lake Victoria. Here is my report for that earthquake.


    2017.04.24 M 6.9 Chile

  • Well, we had another earthquake in the region of a recent (yesterday and the day before) swarm offshore of Valparaiso, Chile (almost due west of Santiago, one of the largest cities in Chile). My previous report on the M 4-5 earthquakes can be found here. The earlier swarm was a series of shallower earthquakes (though some were of intermediate depth and some were deeper). The M 6.9 earthquake, in contrast, is deeper and likely on the megathrust. The slab contours are at 20 km and the hypocentral depth is 25 km (pretty good match considering the uncertainty with the location of the megathrust). Another difference is that the M 6.9 has a greater potential (likelihood, or chance) to damage people or their belongings.

  • Below are some observations of the tsunami. This comes from the Pacific Tsunami Warning Center.


    2017.04.28 M 6.9 Philippines

  • Earlier in April (2017) there was some activity in 4 different regions of the Philippines. Based upon the low magnitudes and large epicentral distances, these earthquakes were most unlikely to be directly related to each other. A couple days ago, there was an earthquake along-dip from one of these earlier swarms. Here is the USGS web page for this M 6.9 earthquake. There does not appear to have been an observed tsunami based upon a quick look at gages posted to this IOC site (though the closest 2 gages seem to have intermittent records). The along dip seismicity earlier this month was along the Philippine trench subduction zone fault. The M 6.9 earthquake appears to be related to subduction along the Cotobato trench.
  • These earthquakes are ~300 km from each other. Also, the Philippine trench swarm appears to possibly have reduced stress on the Cotobato trench, but I might be wrong. Regardless, it is probably a coincidence that these earthquakes are along dip to each other. Another coincidence is another earthquake along-dip to these earthquakes, a deep M 7.3 earthquake in the Celebes Sea in January 2017. Here is my earthquake report for this earthquake.

  • Here is my poster for the earthquakes earlier this month.


    2017.05.09 M 6.8 Vanuatu

  • There was an earthquake along the New Hebrides Trench this morning (my time in northern California). This earthquake is located deep, possibly below the subduction zone megathrust (but probably is a subduction zone earthquake). The hypocentral depth is 169 km, while the subducting slab is mapped at between 100-120 km in this location. While the slab location has some inherent uncertainty, today’s earthquake is within the range. We probably will never really know, until there is a movie made about this earthquake (surely Hollywood will know).
  • There was an earthquake on 2015.10.20 that has a similar moment tensor with a slightly larger magnitude (M 7.1). There was also a sequence of earthquakes in this region in April 2016 (here is my report from 2016.04.28).


    2017.05.29 M 6.8 Sulawesi, Indonesia

  • There was a series of earthquakes in Sulawesi, Indonesia earlier today, with a mainshock having a magnitude of M 6.8. This series of earthquakes is interesting as it does not occur on the main plate boundary fault, but on upper plate faults in the region. There is a major left-lateral strike-slip fault system to the west of these earthquakes (the Palu-Koro fault).
  • Part of this being interesting is that the orientation of the earthquake is oblique to some estimates of the orientation of extension in this region. The M 6.8 earthquake shows an extensional earthquake with extension oriented ~north-south. Some estimate extension in the upper plate to be northeast-southwest (Bellier et al., 2006), while others estimate extension in the upper plate to be oriented parallel to the M 6.8 earthquake (e.g. Walpersdorf et al., 1998). Spencer (2010) also documented normal faults in the upper plate that may also be correctly oriented for this M 6.8 earthquake. However, looking at the SRTM topographic data using the GeoMapApp, there is a structural grain that appears oriented to the extension estimated by Bellier et al., 2006.


    2017.06.02 M 6.8 Aleutians

  • This earthquake happened a couple weeks ago, but was interesting and I have been looking forward to following up on this with a report. Here is the USGS website for this M 6.8 earthquake.
  • The M 6.8 earthquake happened in a region where the Pacific-North America plate boundary transitions from a subduction zone to a shear zone. To the east of this region, the Pacific plate subducts beneath the North America plate to form the Alaska-Aleutian subduction zone. As a result of this subduction, a deep oceanic trench is formed. To the west of this earthquake, the plate boundary is in the form of a shear zone composed of several strike-slip faults. The main fault that is positioned in the trench is the Bering-Kresla shear zone (BKSZ), a right-lateral strike-slip fault. In the oceanic basin to the north of the BKSZ there are a series of parallel fracture zones, also right-lateral strike-slip faults.
  • My initial thought is that the entire Aleutian trench was a subduction zone prior to about 47 million years ago (Wilson, 1963; Torsvik et al., 2017). Prior to 47 Ma, the relative plate motion in the region of the BKSZ would have been more orthogonal (possibly leading to subduction there). After 47 Ma, the relative plate motion in the region of the BKSZ has been parallel to the plate boundary, owing to the strike-slip motion here. However, Konstantinovskaia (2001) used paleomagnetic data for a plate motion reconstruction through the Cenozoic and they have concluded that there is a much more complicated tectonic history here (with strike-slip faults in the region prior to 47 Ma and other faults extending much farther east into the plate boundary). When considering this, I was reminded that the relative plate motion in the central Aleutian subduction zone is oblique. This results in strain partitioning where the oblique motion is partitioned into fault-normal fault movement (subduction) and fault-parallel fault movement (strike-slip, along forearc sliver faults). The magmatic arc in the central Aleutian subduction zone has a forearc sliver fault, but also appears to have blocks that rotate in response to this shear (Krutikov, 2008).
  • There have been several other M ~6 earthquakes to the west that are good examples of this strike-slip faulting in this area. On 2003.12.05 there was a M 6.7 earthquake along the Bering fracture zone (the first major strike-slip fault northeast of the BKSZ). On 2016.09.05 there was a M 6.3 earthquake also on the Bering fracture zone. Here is my earthquake report for the 2016 M 6.3 earthquake. The next major strike-slip fault, moving away from the BKSZ, is the right-lateral Alpha fracture zone. The M 6.8 earthquake may be related to this northwest striking fracture zone. However, aftershocks instead suggest that this M 6.8 earthquake is on a fault oriented in the northeast direction. There is no northeast striking strike-slip fault mapped in this area and the Shirshov Ridge is mapped as a thrust fault (albeit inactive). There is a left-lateral strike-slip fault that splays off the northern boundary of Bowers Ridge. If this fault strikes a little more counter-slockwise than is currently mapped at, the orientation would match the fault plane solution for this M 6.8 earthquake (and also satisfies the left-lateral motion for this orientation). The bathymetry used in Google Earth does not reveal the orientation of this fault, but the aftershocks sure align nicely with this hypothesis.

  • Here is the interpretive poster from the 2016.09.05 M 6.3 #EarthquakeReport.

  • On 2017.05.08 there was an earthquake further to the east, with a magnitude M 6.2. Here is my interpretive poster for this earthquake, which includes fault plane solutions for several historic earthquakes in the region. These fault plane solutions reveal the complicated intersection of these two different types of faulting along this plate boundary. Here is my earthquake report for this earthquake sequence.


    2017.06.14 M 6.9 Guatemala

  • There was a really cool earthquake sequence a few days ago on and offshore of Guatemala. Offshore of Guatemala in the Pacific Ocean, the Cocos plate subducts beneath the North America and Caribbean plates (NAP & CP). The transform plate boundary between the NAP and CP forms the Motagua-Polochic fault zone onshore, which bisects Guatemala.
  • From late May 2017 through mid June there were several earthquakes with the largest magnitude M = 5.5. These earthquake hypocenters have depths that are deeper and shallower than the estimated depth for the subduction zone fault (Hayes et al., 2012), but many of the earthquakes simply have a default depth of 10 km. So it is difficult to say if these are all near the megathrust or are on upper plate faults (e.g. in the accretionary prism). These earthquakes have compressional fault plane solutions. Either way, they appear to have loaded some faults down-dip along the subducting slab. This may or may not be the case, but there was a deep extensional magnitude M 6.9 earthquake (with an aftershock of M = 5.1 nearby). These along dip earthquakes are probably related.


    2017.06.22 M 6.8 Guatemala

  • This morning we had an earthquake offshore of Guatemala with a magnitude M = 6.8. Here is the USGS website for this earthquake. This earthquake occurred to the east of a sequence from about a week ago. Here is my earthquake report for that sequence.
  • Offshore of Guatemala is a subduction zone thrust fault, where the Cocos plate dives east beneath the North America (in the north) and Caribbean plates (in the south). Subduction zone faults are capable of generating the largest magnitude earthquakes possible because the fault width is wider than other faults. The seismogenic zone, the region of the crust that can store elastic strain and experience brittle rupture during earthquakes, extends into the earth several tens of kms. Strike-slip faults generally dip vertically, giving them the narrowest fault width. While subduction zones dip at an angle, so their fault width is wider. Earthquake magnitude is a measure of energy released during the earthquake and the moment magnitude (the magnitude most people use) is based on three factors: (1) fault area, (2) fault slip, and (3) shear modulus (how flexible, or rigid, the crust/lithosphere is). Fault area is length times width. Length is the distance on the ground surface that the fault ruptures and width is the distance into the earth that the fault ruptures. Because subduction zone faults dip into the earth at an angle, the distance that they extend before reaching a given depth is larger, owing to a larger possible magnitude.
  • Today’s M 6.8 earthquake has a USGS hypocentral depth of ~47 km, which is very close to the depth of the subduction zone fault. Also, the fault plane solution (moment tensor, read below) is compressional. Thus, I interpret this earthquake to be a subduction zone earthquake at or near the megathrust. This earthquake is different from the sequence from a week ago. Those earthquakes had two populations: (1) earthquakes in the accretionary prism of the subduction zone and (2) earthquakes in the downgoing Cocos plate. Those earthquakes were not subduction zone earthquakes (though the shallower earthquakes may not have had well located hypocenters, so their depths are suspect… and could have been on the subduction zone). I suspect that this M 6.8 earthquake is related to the earthquakes from last week. I include the moment tensors for 2 of the significant earthquakes from last week. See my report for more on that sequence.


    2017.07.17 M 7.7 Aleutians

    2017.07.17 M 7.7 Aleutians UPDATE #1

  • We just had an earthquake along the western Aleutian Islands, very close to the international date line. In this region places often have more than two names, depending upon who drew the map.
  • The majority of the Aleutian Islands are volcanic arc islands formed as a result of the subduction of the Pacific plate beneath the North America plate. To the west, there is another subduction zone along the Kuril and Kamchatka volcanic arcs. These subduction zones form deep sea trenches (the deepest parts of the ocean are in subduction zone trenches). Between these 2 subduction zones is another linear trough, but this does not denote the location of a subduction zone. The plate boundary between the Kamchatka and Aleutian trenches is the Bering Kresla shear zone (BKSZ).
  • The oceanic basin, Komandorsky Basin, to the north of the BKSZ has been mapped with northwest trending fracture zones, most of which are fossil or inactive. However, due to the oblique convergence west of Bowers Ridge, some of these fossil fracture zones are being reactivated. Based upon offsets in magnetic anomalies in the oceanic crust forming the basement of Komandorsky Basin, these fracture zones show left-lateral offsets. However, the active strike-slip faults (and BKSZ) are right lateral. This is a great example of strike-slip faults reactivating as strike-slip faults.
  • The mainshock was preceded earlier this day with several foreshocks and occurred very close to a M 6.3 earthquake from 9 months ago (2016.09.05). In addition, there was seismic activity to the east about 6 weeks ago (2017.06.02 M 6.8).
  • Some place a tear in the downgoing Pacific plate (beneath Kamchatka) in the position of the Bering Kresla Shear zone. This marks the end of the modern Kamchatka subduction zone. However, there was a subduction zone further to the west of the active arc, which extended further to the north and possibly involved subduction of the oceanic crust forming the Komandorsky Basin. The combination of offsets along the right-lateral strike-slip faults to the north of the BKSZ, along with the convergence along the Kamchatka Trench, there is a fold and thrust belt (a zone of compressional tectonics). There was an M 6.6 earthquake earlier this year (2017.03.29), which is somewhat related to this fold and thrust belt.
  • There was a tsunami recorded at the tide gage on Shemya Island, with an observed maximum wave height of 0.3 ft! This is interesting given the strike slip earthquake.

  • UPDATE #1:

  • Well, based upon a comment on twitter, I thought it prudent to review the seismicity of this region at the westernmost part of the western Aleutian Islands. For many years I considered this region part of the subduction zone that forms the Aleutian Trench. In the past couple of years, there have been a number of earthquakes that reveal this to not be the case. Rather, the Pacific-North America plate boundary in this region is in the form of a shear zone, distributed across several reactivated fracture zones. I noticed a plot from Jascha Polet and found another article that evaluates this plate boundary (Davaille and Lees, 2004).

  • Here is my interpretive poster for my 2016.03.29 M 6.6 #EarthquakeReport.


    2017.07.20 M 6.7 Turkey

  • We just had a good shaker in western Turkey. At the moment, there are over 400 reports of ground shaking to the USGS “Did you Feel It?” web page. The USGS PAGER report estimates that there may be some casualties (though a low number of them), but that the economic loss estimate is higher (35% chance of between 10 and 100 million USD).
  • This earthquake appears to have been along a normal fault named either the Bodum fault (NOA; Helenic Seismic Network) or the Ula-Oren fault (GreDASS; Greek Database of Seismogenic Sources). The inset map shows the faults and fault planes from the GreDASS database. A third name for this fault is the Gökova fault (Kurt et al., 1999).
  • Here is the USGS website for this earthquake.
  • There is lots of information on the European-Mediterranean Seismological Centre (EMSC) page here.

  • Here is the same poster, but with USGS earthquake epicenters from 2007-2017 with magnitude M ≥ 4.5.

  • There was a small tsunami recorded at the Bodum tide gage. Here is the source.


    2017.09.08 M 8.1 Chiapas, Mexico

    2017.09.08 M 8.1 Chiapas, Mexico Update #1

    2017.09.23 M 8.1 Chiapas, Mexico Update #2

  • While I was spending time with my friend Steve Tillinghast (he is getting married on Saturday), there was a Great Earthquake offshore of Chiapas, Mexico. This is one of four M 8 or greater earthquakes ever recorded along the subduction zone forming the Middle American Trench. There has recently been some seismic activity to the east of this current M 8.1 earthquake. These earthquakes happened near the boundary between the North America (NAP) and Caribbean (CP) upper plates.
  • This M 8.1 earthquake happened in a region of the subduction zone that is interpreted to have a higher coupling ratio than further to the south (higher proportion of the plate convergence rate is accumulated as elastic strain due to seismogenic coupling of the megathrust fault). Faults that are aseismic (fully slipping) have a coupling ratio of zero. The Polochic-Motagua fault zone marks this NAP-CP boundary. The recent seismicity offshore of Guatemala (June 2017) comprised a series of thrust earthquakes along the upper megathrust, along with some down-dip extensional faulting.
  • Tonight’s earthquake will be a very damaging and deadly earthquake and, based upon the shake map, possibly more damaging than either the 1985 or 1995 earthquakes. The 1985 earthquake caused severe damage in Mexico City. The PAGER alert shows an estimate of 34% probability for between 1000 and 10,000 fatalities. However, please read below about the PAGER alert and go to the USGS website about PAGER alerts (link below). These are just model based estimates of damage, so we won’t really know the damage until this is evaluated with “boots on the ground.” One might consider PAGER alerts to be the “armchair estimate” of damage. Thanks to Dr. Lori Dengler for reviewing my report (though any mistakes are only to be credited to me).
  • This M 8.1 earthquake is deeper than the megathrust fault and has an extensional moment tensor. This is not a megathrust earthquake, but is related to slip on a fault in the downgoing Cocos plate. At this depth, it may be due to bending in the downgoing oceanic lithosphere.
  • There is no danger of a tsunami here along the west coast of the U.S. West Coast, British Colombia, or Alaska. There have been some tsunami observations/

  • Here is the same poster, but shows seismicity with earthquakes of smaller magnitudes (M 7).

  • Below is the record from the most proximal tide gage to the earthquake in Salina Cruz, Oaxaca, Mexico.

  • UPDATE #1:

  • Well, after about 4 hours sleep, my business partner woke me up to talk about the fire alarms we were installing in a rental (#safetyfirst). Now that I have had some breakfast, I here provide some additional observations that people have made since I prepared my initial report.
  • Below I present some figures about the Tehuantepec Seismic Gap (as before, but with additional figures). The impetus for this is two fold: (1) it is interesting for earthquake geologists as they consider earthquake recurrence patterns, globally and (2) that the M 8.1 earthquake was not a subduction zone earthquake and may have loaded the megathrust.

  • Here are two views of the earthquake as recorded on Humboldt State University Department of Geology’s Baby Benioff seismometer. The photos are from Dr. Lori Dengler and were taken in the hallway in Van Matre Hall. Click on the image for a high res version (2 and 5 MB files).


  • Here is an updated list of observations of the trans-Pacific tsunami.

  • This is an update of the tide gage record at Salina Cruz in Oahaca, Mexico. It has been 15 hours and the tsunami waves are still significant (not as large amplitude as the initial few waves, but still potentially dangerous).

  • UPDATE #2:

  • Well, we had a really interesting earthquake today. There was a M 6.1 earthquake in the North America plate (NAP) to the north of the sequence offshore of Chiapas, with the M 8.1 mainshock. Here is the USGS website for the M 6.1 earthquake. There was also an M 5.8 earthquake that was a more typical aftershock (USGS website).


    2017.09.19 M 7.1 Puebla, Mexico

    2017.09.19 M 7.1 Puebla, Mexico Update #1

  • Earlier today there was a large earthquake associated in some way with the subduction zone forming the Middle America Trench. There is currently some debate about what plate this earthquake occurred within, but it appears to be an intraplate earthquake within the downgoing Cocos plate (CP), beneath the North America plate (NAP).
  • I initially thought that this was unrelated to the recent M 8.1 earthquake offshore of Chiapas, Mexico. This is due to my view of aftershocks, that they typically occur within 2 rupture lengths of the mainshock and that they need to be on the same fault (or nearby synthetic fault). However, upon discussing this on twitter, Dr. Susan Hough suggests that this need not be the case, referring to Richter, “Charles Richter observed in the ’50s that distant aftershocks could be part of local sequences set into motion by early triggered quakes.” My initial view was also based upon the slab contours (depth contours to the top of the subducting plate, as published by Hayes et al., 2012), which are discontinuous in this region. This suggested that the earthquake was in the upper plate, the NAP. However, upon discussions with Dr. Stephen Hicks, he suggested people refer to Gérault et al. (2015) that show how the subducting slab (the CP) is flat in this region. This evidence may place the M 7.1 earthquake within the CP.

  • This shows the MMI contours for the 1985 M 8.0 earthquake.

  • This version includes the MMI contours for the 2017.09.08 M 8.1 earthquake.

  • Here is a comparison of the modeled intensities for three earthquakes, the 1985, 1999, and today’s M 7.1 earthquakes.

  • UPDATE #1:

  • Well, the responses of people who are in the midst of a deadly disaster have been inspiring, bringing tears to my eyes often. Watching people searching and helping find survivors. This deadly earthquake brings pause to all who are paying attention. May we learn from this disaster with the hopes that others will suffer less from these lessons.
  • I have been discussing this earthquake with other experts, both online (i.e. the twitterverse, where most convo happens these days) and offline. Many of these experts are presenting their interpretations of this earthquake as it may help us learn about plate tectonics. While many of us are interested in learning these technical details, I can only hope that we seek a similar goal, to reduce future suffering. Plate tectonics is a young science and we have an ultra short observation period (given that the recurrence of earthquakes can be centuries to millenia, it may take centuries or more to fully understand these processes).
  • Here I present a review of the material that I have seen in the past day and how I interpret these data. The main focus of the poster is a comparison of ground shaking for three earthquakes. Also of interest is the ongoing discussion about how the 2019.09.08 M 8.1 Chiapas Earthquake and this M 7.1 Puebla Earthquake relate to each other. My initial interpretation holds, that the temporal relations between these earthquakes is coincidental (but we now have the analysis to support this interpretation!).

  • Here is a video of the seismic waves, as they are being recorded, on the Baby Benioff seismograph in Van Matre Hall at Humboldt State University, Department of Geology. This was provided via the unofficial HSU geology facebook page, uploaded by Dr. Mark Hemphill-Haley. Here is a link to the 10 MB mp4 file for downloading.
  • Here is what Dr. Mark Hemphill-Haley wrote about this video.
  • M 7.1 Puebla, Mexico earthquake at 11:14 AM PDT as recorded on the HSU Baby Benioff. The video is showing the surface waves arriving at campus, preceded by the P-waves at the beginning and S-waves immediately prior to the large amplitude waves. Our thoughts are with people in Mexico.


    2017.10.31 M 6.8 Loyalty Islands

    2017.11.19 M 6.8 Loyalty Islands Update #1

  • BOO! Happy Halloween/Samhain….
  • I am on the road and worked on this report while on layovers with intermittent internets access… Though this earthquake sequence spanned a day or so, so it is good that it took me a while to compile my figures.

  • UPDATE #1:

  • I just got back from one of the best conferences that I have ever attended, PATA Days 2017 (Paleoseismology, Active Tectonics, and Archeoseismology). This conference was held in Blenheim, New Zealand and was planned to commemorate the 300 year anniversary of the 1717 AD Alpine fault earthquake (the possibly last “full” margin rupture of the Alpine fault, a strike-slip plate boundary between the Australia and Pacific plates, with a slip rate of about 30 mm per year, tapering northwwards as synthetic strike slip faults splay off from the AF). While the meeting was being planned, the 2016 M 7.8 Kaikoura earthquake happened, which expanded the subject matter somewhat.
  • Prior to the meeting, we all attended a one day field trip reviewing field evidence for surface rupture and coseismic deformation and landslides from the M 7.8 earthquake in the northern part of the region. The road is still cut off and being repaired, so one cannot drive along the coast between Blenheim and Christchurch (will be open in a few months). During the meeting, there were three days of excellent talks (check out #PATA17 on twitter). Following the meeting, a myajority of the group attended a three day field trip to review the geologic evidence as reviewed by earthquake geologists here of historic and prehistoric earthquakes on the Alpine fault and faults along the Marlborough fault zone (faults that splay off the Alpine fault, extracting plate boundary motion from the Alpine fault). The final day we saw field evidence of rupture from the M 7.8 earthquake, including a coseismic landslide, which blocked a creek. The creek later over-topped some adjacent landscape, down-cutting and exposing stratigraphy that reveals evidence for past rupture on that fault. The trip was epic and the meeting was groundbreaking (apologies for the pun).
  • This region of the southern New Hebrides subduction zone is formed by the subduction of the Australia plate beneath the Pacific plate. There has been an ongoing earthquake sequence since around Halloween (I prepared a report shortly after I arrived in New Zealand; here is my report for the early part of this sequence). Today there was the largest magnitude earthquake in the sequence. This M 7.0 earthquake generated a tsunami measured on tide gages in the region. However, there was a low likelihood of a transpacific tsunami. The sequence beginning several weeks ago included outer rise extension earthquakes and associated thrust fault earthquakes along the upper plate. I have discussed how the lower/down-going plates in a subduction zone flex and cause extension in this flexed bulge (called the outer rise because it bulges up slightly). Here is my report discussing a possibly triggered outer rise earthquake associated with the 2011 M 9.0 Tohoku-oki earthquake. Here is my report for this M 6.0 earthquake from 2016.08.20.
  • While looking into this further today, I found that there was a similar sequence (to the current sequence) in 2003-2004. For both sequences, there is an interplay between the upper and lower plates, with compressional earthquakes in the upper plate and extensional earthquakes in the lower plate. Based upon the 2003-2004 sequence, it is possible that there may be a forthcoming compressional earthquake. However, there are many factors that drive the changes in static stress along subduction zones and how that stress may lead to an earthquake (so, there may not be a large earthquake in the upper plate). This is just a simple comparison (albeit for a section of the subduction zone in close proximity).


    2017.11.04 M 6.8 Tonga

  • Well, I was just getting ready for bed and saw the PTWC email notification. It took a couple minutes before the USGS email notification came through, but the earthquake was already listed on the website. By the time the ENS email came in, the magnitude was adjusted, as well as the location.
  • This M 6.8 earthquake was originally reported as a deep earthquake at 80 km, but after real people took a look at the data, the depth was also adjusted.
  • It is interesting that this earthquake happened just a few days after the sequence to the west, though these earthquakes are probably too far away to be related. Here is my report from a couple days ago. I include the interpretive poster from that earthquake below today’s interpretive poster. I use some of the same figures for both of these posters since they are each in a similar region of the world. Then, moments later, there was an M 5.5 in the Loyalty Islands region. Hmmmmm.
  • Today’s M 6.8 earthquake did occur near the earthquake from 2009 (almost immediately down-dip of the 2009 earthquake), an M 8.1 earthquake in the downgoing slab, that caused a large and damaging tsunami in the Samoa Islands.


    2017.11.07 M 6.5 Papua New Guinea

  • Well. As I was preparing a job application at the library public wifi (the Airbnb I was staying at did not have wifi in my cabin, nor electricity for that matter), I prepared an interpretive poster for this earthquake. Interestingly, the library prevented any ftp connections, so I had to wait until today to upload my files.
  • This M 6.5 earthquake (here is the USGS website for this earthquake) happened in a region of Papua New Guinea (PNG) that has a long record of different types of tectonic deformation (including subduction, strike-slip, and several fold and thrust belts). To the northwest, in 1998, there was an earthquake that triggered a submarine landslide, which generated a large, devastating, and deadly tsunami. Here is the USGS website for this 1998 M 7.0 earthquake.
  • There are historic earthquakes to the west of this M 6.5 that are associated with the fold and thrust belt, but this M 6.5 earthquake is too deep to be associated with a possibly eastern extension of this fold and thrust belt. womp womp.
  • However, there have been a few earthquakes that are more closely (spatially) related to the 2017.11.07 M 6.5 earthquake. On 1986.06.24 there was an M 7.2 earthquake (here is the USGS website for this earthquake) to the southeast. These two earthquakes both have similar fault plane solutions (a moment tensor for the 2017 earthquake and a focal mechanism for the 1986 earthquake) and nearly identical depths. These deep earthquakes are deeper than we would expect for a subduction zone fault, so are possibly related to internal deformation within the downgoing slab. The subduction zone associated with the New Guinea (NG) trench (associated with the 1998 landslide tsunami earthquake) may or may not extend into this region (The Holm et al. (2016) figure below shows it does now). There is a fossil subduction zone (the Melanesian or Manus Trench) to the east of the NG trench, but this is also probably unrelated.
  • The best candidate is the downgoing slab associated with the New Britain Trench. This subduction zone is formed by the northward motion of the Solomon Sea plate beneath the South Bismarck plate (in the region of New Britain), but to the west, this fault splays into three mapped thrust faults that trend on land in eastern PNG. This is the slab imaged beneath where the epicenters are plotted for both 1986 and 2017 earthquakes. The Holm et al. (2016) figure has an inactive splay that more optimally (geometrically) is suited to fit these two earthquakes. There is a figure in the poster (and plotted below) that shows the geometry of this downgoing slab.

    2017.11.12 M 7.3 Iran

    2017.12.01 M 6.1 Iran

  • A month and a half ago, I was attending the PATA conference and an earthquake hit Iran and Iraq the night before our first field trip. Thus, I did not have the time to address this earthquake at the time. I am preparing this report in support of my annual summary.
  • This was a damaging earthquake and is the most deadly for 2017. Over 500 people were killed and thousands were injured.

  • There was an earthquake in Iran a few weeks later. I prepared a report here and the poster update is below.


    2017.12.08 M 6.5 Caroline Ridge

  • There was an earthquake sequence beginning 2017.12.08 along the northern flank of Caroline Ridge in the western Pacific Ocean, near the intersection of the Mariana and Yap trenches.
  • The two largest earthquakes, M 6.5 and M 6.4, are both strike-slip earthquakes. The M 6.5 is northeast of the M 6.4, so maybe this represents a northeast striking left lateral earthquake. But I rank this a low certainty interpretation. I did not find any geologic maps of this region that might show geologic structures that we might associate with this seismicity, so it is difficult to know if the alternate solution is correct (northwest striking left-lateral strike slip). However, there is possibly a transform (strike-slip) plate boundary fault associated with the southern boundary of the Caroline Ridge (this interpretation is based upon my interpretation of the “Age of Oceanic Lithosphere” map below). There may be synthetic faults to this transform boundary fault, ones sub-parallel to the main fault (the red faultline with purple arrows showing sense of motion). In this case, I would interpret the M 6.5 and M 6.4 earthquakes as northwest striking left-lateral earthquakes.
  • The Yap and Mariana trenches are formed by the subduction of the Pacific plate beneath the Philippine Sea plate.
  • The Caroline Islands are volcanic islands formed when the Pacific plate passed over a hotspot (Rehman et al., 2013). As in Hawaii (and other young hotspot volcanic island chains), the younger islands are to the east. The westward movement of this oceanic ridge, formed similar in fashion to the Ninetyeast Ridge, has interacted with the subduction zone in a way that has indented the trench. Prior to the ridge hitting the trench, the Mariana trench may have extended further south. As the ridge interacted with the subduction zone, the megathrust fault moved westwards, offsetting the trench and forming the Yap Trench. There is a great illustration from Fujiwara et al. (2000) below.
  • There are fossil oceanic spreading ridges within the Caroline plate. These show up in the bathymetry and evidenced by the magnetic anomaly data.


    2017.12.15 M 6.5 Java

  • This morning (my time) there was a deep earthquake along the subduction zone beneath Java. The M 6.5 earthquake hypocentral depth is deeper than the subduction zone megathrust fault, so it is the downgoing Australia plate (AP).
  • My initial interpretation was that this earthquake is a strike-slip earthquake related to reactivated transform faults/fracture zones in the subducting AP. So, I did a little searching for prior historic earthquakes in the region to see what they might tell us about the tectonics of the subducting AP in this region. Given my knowledge of the fracture zones in the AP to the west, these fracture zones are ~north-south in orientation. Thus, my first interpretation was that this M 6.5 earthquake was a left-lateral strike-slip earthquake on a north-northwest striking (oriented) fault.
  • However, looking into these historic earthquakes, there are two good analogues. On 2001.05.25 there was an earthquake with magnitude of M 6.3 to the east of today’s M 6.5 earthquake, with a similar depth relation to the downgoing plate (it was also within the AP). This M 6.3 has a similarly oriented moment tensor.
  • Then I found a deeper earthquake (that plots closer to the depth of the downgoing AP, but does not have a thrust moment tensor, so is probably in the AP). This earthquake has a fault slip model from the USGS, where they inverted seismic data to interpret the M 7.5 earthquake to be a left-lateral strike-slip earthquake on an ~east-west fault. This did not fit my hypothesis about north-south fracture zones. So, I realized I needed to look at the magnetic anomaly data (and any other sources about the structures in the AP south of Java).
  • The fracture zones are differently oriented south of Java. In the Hall (2011) inset map in the interpretive poster, the fracture zones are oriented to the northwest, and the normal faults associated with spreading ridge tectonics are oriented to the northeast. So, perhaps the M 7.5 earthquake was on a reactivated spreading ridge fault and the 2017 M 6.5 and 2001 M 6.3 are on reactivated fracture zone faults. This leads me to my original interpretation, that the M 6.5 earthquake is a left-lateral strike-slip fault earthquake. Of course, this is still just an hypothesis. Since the earthquake is so deep, we will never be able to observe offset geomorphic features like we can for earthquakes on land.


2017 Earthquake Subsidiary Reports

  • There were some earthquakes that were of particular interest that did not make the magnitude threshold for the poster and discussion above. I include these here.

    2017.01.08 M 5.8 Arctic

  • There was an earthquake in the Arctic on 2017.01.08, along the channel of one of the major northwest passages. At first, I thought: “intraplate!” This earthquake is not along a plate boundary (though there are many examples of intraplate earthquakes). What led to this seismicity? Perhaps it is due to intraplate deformation along pre-existing fault systems. Perhaps it is related to internal deformation of the crust due to stressed from post-glacial rebound. I am still not sure. There is sparce historic seismicity here and I only spent a few hours looking through the literature. If anyone has an explanation, I would love to hear their ideas. One confounding factor is that this region is covered in ice at least most of the year, so there is probably a limitation to the subsurface geophysical exploration data (e.g. seismic reflection/refraction, seismic tomography, etc.).

    2017.05.01 M 6.3 British Columbia

  • This is an interesting earthquake for a number of reasons. The epicenters of the largest earthquakes in this series (M 6.2 and M 6.3) align just off-strike from the Dalton section of the Denali fault (DF) which was mapped as having offset Holocene features by Plafker et al (1977), though there were no numerical ages to support their interpretation. This is just north of the Chilkat River section of the DF and just north of the Chatham Strait section of the DF. These sections of the Denali fault have not been found to be active (though they may be and today’s earthquake sequence suggests that they are!). There are many faults mapped in this region based upon the British Columbia data catalogue.
  • The moment tensor for the M 6.3 is also slightly misaligned to the orientation (strike) of the Denali fault here. Also interesting because the USGS has been putting forth significant effort on an investigation of the Quuen Charlotte (QCF)/Fairweather fault to the south of these earthquakes. The Chatham Strait fault splinters eastwards from the QCF and connects to the Denali fault just south of this sequence. The Chatham Strait fault was recognized to have dextral slip (right-lateral strike-slip) by Hudson et al. (1982; and references therein) using offsets of geologic units. These and earlier authors found up to 150 km of separation (offset) of these post-middle Cretaceous rocks.
  • UPDATE: Dr. Rick Koehler (UNR) informs me that the Chilkat section is now included in the Dalton section of the Denali fault.

    • Dr. Sean Bemis posted this model on Sketchfab. Dr. Bemis used 1948 aerial imagery, in Agisoft Photoscan software, to create this 3-D model using the method called “Structure For Motion” (SFM). He then exported the model to Sketchfab. Agisoft has academic pricing for their software. However, there is also free software available that does the stuff the Photoscan does (though one may need to use multiple apps).
    • There is a north-south lineation that aligns nicely with the strike-line formed between the M 6.3 & M 6.2 epicenters (not shown on the 3-D model).

    2017.09.02 M 5.3 Idaho

  • We are still having a series of earthquakes in southeastern Idaho. This earthquake appears related to the Bear Valley fault (BVF) system, which is a normal fault system related to extension in the Basin and Range geomorphic province. Here is the USGS web page for this M 5.3 earthquake.
  • This part of Idaho has a geologic basement that was folded and faulted during the Sevier Orogeny, a period of compressional tectonics between approximately 140 million years (Ma) ago and 50 Ma. Basin and Range extension occurred at a much later time, in the Late Cenozoic (e.g. in northwestern Nevada, it has been demonstrated that the extension is post 15-17 Ma (Colgan et al., 2004, 2006).

    2017.11.30 M 4.1 Delaware

  • Today there was an earthquake in the state of Delaware, a region that does not have many mapped surface faults (I could not find any active faults in a couple hours of lit review). This area also does not have much historic seismicity, however there is an Open File Report from the Delaware Geological Survey, published in 2001. Today’s M 4.1 earthquake matches the record for the largest earthquake of record. There was a M 4.1 in the Wilmington, Delaware region on 1871.10.09 (see OFR42 linked above). The Wilmington region seems to be the most seismically active part of Delaware. Today’s earthquake, to the northeast of Dover, Delaware, happened in a place that has only had a single earthquake in the historic record (M 3.3 on 1879.03.26).
  • The earthquake happened along the coast plain, where the surficial geology is mapped as marsh deposits (underlain by Quaternary sediments, then by Tertiary sediments). I include a geological map below, along with a cross section. There does not appear to be any structural control for today’s earthquake (but I have only spent a couple hours on this, and the cross section is not very deep). To the south, in Maryland, there is an impact structure (from a Bolide impact). But the structures from this probably don’t extend this far north. There is probably some structures related to the active tectonics of the past (as mapped in the Appalachans to the west), and this earthquake is probably reactivating one of those structures.
  • Also, there is a possible chance that this is a foreshock. But we won’t know until later if this is the case.
  • Here is the USGS website for this 2017.11.30 M 4.1 earthquake.

Earthquake Report: Iran

A couple weeks following the earthquake in eastern Iraq, there was a sequence of earthquakes in central eastern Iran. These earthquakes are too distant to be related. The Iranian sequence includes a M 6.1 foreshock on 2017.12.01 and two M 6.0 aftershocks on 2017.12.12. Here is my report for the M 7.3 earthquake.
While putting together my annual summary for 2017, I wanted to include a poster that shows these two earthquakes as they relate to regional historic seismicity (with fault plane solutions).

Below is my interpretive poster for this earthquake.

I plot the seismicity from the past month, with color representing depth and diameter representing magnitude (see legend). I include earthquake epicenters from 1917-2017 with magnitudes M > 6.5.
I plot the USGS fault plane solutions (moment tensors in blue and focal mechanisms in orange) for the M 6.1 earthquake. I also include USGS fault plane solutions for most of the earthquakes in the region.

  • I placed a moment tensor / focal mechanism legend on the poster. There is more material from the USGS web sites about moment tensors and focal mechanisms (the beach ball symbols). Both moment tensors and focal mechanisms are solutions to seismologic data that reveal two possible interpretations for fault orientation and sense of motion. One must use other information, like the regional tectonics, to interpret which of the two possibilities is more likely. Based upon the tectonics associated with the San Andreas and Maacama faults, I interpret this M 4.3 earthquake to be a right-lateral strike-slip fault.
  • I also include the shaking intensity contours on the map. These use the Modified Mercalli Intensity Scale (MMI; see the legend on the map). This is based upon a computer model estimate of ground motions, different from the “Did You Feel It?” estimate of ground motions that is actually based on real observations. The MMI is a qualitative measure of shaking intensity. More on the MMI scale can be found here and here. This is based upon a computer model estimate of ground motions, different from the “Did You Feel It?” estimate of ground motions that is actually based on real observations.
  • I include MMI contours for most of the earthquakes that have fault plane solutions plottted.
  • I include some inset figures.

    • In the upper right comer is a map from Peretti et al. (2011) that shows the plate boundaries in this region. I place blue stars in the general location of the M 7.3 and M 6.1 earthquakes. The M 6.1 earthquake happened in a region of north striking strike slip faults.
    • In the lower left corner is a map from Javadi et al. (2013) which shows the tectonic domains for this region. I place two blue stars in the general location of the M 7.3 and M 6.1 earthquakes. The M 6.1 earthquake sequence appears related to the Kubanan or Naiband faults.


    • Here is my poster for the M 7.3 earthquake. See the Earthquake Report page for more information about the tectonics in the region.

    • Here is the tectonic map from Peretti et al. (2011).

    • Tectonic sketch map of the Persian Gulf and Arabian Peninsula, modified from Al-Husseini (2000), Ziegler (2001) and Pollastro (2003).

    • Here is the map from Javadi et al. (2013).

    • (Colour online) (a) Tectonic setting of Iran in the Middle East and presentation of major convergence vectors of the region. (b) Main sedimentary-structural zones of Iran (modified from Aghanabati, 2004). Major faults discussed in the text are shown. White and black arrows from Sella, Dixon & Mao (2002) and Vernant et al. (2004), respectively. DFS – Doruneh Fault System, MRZF – Main Zagros Reverse Fault, HZF – High Zagros Fault, MFF – Mountain Frontal Fault, ZFF – Zagros Foredeep Fault.

    • Here is a great fault map from Walker and Jackson (2004). The M 6.1 earthquake sewuence was located in the region of Fig. 8 a (shown below as a Landsat map).

    • GTOPO30 image of central and eastern Iran showing the major fault zones and geographical regions. Black and gray arrows represent Arabia-Eurasia plate motions. Rates are in millimeters per year. Black arrows are GPS estimates from Sella et al. [2002] and gray arrows represent 3 Ma magnetic anomaly plate motions which are a combination of the Africa-Eurasia plate motion from Chu and Gordon [1998] and the Africa-Arabia plate motion of DeMets et al. [1994] (see Jackson et al. [1995] for method). Arabia-Eurasia convergence occurs in the Zagros, the Alborz, and Kopeh Dagh, and possibly in central Iran by the rotation of strike-slip faults (see later discussion). Right-lateral shear between central Iran and Afghanistan is taken up on N–S right-lateral faults of the Gowk-Nayband and Sistan suture zone systems, which surround the Dasht-e-Lut. North of 34N, the right-lateral shear is taken up on left-lateral faults that rotate clockwise.

    • Here is a map showing the location of the Gowk fault, also with the geomorphology (shown on the LANDSAT map) associated with this fault system. This is the map labeled as Fig 8.

    • (a) GTOPO30 topography of the Kerman region centered on the Gowk fault (see Figure 1 for location). Fault plane solutions of shallow (<35 km) earthquakes are shown. Black solutions are events modeled using body waveforms (listed by Jackson [2001], Walker [2003], and Talebian and Jackson [2004]); dark gray represents events from the Harvard CMT catalogue with >70% double-couple component; light gray represents first-motion solutions [from McKenzie, 1972]. Zones of shortening and thrust faulting are seen both to the north of Kerman, where the Gowk fault splits into the Kuh-Banan, Lakar-Kuh, and Nayband faults, and south of Mahan, where NW–SE trending thrust faults occupy the region between the Sabzevaran and Gowk faults. These zones of intense deformation may be partly caused by rotation of crustal blocks, as marked by black arrows (see section 5.3). The box marks the location of Figure 8b. (b) Landsat TM image of the central part of the Gowk fault. Restoration of drainage and structural features indicate between 12 and 15 km of cumulative right-lateral displacement [Walker and Jackson, 2002]. Restoration of 15 km of right-lateral slip aligns dark-colored lithologies (marked X), although it is not certain that the dark-colored rocks at either side of the fault are from a single displaced unit.

    • Here is the aerial image map of this region (Walker and Jackson, 2002). The M 6.1 sequence occurred to the northeast of Fandogo.

    • LANDSAT TM image and location map of the Gowk fault region.

    • This figure shows the Walker and Jackson (2002) interpretation for the structures in the region of the Gowk fault. The M 6.1 earthquake is most likely related to the Shahad thrust fault system (also noted on the above map).

    • This is a plot from the International Seismological Center (ISC) that shows seismicity in plan view (the map) and cross sectional view.

    • Historical seismicity map based in ISC Bulletin data for yesterdays Mw 7.3 on Iran-Iraq border. Mostly shallow thrust events in a complex tectonic setting.

    • UPDATE: After chatting with Dr. Eric Fielding on twitter, I discovered a paper that he wrote discussing the faults in the region of the M 6.1 sequence. Perfect! They relate fault growth in a fold and thrust belt (Shahad thrust faults) to aseismic slip, based upon modeling (constrained by InSAR data) of the 1998.03.14 Fandoqa M 6.6 earthquake. However, given the M 6.1 sequence, we now know that all the growth is probably not aseismic.

    • A: Shaded relief topographic map of Shahdad area with active faults (medium black lines) (Walker and Jackson, 2002), XX9 profile location (thick black line), moderate earthquakes (black filled circles), four large earthquakes since 1981 (white filled circles), and fault-plane solution (upper right) for Fandoqa earthquake (Berberian et al., 2001). Rectangles with thin black lines are Fandoqa rupture (F) and Shahdad basalthrust (S) dislocations shown in other figures. Thick dashed white line—Gowk fault zone; P—central Iranian plateau; L—Lut block. B: Topographic profile and depth cross section of Fandoqa main shock, Shahdad basal thrust, and splay slip planes. Solid lines show positions of fault planes from inversion after adjustment for topography; dashed lines are unadjusted. Gray fill shows Shahdad thrust wedge.


      A: Average of two interferograms, converted to radar range change (motion in radar line of sight) in millimeters. Faults (black lines) and profile location (white line) as in Figure 1A. Rectangles (thin lines) show surface locations of Fandoqa and Shahdad basalthrust dislocation models. B: Surface deformation from Fandoqa main-shock elastic model, shown as radar range change. Large rectangle outlines area shown in C and D. C: Residual interferogram after subtracting Fandoqa main shock model shown in B. Note that color scale and area are different from A and B. Green labels are Universal Transverse Mercator zone 40 coordinates and tics are every 10 km. Thin red lines show updip projections of Fandoqa and Shahdad basal thrust to surface. Larger rectangle shows extended Shahdad basal thrust used in distributed slip inversion (Fig. 3) and Poly3D (Fig. 4). D: Surface deformation predicted by slip model of Shahdad basal thrust and splays shown in Figure 4, projected into radar line of sight. Same area and colors as C.

Here are the USGS pages for the main earthquake in this sequence.

    References

  • Allen, M.B., Saville, C., Blac, E.K-P., Talebian, M., and Nissen, E., 2013. Orogenic plateau growth: Expansion of the Turkish-Iranian Plateau across the Zagros fold-and-thrust belt in Tectonics, v. 32, p. 171-190, doi:10.1002/tect.20025
  • Fielding, E.J., Wright, T.J., Muller, J., Parsons, B.E., and Walker, R., 2004. Aseismic deformation of a fold-and-thrust belt imaged by synthetic aperture radar interferometry near Shahdad, southeast Iran in Geology, v. 32, no. 7, p. 577-580, doi: 10.1130/G20452.1
  • Giardini, D., Grunthal, G., Shedlock, K., Zhang. P., and Global Seismic Hazards Program, 1999. Global seismic hazards map: Accessed on Jan. 9, 2007 at http://www.seismo.ethz.ch/GSHAP.
  • Javadi, H. R., M. Esterabi Ashtiani, B. Guest, A. Yassaghi, M. R. Ghassemi, M. Shahpasandzadeh, and A. Naeimi (2015), Tectonic reversal of the western Doruneh Fault System: Implications for Central Asian tectonics, Tectonics, 34, 2034–2051, doi:10.1002/ 2015TC003931.
  • Jenkins, Jennifer, Turner, Bethan, Turner, Rebecca, Hayes, G.P., Sinclair, Alison, Davies, Sian, Parker, A.L., Dart, R.L., Tarr, A.C., Villaseñor, Antonio, and Benz, H.M., compilers, 2013. Seismicity of the Earth 1900–2010 Middle East and vicinity (ver 1.1, Jan. 28, 2014): U.S. Geological Survey Open-File Report 2010–1083-K, scale 1:7,000,000, https://pubs.usgs.gov/of/2010/1083/k/.
  • Perotti, C.R., S. Carruba, M. Rinaldi, G. Bertozzi, L. Feltre and M. Rahimi, 2011. The Qatar–South Fars Arch Development (Arabian Platform, Persian Gulf): Insights from Seismic Interpretation and Analogue Modelling in Earth and Planetary Sciences » Geology and Geophysics » “New Frontiers in Tectonic Research – At the Midst of Plate Convergence”, book edited by Uri Schattner, ISBN 978-953-307-594
  • Stern, R.J. and Johnson, P., 2010. Continental lithosphere of the Arabian Plate: A geologic, petrologic, and geophysical synthesis in Earth-Science Reviews, v. 101, p. 29-67.
  • Taymaz, T., Yilmaz, Y., and Dilek, Y., 2007. The geodynamics of the Aegean and Anatolia: introduction in Geological Society, London, Special Publications, v. 291; p. 1-16, doi:10.1144/SP291.1
  • Verges, J., Saura, E., Casciello, E., Fernandez, M., Villasenor, A., Jimenez-Munt, I., and Garcia-Castellanos, D., 2011. Crustal-scale cross-sections across the NW Zagros belt: implications for the Arabian margin reconstruction in Geol. Mag., v. 148, no. 5-6, p. 739-761
  • Walker, R. and Jackson, J., 2002. Offset and evolution of the Gowk fault, S.E. Iran: a major Intra-continental Strike-Slip System in Journal of Structural Geology, v. 24, p. 1677-1698.
  • Walker, R. and Jackson, J., 2004. Active tectonics and late Cenozoic strain distribution in central and eastern Iran in Tectonics, v. 23, doi:10.1029/2003TC001529
  • Woudloper, 2009. Tectonic map of southern Europe and the Middle East, showing tectonic structures of the western Alpide mountain belt.

Earthquake Report: Iraq

A month and a half ago, I was attending the PATA conference and an earthquake hit Iran and Iraq the night before our first field trip. Thus, I did not have the time to address this earthquake at the time. I am preparing this report in support of my annual summary.
This was a damaging earthquake and is the most deadly for 2017. Over 500 people were killed and thousands were injured.
I post lots of material below that was developed in the 6 weeks following the earthquake.
There is a page here with some photos of the damage: Earthquake-Report.com.

Below is my interpretive poster for this earthquake.

I plot the seismicity from the past month, with color representing depth and diameter representing magnitude (see legend). I include earthquake epicenters from 1917-2017 with magnitudes M > 6.5.
I plot the USGS fault plane solutions (moment tensors in blue) for the M 7.3 earthquake.

  • I placed a moment tensor / focal mechanism legend on the poster. There is more material from the USGS web sites about moment tensors and focal mechanisms (the beach ball symbols). Both moment tensors and focal mechanisms are solutions to seismologic data that reveal two possible interpretations for fault orientation and sense of motion. One must use other information, like the regional tectonics, to interpret which of the two possibilities is more likely. Based upon the tectonics associated with the San Andreas and Maacama faults, I interpret this M 4.3 earthquake to be a right-lateral strike-slip fault.
  • I also include the shaking intensity contours on the map. These use the Modified Mercalli Intensity Scale (MMI; see the legend on the map). This is based upon a computer model estimate of ground motions, different from the “Did You Feel It?” estimate of ground motions that is actually based on real observations. The MMI is a qualitative measure of shaking intensity. More on the MMI scale can be found here and here. This is based upon a computer model estimate of ground motions, different from the “Did You Feel It?” estimate of ground motions that is actually based on real observations.

Here are the USGS pages for the main earthquake in this sequence.

I include some inset figures.

  • In the lower right corner I include a map that shows the major plate boundary and major crustal faults in the region, as well as relative plate motions plotted as arrows (Taymaz et al.,
    2007). I place a green star in the general location of the M 7.3 earthquake. Note that this M 7.3 earthquake happened along the Bitis-Zagros Fold Belt.
  • In the upper right corner is a map that shows the results of interfereometric RADAR analyses as prepared by GSI in Japan. This map shows a region of subsidence to the southwest of the M 7.3 epicenter (the largest orange circle) and a region of uplift to the northeast of this M 7.3 earthquake. More about this map below.
  • To the left of this interferogram, I include a basic tectonic map of this region (Woudloper, 2009). Maps with local (larger) scale have much more detailed views of the faulting. I place a green star in the general location of this M 7.3 earthquake.
  • In the upper left corner are two maps that show how Earth’s surface moved during the earthquake (and shortly afterwards). The left panel shows east-west motion and the right panel shows up-down motion (this looks similar to the figure in the upper right corner.
  • In the lower left corner I place a map that shows the large scale details of the crustal faults in the Bitis-Zagros Fold Belt (Allen et al., 2013). I place a green star in the general location of this M 7.3 earthquake.
  • To the right of this fault map is a cross section A-A.’ The location of this cross section is designated by a blue line on the map in the lower left corner, as well as on the main interpretive poster map.


  • Here is a comparison between the “Did You Feel It?” map and the Shakemap. Both maps represent shaking intensity with the same scale, the MMI scale (described above). The DYFI map on the left is based on peoples’ observations as they report using the USGS DYFI website. The map on the right is the result of numerical simulations of shaking intensity. Below each map are regressions of those data.

  • This map shows the plate boundary and intraplate faults of the region. Also shown are the relative plate motions as black arrows. Note how the Bitis-Zagros Fold Belt (BZFB) is a dextral oblique (right-lateral thrust) fault system. This fault system is part of the Alpide belt, which is oriented parallel to the Arabia-Anatolia relative plate motion (ergo the strike-slip motion).

  • (a) Seismicity of the Eastern Mediterranean region and surroundings reported by USGS–NEIC during 1973–2007 with magnitudes for M . 3 superimposed on a shaded relief map derived from the GTOPO-30 Global Topography Data taken after USGS. Bathymetry data are derived from GEBCO/97–BODC, provided by GEBCO (1997) and Smith & Sandwell (1997a, b). (b) Summary sketch map of the faulting and bathymetry in the Eastern Mediterranean region, compiled from our observations and those of Le Pichon & Angelier (1981), Taymaz (1990), Taymaz et al. (1990, 1991a, b); S¸arogˇlu et al. (1992), Papazachos et al. (1998), McClusky et al. (2000) and Tan & Taymaz (2006). Large black arrows show relative motions of plates with respect to Eurasia (McClusky et al. 2003). Bathymetry data are derived from GEBCO/97–BODC, provided by GEBCO (1997) and Smith & Sandwell (1997a, b). Shaded relief map derived from the GTOPO-30 Global Topography Data taken after USGS. NAF, North Anatolian Fault; EAF, East Anatolian Fault; DSF, Dead Sea Fault; NEAF, North East Anatolian Fault; EPF, Ezinepazarı Fault; PTF, Paphos Transform Fault; CTF, Cephalonia Transform Fault; PSF, Pampak–Sevan Fault; AS, Apsheron Sill; GF, Garni Fault; OF, Ovacık Fault; MT, Mus¸ Thrust Zone; TuF, Tutak Fault; TF, Tebriz Fault; KBF, Kavakbas¸ı Fault; MRF, Main Recent Fault; KF, Kagˇızman Fault; IF, Igˇdır Fault; BF, Bozova Fault; EF, Elbistan Fault; SaF, Salmas Fault; SuF, Su¨rgu¨ Fault; G, Go¨kova; BMG, Bu¨yu¨k Menderes Graben; Ge, Gediz Graben; Si, Simav Graben; BuF, Burdur Fault; BGF, Beys¸ehir Go¨lu¨ Fault; TF, Tatarlı Fault; SuF, Sultandagˇ Fault; TGF, Tuz Go¨lu¨ Fault; EcF, Ecemis¸ Fau; ErF, Erciyes Fault; DF, Deliler Fault; MF, Malatya Fault; KFZ, Karatas¸–Osmaniye Fault Zone.

  • The Alpide Belt, shown in this map, is a convergent plate boundary that extends from Australia to Portugal. This map shows the westernmost extent of this system. The convergence here drives uplift of the Himalayas and the European Alps. Subduction along the Makran and Sunda subduction zones are also part of this system.

  • This is a great map showing some details of the tectonics associated with the Arabia plate (Stern and Johnson, 2010).

  • Simpli”ed map of the Arabian Plate, with plate boundaries, approximate plate convergence vectors, and principal geologic features. Note location of Central Arabian Magnetic Anomaly (CAMA).

  • This map (Allen et al., 2013) shows focal mechanisms (fault plane solutions) for earthquakes associated with the BZFB. GPS velocities are also plotted in blue (rates of motion at points on the earth, measured in mm per year), relative to Iran.

  • (a) Regional topography and seismicity of the Arabia-Eurasia collision. Large dots are epicenters of earthquakes of M >6 from 1900 to 2000 [Jackson, 2001], small dots are epicenters from the EHB catalogue 1964–1999, M >5. Red arrows show GPS-derived velocity with respect to Asia from Sella et al. [2002]. A= Alborz; TIP = Turkish-Iranian plateau; Z = Zagros. (b) Seismicity of the Zagros: focal mechanisms reported in Nissen et al. [2011] and references therein. Note the scarcity of thrusts above the smoothed 1250m regional elevation contour (derived using a Gaussian filter with a radius of 50 km). Earthquake epicenters are accurate to within 20 km [Nissen et al., 2011]. GPS vectors are from Walpersdorf et al. [2006]. MZRF =Main Zagros Reverse Fault (Zagros suture).

  • This map shows a detailed view of faults and folds in the BZFB (Allen et al., 2013).

  • (a) Location map and major structures of the Zagros Simply Folded Belt, Iran. Derived from NIOC [1975, 1977], Berberian [1995], Hessami et al. [2001], Blanc et al. [2003], Agard et al. [2005], and Babaie et al. [2006]. Key to fault abbreviations: B = Borazjan; Iz = Izeh; K= Kazerun; KB= Kareh Bas; Kh = Khanaqin; S = Sarvestan; SP = Sabz-Pushan; BL = Balarud Line; A= Kuh-e Asmari. b) Earthquake epicentres across the Zagros, from Nissen et al. [2011] and references therein, divided by fault type. MZRF =Main Zagros Reverse Fault.


  • This is cross section A-A’ from the map above (also on poster). Note the thrust faults and the strike-slip faults represented in this section (Allen et al., 2013). While this section is to the south of the M 7.3 earthquake, it still represents the generalized tectonics in the region (dextral oblique plate boundary).

  • (a) Cross-section through the Dezful Embayment and the Bakhtyari Culmination.

  • The Geospatial Information Authority of Japan (GSI) conducted some analyses using Synthetic Aperture Radar (SAR). “Two or more line-of-sight displacements with different observing directions can be decomposed to quasi east-west and up-down components.” They describe their interpretation below.


  • Large displacement (~90 cm upward and ~50 cm westward) has been detected around 20 km NNW of Sarpol-e Zahab. Around the epicenter, ~30 cm downward and ~35 cm westward displacement has been detected.

  • Here is a map that displays an estimate of seismic hazard for the region (Jenkins et al., 2010). This comes from Giardini et al. (1999).

  • The Global Seismic Hazard Map. Peak ground acceleration (pga) with a 10% chance of exceedance in 50 years is depicted in m/s2. The site classification is rock everywhere except Canada and the United States, which assume rock/firm soil site classifications. White and green correspond to low seismicity hazard (0%-8%g), yellow and orange correspond to moderate seismic hazard (8%-24%g), pink and dark pink correspond to high seismicity hazard (24%-40%g), and red and brown correspond to very high seismic hazard (greater than 40%g).

Other Social Media Posts

  • Here is a plot showing historic seismicity from Dr. Jascha Polet (Cal Poly Pomona Seismologist).

    References

  • Allen, M.B., Saville, C., Blac, E.K-P., Talebian, M., and Nissen, E., 2013. Orogenic plateau growth: Expansion of the Turkish-Iranian Plateau across the Zagros fold-and-thrust belt in Tectonics, v. 32, p. 171-190, doi:10.1002/tect.20025
  • Giardini, D., Grunthal, G., Shedlock, K., Zhang. P., and Global Seismic Hazards Program, 1999. Global seismic hazards map: Accessed on Jan. 9, 2007 at http://www.seismo.ethz.ch/GSHAP.
  • Jenkins, Jennifer, Turner, Bethan, Turner, Rebecca, Hayes, G.P., Sinclair, Alison, Davies, Sian, Parker, A.L., Dart, R.L., Tarr, A.C., Villaseñor, Antonio, and Benz, H.M., compilers, 2013, Seismicity of the Earth 1900–2010 Middle East and vicinity (ver 1.1, Jan. 28, 2014): U.S. Geological Survey Open-File Report 2010–1083-K, scale 1:7,000,000, https://pubs.usgs.gov/of/2010/1083/k/.
  • Stern, R.J. and Johnson, P., 2010. Continental lithosphere of the Arabian Plate: A geologic, petrologic, and geophysical synthesis in Earth-Science Reviews, v. 101, p. 29-67.
  • Taymaz, T., Yilmaz, Y., and Dilek, Y., 2007. The geodynamics of the Aegean and Anatolia: introduction in Geological Society, London, Special Publications, v. 291; p. 1-16, doi:10.1144/SP291.1
  • Woudloper, 2009. Tectonic map of southern Europe and the Middle East, showing tectonic structures of the western Alpide mountain belt.

Earthquake Report: Java!

This morning (my time) there was a deep earthquake along the subduction zone beneath Java. The M 6.5 earthquake hypocentral depth is deeper than the subduction zone megathrust fault, so it is the downgoing Australia plate (AP).
My initial interpretation was that this earthquake is a strike-slip earthquake related to reactivated transform faults/fracture zones in the subducting AP. So, I did a little searching for prior historic earthquakes in the region to see what they might tell us about the tectonics of the subducting AP in this region. Given my knowledge of the fracture zones in the AP to the west, these fracture zones are ~north-south in orientation. Thus, my first interpretation was that this M 6.5 earthquake was a left-lateral strike-slip earthquake on a north-northwest striking (oriented) fault.
However, looking into these historic earthquakes, there are two good analogues. On 2001.05.25 there was an earthquake with magnitude of M 6.3 to the east of today’s M 6.5 earthquake, with a similar depth relation to the downgoing plate (it was also within the AP). This M 6.3 has a similarly oriented moment tensor.
Then I found a deeper earthquake (that plots closer to the depth of the downgoing AP, but does not have a thrust moment tensor, so is probably in the AP). This earthquake has a fault slip model from the USGS, where they inverted seismic data to interpret the M 7.5 earthquake to be a left-lateral strike-slip earthquake on an ~east-west fault. This did not fit my hypothesis about north-south fracture zones. So, I realized I needed to look at the magnetic anomaly data (and any other sources about the structures in the AP south of Java).
The fracture zones are differently oriented south of Java. In the Hall (2011) inset map in the interpretive poster, the fracture zones are oriented to the northwest, and the normal faults associated with spreading ridge tectonics are oriented to the northeast. So, perhaps the M 7.5 earthquake was on a reactivated spreading ridge fault and the 2017 M 6.5 and 2001 M 6.3 are on reactivated fracture zone faults. This leads me to my original interpretation, that the M 6.5 earthquake is a left-lateral strike-slip fault earthquake. Of course, this is still just an hypothesis. Since the earthquake is so deep, we will never be able to observe offset geomorphic features like we can for earthquakes on land.

Below is my interpretive poster for this earthquake.

I plot the seismicity from the past month, with color representing depth and diameter representing magnitude (see legend). I include earthquake epicenters from 1917-2017 with magnitudes M > 6.0.
I plot the USGS fault plane solutions (moment tensors in blue) for the M 6.5 and some earlier earthquakes.

  • I placed a moment tensor / focal mechanism legend on the poster. There is more material from the USGS web sites about moment tensors and focal mechanisms (the beach ball symbols). Both moment tensors and focal mechanisms are solutions to seismologic data that reveal two possible interpretations for fault orientation and sense of motion. One must use other information, like the regional tectonics, to interpret which of the two possibilities is more likely.
  • I also include the shaking intensity contours on the map. These use the Modified Mercalli Intensity Scale (MMI; see the legend on the map). This is based upon a computer model estimate of ground motions, different from the “Did You Feel It?” estimate of ground motions that is actually based on real observations. The MMI is a qualitative measure of shaking intensity. More on the MMI scale can be found here and here. This is based upon a computer model estimate of ground motions, different from the “Did You Feel It?” estimate of ground motions that is actually based on real observations.
  • I include the slab contours plotted (Hayes et al., 2012), which are contours that represent the depth to the subduction zone fault. These are mostly based upon seismicity. The depths of the earthquakes have considerable error and do not all occur along the subduction zone faults, so these slab contours are simply the best estimate for the location of the fault. The depth is probably not very well constrained due to the geometry and lack of seismometer coverage in the oceanic setting.
  • Here are the USGS pages for the earthquakes with fault plane solutions plotted on the interpretive poster below.
  • 2017.12.15 M 6.5
  • 2007.07.08 M 7.5
  • 2001.05.25 M 6.3
  • I include some inset figures.

  • In the upper right corner I include a small scale (upper panel) and a large scale (bottom panel) view of the regional tectonics (Zahirovic et al., 2014). Plate boundary fault symbology (and other features, like fracture zones) is shown in the legend. I place a blue star on the map in the general location of this earthquake epicenter.
  • In the lower right corner is a figure from Krabbenhoeft et al. (2010) that shows the tectonic land forms associated with the subduction zone offshore of Java (forearc basins).
  • In the upper left corner are some figure insets from Jones et al. (2010). This is a report on the regional seismicity. The panel on the right is a map showing seismicity vs. depth (color of circle) and magnitude (diameter of circle). There are two cross sections (A-A’ and B-B’) that sample seismicity limited to the rectangular boxes shown on the map. The seismicity cross sections show the general location of the India-Australia slab as it subducts beneath the Sunda plate. On the left are legends for the map and the cross sections. I place a blue star for the general location of the epicenter of this M 6.5 earthquake on the map and on the cross section. I also place a blue line labeled A-A’ in the general location of the cross section on the map.


  • Here is the same map, but with the Magnetic Anomaly map as a base (Meyer et al., 2017). Note how the anomalies are oriented subparallel to the spreading ridge related structures.

  • Here is the figure from Hall (2011) showing the structures in some of the oceanic plates in this region.

  • Black lines show general trends of deep structures in NW Australia and predicted orientation of deep structures in Indonesia at the present-day if these faults were brought with accreted blocks from NW Australia according to the reconstructions of Figures 4 and 5.

  • Here is the plate tectonic map from Zahirovic et al (2014).

  • Regional tectonic setting with plate boundaries (MORs/transforms = black, subduction zones = teethed red) from Bird (2003) and ophiolite belts representing sutures modified from Hutchison (1975) and Baldwin et al. (2012). West Sulawesi basalts are from Polvé et al. (1997), fracture zones are from Matthews et al. (2011) and basin outlines are from Hearn et al. (2003). ANI – Andaman and Nicobar Islands, BD– Billiton Depression, Ba – Bangka Island, BI – Belitung (Billiton) Island, BiS – Bismarck Sea, BP – Benham Plateau, CaR – Caroline Ridge, CS – Celebes Sea, DG– Dangerous Grounds, EauR – Eauripik Ridge, FIN – Finisterre Terrane, GoT – Gulf of Thailand, GR– Gagua Ridge, HAL– Halmahera, HBa – Huatung Basin, KB–Ketungau Basin, KP – Khorat Platform, KT – Kiilsgaard Trough, LS – Luconia Shoals, MacB – Macclesfield Bank, ManTr – Manus Trench, MaTr – Mariana Trench, MB– Melawi Basin, MDB– Minami Daito Basin, MG– Mangkalihat, MIN – Mindoro, MN– Mawgyi Nappe, MoS – Molucca Sea, MS– Makassar Straits, MTr – Mussau Trench, NGTr – New Guinea Trench, NI – Natuna Islands, ODR– Oki Daito Ridge, OJP –Ontong Java Plateau, OSF – Owen Stanley Fault, PAL – Palawan, PhF – Philippine Fault, PT – Paternoster Platform, PTr – Palau Trench, PVB – Parece Vela Basin, RB – Reed Bank, RMF– Ramu-Markham Fault, RRF – Red River fault, SEM– Semitau, ShB – Shikoku Basin, Sol. Sea – Solomon Sea, SPK – Sepik, SPT – Sabah–Palawan Trough, STr – Sorol Trough, Sul – Sulawesi, SuS – Sulu Sea, TPAA– Torricelli–Prince Alexander Arc, WB–West Burma, WCT–W Caroline Trough, YTr –Yap Trough.

  • Here is the base map without inset figures. The 1917-2017 USGS seismicity is included for reference.

  • Here is a figure showing the regional geodetic motions (Bock et al., 2003). I include their figure caption below as a blockquote.

  • Topographic and tectonic map of the Indonesian archipelago and surrounding region. Labeled, shaded arrows show motion (NUVEL-1A model) of the first-named tectonic plate relative to the second. Solid arrows are velocity vectors derived from GPS surveys from 1991 through 2001, in ITRF2000. For clarity, only a few of the vectors for Sumatra are included. The detailed velocity field for Sumatra is shown in Figure 5. Velocity vector ellipses indicate 2-D 95% confidence levels based on the formal (white noise only) uncertainty estimates. NGT, New Guinea Trench; NST, North Sulawesi Trench; SF, Sumatran Fault; TAF, Tarera-Aiduna Fault. Bathymetry [Smith and Sandwell, 1997] in this and all subsequent figures contoured at 2 km intervals.

  • In addition to the orientation of relative plate motion (that controls seismogenic zone and strain partitioning), the Indo Australia plate varies in crustal age (Lasitha et al., 2006). I include their figure caption below as a blockquote.

  • Tectonic sketch map of the Sumatra–Java trench-arc region in eastern Indian Ocean Benioff Zone configuration. Hatched line with numbers indicates depth to the top of the Benioff Zone (after Newcomb and McCann13). Magnetic anomaly identifications have been considered from Liu et al.14 and Krishna et al.15. Magnitude and direction of the plate motion is obtained from Sieh and Natawidjaja11. O indicates the location of the recent major earthquakes of 26 December 2004, i.e. the devastating tsunamigenic earthquake (Mw = 9.3) and the 28 March 2005 earthquake (Mw = 8.6).


    References:

  • Abercrombie, R.E., Antolik, M., Ekstrom, G., 2003. The June 2000 Mw 7.9 earthquakes south of Sumatra: Deformation in the India–Australia Plate. Journal of Geophysical Research 108, 16.
  • Bothara, J., Beetham, R.D., Brunston, D., Stannard, M., Brown, R., Hyland, C., Lewis, W., Miller, S., Sanders, R., Sulistio, Y., 2010. General observations of effects of the 30th September 2009 Padang earthquake, Indonesia. Bulletin of the New Zealand Society for Earthquake Engineering 43, 143-173.
  • Chlieh, M., Avouac, J.-P., Hjorleifsdottir, V., Song, T.-R.A., Ji, C., Sieh, K., Sladen, A., Hebert, H., Prawirodirdjo, L., Bock, Y., Galetzka, J., 2007. Coseismic Slip and Afterslip of the Great (Mw 9.15) Sumatra-Andaman Earthquake of 2004. Bulletin of the Seismological Society of America 97, S152-S173.
  • Harris, R. A., 2006. Rise and fall of the Eastern Great Indonesian arc recorded by the assembly, dispersion and accretion of the Banda Terrane, Timor, Gondwana Res., 10, 207–231.
  • Hayes, G. P., D. J. Wald, and R. L. Johnson (2012), Slab1.0: A three-dimensional model of global subduction zone geometries, J. Geophys. Res., 117, B01302, doi:10.1029/2011JB008524.
  • Hengesh, J.V. and Whitney, B.B., 2016. Transcurrent reactivation of Australia’s western passive margin: An example of intraplate deformation from the central Indo-Australian plate in Tectonics, v. 35, doi:10.1002/2015TC004103.
  • Jones, E.S., Hayes, G.P., Bernardino, Melissa, Dannemann, F.K., Furlong, K.P., Benz, H.M., and Villaseñor, Antonio, 2014, Seismicity of the Earth 1900–2012 Java and vicinity: U.S. Geological SurveyOpen-File Report 2010–1083-N, 1 sheet, scale 1:5,000,000,http://dx.doi.org/10.3133/ofr20101083N.
  • Kanamori, H., Rivera, L., Lee, W.H.K., 2010. Historical seismograms for unravelling a mysterious earthquake: The 1907 Sumatra Earthquake. Geophysical Journal International 183, 358-374.
  • Konca, A.O., Avouac, J., Sladen, A., Meltzner, A.J., Sieh, K., Fang, P., Li, Z., Galetzka, J., Genrich, J., Chlieh, M., Natawidjaja, D.H., Bock, Y., Fielding, E.J., Ji, C., Helmberger, D., 2008. Partial Rupture of a Locked Patch of the Sumatra Megathrust During the 2007 Earthquake Sequence. Nature 456, 631-635.
  • Krabbenhoeft, A., Weinrebe, R.W., Kopp, H., Flueh, E.R., Ladage, S., Papenberg, C., Planert, L., and Djajadihardja, Y., 2010. Bathymetry of the Indonesian Sunda margin-relating morphological features of the upper plate slopes to the location and extent of the seismogenic zone in NHESS, v. 10, p. 1899-1911, doi:10.5194/nhess-10-1899-2010
  • Lasitha, S., Radhakrishna, M., Sanu, T.D., 2006. Seismically active deformation in the Sumatra–Java trench-arc region: geodynamic implications in Current Science, v. 90, p. 690-696.
  • Meyer, B., Saltus, R., Chulliat, A., 2017. EMAG2: Earth Magnetic Anomaly Grid (2-arc-minute resolution) Version 3. National Centers for Environmental Information, NOAA. Model. doi:10.7289/V5H70CVX
  • Natawidjaja, D.H., Sieh, K., Chlieh, M., Galetzka, J., Suwargadi, B., Cheng, H., Edwards, R.L., Avouac, J., Ward, S.N., 2006. Source parameters of the great Sumatran megathrust earthquakes of 1797 and 1833 inferred from coral microatolls. Journal of Geophysical Research 111, 37.
  • Newcomb, K.R., McCann, W.R., 1987. Seismic History and Seismotectonics of the Sunda Arc. Journal of Geophysical Research 92, 421-439.
  • Philibosian, B., Sieh, K., Natawidjaja, D.H., Chiang, H., Shen, C., Suwargadi, B., Hill, E.M., Edwards, R.L., 2012. An ancient shallow slip event on the Mentawai segment of the Sunda megathrust, Sumatra. Journal of Geophysical Research 117, 12.
  • Rigg, J. W., and R. Hall (2011), Structural and stratigraphic evolution of the Savu Basin, Indonesia, Geol. Soc. London Spec. Publ., 355(1), 225–240.
  • Rivera, L., Sieh, K., Helmberger, D., Natawidjaja, D.H., 2002. A Comparative Study of the Sumatran Subduction-Zone Earthquakes of 1935 and 1984. BSSA 92, 1721-1736.
  • Sieh, K., Natawidjaja, D.H., Meltzner, A.J., Shen, C., Cheng, H., Li, K., Suwargadi, B.W., Galetzka, J., Philobosian, B., Edwards, R.L., 2008. Earthquake Supercycles Inferred from Sea-Level Changes Recorded in the Corals of West Sumatra. Science 322, 1674-1678.
  • Smith, W.H.F., Sandwell, D.T., 1997. Global seafloor topography from satellite altimetry and ship depth soundings: Science, v. 277, p. 1,957-1,962.
  • Storchak, D. A., D. Di Giacomo, I. Bondár, E. R. Engdahl, J. Harris, W. H. K. Lee, A. Villaseñor, and P. Bormann (2013), Public release of the ISC-GEM global instrumental earthquake catalogue (1900–2009), Seismol. Res. Lett., 84(5), 810–815, doi:10.1785/0220130034.
  • Stow, D.A.V., et al., 1990. Sediment facies and processes on the distal Bengal Fan, Leg 116, ODP Texas & M University College Station; UK distributors IPOD Committee NERC Swindon, p. 377-396.
  • Zahirovic et al., 2014. The Cretaceous and Cenozoic tectonic evolution of Southeast Asia in Solid Earth, v. 5, p. 227-273, doi:10.5194/se-5-227-2014.

Earthquake Report: Laytonville (northern CA)!

This morning there was a small earthquake in a region of northern California between two major faults that are part of the Pacific-North America plate boundary. The M 4.3 earthquake occurred between the San Andreas fault (SAF) to the west and the Maacma fault (MF) to the east. There are no mapped earthquake faults in this region.
The San Andreas fault is a right-lateral strike-slip transform plate boundary between the Pacific and North America plates. The plate boundary is composed of faults that are parallel to sub-parallel to the SAF and extend from the west coast of CA to the Wasatch fault (WF) system in central Utah (the WF runs through Salt Lake City and is expressed by the mountain range on the east side of the basin that Salt Lake City is built within).
About 75% of the relative plate motion is accommodated along the SAF and its synthetic sister faults in the northern CA region. The rest of the plate boundary motion is accommodated along the Eastern CA shear zone and Walker Lane, along with the Central Nevada Seismic Belt, and the Wasatch fault systems. In Northern CA, there is about 33-37 mm/yr strain accumulated on the SAF plate boundary system. About 18-25 mm/yr is on the SAF, 8-11 mm/yr on the MF, and 5-7 mm/yr on the Bartlett Springs fault system (Geist and Andrews, 2000).
The three main faults in the region north of San Francisco are the SAF, the MF, and the Bartlett Springs fault (BSF). I also place a graphical depiction of the USGS moment tensor for this earthquake. The SAF, MF, and BSF are all right lateral strike-slip fault systems. There are no active faults mapped in the region of Sunday’s epicenter, but I interpret this earthquake to have right-lateral slip. Without more seismicity or mapped faults to suggest otherwise, this is a reasonable interpretation.

Below is my interpretive poster for this earthquake.

I plot the seismicity from the past month, with color representing depth and diameter representing magnitude (see legend). I include earthquake epicenters from 1917-2017 with magnitudes M > 4.0.
I use the USGS Quaternary fault and fold database for the faults. I outlined the Vizcaino Block, which many interpret to be a prehistoric subduction zone accretionary prism from a time before the San Andreas existed.
I plot the USGS fault plane solutions (moment tensors in blue) for some relevant historic earthquakes.

  • I placed a moment tensor / focal mechanism legend on the poster. There is more material from the USGS web sites about moment tensors and focal mechanisms (the beach ball symbols). Both moment tensors and focal mechanisms are solutions to seismologic data that reveal two possible interpretations for fault orientation and sense of motion. One must use other information, like the regional tectonics, to interpret which of the two possibilities is more likely. Based upon the tectonics associated with the San Andreas and Maacama faults, I interpret this M 4.3 earthquake to be a right-lateral strike-slip fault.
  • I also include the shaking intensity contours on the map. These use the Modified Mercalli Intensity Scale (MMI; see the legend on the map). This is based upon a computer model estimate of ground motions, different from the “Did You Feel It?” estimate of ground motions that is actually based on real observations. The MMI is a qualitative measure of shaking intensity. More on the MMI scale can be found here and here. This is based upon a computer model estimate of ground motions, different from the “Did You Feel It?” estimate of ground motions that is actually based on real observations.
  • I include the slab contours plotted (McCrory et al., 2012), which are contours that represent the depth to the subduction zone fault. These are mostly based upon seismicity. The depths of the earthquakes have considerable error and do not all occur along the subduction zone faults, so these slab contours are simply the best estimate for the location of the fault.
  • Here are the USGS pages for the main earthquake in this sequence.
  • 2017.12.14 M 4.3
  • 2016.11.06 M 4.1
  • 2012.07.08 M 4.4
  • 1999.01.24 M 4.1
  • I include some inset figures.

  • In the upper right corner I include a map and cross section from Wallace (1990). The map shows earthquake epicenters, the major faults, and outlines delineating the regions from which seismicity is plotted in various cross sectional views. Below the map is the cross section E-E.’ Seismicity associated with the MF and Bartlett Springs fault are fairly obvious, while seismicity associated with the SAF is less localized along the fault (probably because the fault is offshore, the smaller magnitude seismicity does not plot here). I place blue stars on the map and on the cross section, in the general location of today’s M 4.3 earthquake.
  • In the upper left corner I include generalized fault map of northern California from Wallace (1990). I place a blue star in the general location of today’s M 4.3 earthquake.
  • To the right of the Wallace (1990) map, is a figure from Langenheim et al., 2013. Langenheim et al. (2013) used magnetic anomalies to break out structural domains within the Cretaceous Franciscan Formation, the main basement geology in this region of northern California. There are some folds in the Franciscan Formation, with dips interpreted from the anomaly data. Today’s M 4.3 earthquake (the larger blue star) is located along the boundary of domains 1 and 2. The 1999.01.24 M 4.1 earthquake (smaller blue star)is within domain 1, is a thrust earthquake, and is oriented correctly to be associated with the thrust faults here. Perhaps these faults are being reactivated in the modern SAF dextral regime.
  • In the lower left corner I include a larger scale map showing the details of the mapped faults.
  • To the right of this large scale map, I include the Earthquake Shaking Potential map from the state of California. This is a probabilistic seismic hazard map, basically a map that shows the likelihood that there will be shaking of a given amount over a period of time. More can be found from the California Geological Survey here. I place a blue star in the approximate location of today’s earthquake.


Below are some earthquake report posters for earthquakes in this region.

  • Earlier in November 2016, there was an earthquake in this region. Below is my interpretive poster for that earthquake. Here is my Earthquake Report.

  • Earlier the year in 2016, there was an earthquake in this region, along the BSF. Below is my interpretive poster for that earthquake. Here is my Earthquake Report.

  • In 2015 there was an earthquake in this region. Below is my interpretive poster for that earthquake. Here is my Earthquake Report.


  • I place a map shows the configuration of faults in central (San Francisco) and northern (Point Delgada – Punta Gorda) CA (Wallace, 1990). Here is the caption for this map, that is on the lower left corner of my map. Below the citation is this map presented on its own.

  • Geologic sketch map of the northern Coast Ranges, central California, showing faults with Quaternary activity and basin deposits in northern section of the San Andreas fault system. Fault patterns are generalized, and only major faults are shown. Several Quaternary basins are fault bounded and aligned parallel to strike-slip faults, a relation most apparent along the Hayward-Rodgers Creek-Maacama fault trend.

  • Here is a map from McLaughlin et al. (2012) that shows the regional faulting. I include the figure caption as a blockquote below.

  • Maps showing the regional setting of the Rodgers Creek–Maacama fault system and the San Andreas fault in northern California. (A) The Maacama (MAFZ) and Rodgers Creek (RCFZ) fault zones and related faults (dark red) are compared to the San Andreas fault, former and present positions of the Mendocino Fracture Zone (MFZ; light red, offshore), and other structural features of northern California. Other faults east of the San Andreas fault that are part of the wide transform margin are collectively referred to as the East Bay fault system and include the Hayward and proto-Hayward fault zones (green) and the Calaveras (CF), Bartlett Springs, and several other faults (teal). Fold axes (dark blue) delineate features associated with compression along the northern and eastern sides of the Coast Ranges. Dashed brown line marks inferred location of the buried tip of an east-directed tectonic wedge system along the boundary between the Coast Ranges and Great Valley (Wentworth et al., 1984; Wentworth and Zoback, 1990). Dotted purple line shows the underthrust south edge of the Gorda–Juan de Fuca plate, based on gravity and aeromagnetic data (Jachens and Griscom, 1983). Late Cenozoic volcanic rocks are shown in pink; structural basins associated with strike-slip faulting and Sacramento Valley are shown in yellow. Motions of major fault blocks and plates relative to fi xed North America, from global positioning system and paleomagnetic studies (Argus and Gordon, 2001; Wells and Simpson, 2001; U.S. Geological Survey, 2010), shown with thick black arrows; circled numbers denote rate (in mm/yr). Restraining bend segment of the northern San Andreas fault is shown in orange; releasing bend segment is in light blue. Additional abbreviations: BMV—Burdell Mountain Volcanics; QSV—Quien Sabe Volcanics. (B) Simplifi ed map of color-coded faults in A, delineating the principal fault systems and zones referred to in this paper.

  • Here is the figure showing the evolution of the SAF since its inception about 29 Ma. I include the USGS figure caption below as a blockquote.

  • EVOLUTION OF THE SAN ANDREAS FAULT.
    This series of block diagrams shows how the subduction zone along the west coast of North America transformed into the San Andreas Fault from 30 million years ago to the present. Starting at 30 million years ago, the westward- moving North American Plate began to override the spreading ridge between the Farallon Plate and the Pacific Plate. This action divided the Farallon Plate into two smaller plates, the northern Juan de Fuca Plate (JdFP) and the southern Cocos Plate (CP). By 20 million years ago, two triple junctions began to migrate north and south along the western margin of the West Coast. (Triple junctions are intersections between three tectonic plates; shown as red triangles in the diagrams.) The change in plate configuration as the North American Plate began to encounter the Pacific Plate resulted in the formation of the San Andreas Fault. The northern Mendicino Triple Junction (M) migrated through the San Francisco Bay region roughly 12 to 5 million years ago and is presently located off the coast of northern California, roughly midway between San Francisco (SF) and Seattle (S). The Mendicino Triple Junction represents the intersection of the North American, Pacific, and Juan de Fuca Plates. The southern Rivera Triple Junction (R) is presently located in the Pacific Ocean between Baja California (BC) and Manzanillo, Mexico (MZ). Evidence of the migration of the Mendicino Triple Junction northward through the San Francisco Bay region is preserved as a series of volcanic centers that grow progressively younger toward the north. Volcanic rocks in the Hollister region are roughly 12 million years old whereas the volcanic rocks in the Sonoma-Clear Lake region north of San Francisco Bay range from only few million to as little as 10,000 years old. Both of these volcanic areas and older volcanic rocks in the region are offset by the modern regional fault system. (Image modified after original illustration by Irwin, 1990 and Stoffer, 2006.)

  • Here is a map that shows the shaking potential for earthquakes in CA. This comes from the state of California here.

  • Earthquake shaking hazards are calculated by projecting earthquake rates based on earthquake history and fault slip rates, the same data used for calculating earthquake probabilities. New fault parameters have been developed for these calculations and are included in the report of the Working Group on California Earthquake Probabilities. Calculations of earthquake shaking hazard for California are part of a cooperative project between USGS and CGS, and are part of the National Seismic Hazard Maps. CGS Map Sheet 48 (revised 2008) shows potential seismic shaking based on National Seismic Hazard Map calculations plus amplification of seismic shaking due to the near surface soils.

  • Here are three figures from Langenheim et al. (2013). The first one shows the geology of the region. The second map shows the magnetic anomaly data and the second map shows how they interpreted the magnetic anomaly data to reveal different tectonic domains in the Franciscan Formation.

  • Map showing location and geologic setting of the Franciscan Coastal Belt in the northern California Coast Ranges. Inset shows magnetic anomalies (in magenta) of Figure 2 in and near the Coastal Belt, mapped occurrences of basalt (black dots and areas), and associated fossil localities (numbered white X’s; listed in Table 1). Map units: fc—Franciscan False Cape terrane; KRt—Franciscan King Range terrane; Cob—Franciscan Coastal Belt, undivided; Yg—Franciscan Yager terrane; Cnb— Franciscan Central Belt; Eb—Franciscan Eastern Belt; um—ultramafi c rocks; MTJ— Mendocino triple junction; GVg—Great Valley Group; T—Tertiary cover; Q—alluvium, largely Quaternary. Stippled pattern near Fort Ross shows outcrop of Ohlson Ranch Formation. Magenta arrows labeled PAC and GOR show relative plate motion of Pacific and Gorda plates, respectively, relative to the North American plate (McCrory, 2000). Tiny box labeled MH—Marin Headlands (area of Fig. 8). Coastal Belt thrust is shown with thrust teeth. Geology was compiled and simplifi ed from Jennings (1977), Blake et al. (1992), Blake et al. (2002), Jayko et al. (1989), McLaughlin et al. (2000), U.S. Geological Survey and California Geological Survey (2006), and geologic mapping by R.J. McLaughlin northeast of Clear Lake and south of Willits. Southern part of the Coastal Belt thrust west and south of Willits is from (1) mapping by McLaughlin,
    interpretation of aeromagnetic anomalies, and 1:62,500 scale topography, and (2) that east of Point Arena is from photogeologic interpretation that resulted in a greater extent of mélange assigned to the Central Belt.


    Filtered magnetic map of the Coastal Belt. See Langenheim et al. (2011) for details of filtering that places anomalies over magnetic sources and enhances anomalies for which sources are exposed or near surface. Magenta lines—margins of the belt, with the San Andreas fault on the west and the Coastal Belt thrust and other faults on the east. Dashed dark green lines—depositional contacts. Red lines— boundaries between the terranes of the Coastal Belt: Coastal Belt, undivided (Cob), False Cape terrane (fc), King Range terrane (KRt), and Yager terrane (Yg). The Wheatfield Fork terrane (WFt) is too narrow to show at the scale of the figure, but its extent along the eastern boundary of the Coastal Belt is circled in dark blue. Thin dark blue dotted lines separate structural domains discussed in text and shown in figure 6. Blue line—profile location of model shown in Figure 5B.


    Structural domains and dips interpreted from filtered magnetic anomalies (Fig. 2). Layer dip from asymmetry of magnetic anomaly is shown. Dark blue lines separate domains discussed in text. Anomalies within area east of the Coastal Belt thrust may be caused by magnetic layers in the Coastal Belt beneath a thin sheet of Central Belt rocks in the hanging wall of the thrust. Anomalies colored green, blue, and lavender are discussed in text. WFt— Wheatfield Fork terrane. Dashed green line is outline of onshore Eel River basin.

  • There are three types of earthquakes, strike-slip, compressional (reverse or thrust, depending upon the dip of the fault), and extensional (normal). Here is are some animations of these three types of earthquake faults. Many of the earthquakes people are familiar with in the Mendocino triple junction region are either compressional or strike slip. The following three animations are from IRIS.
  • Strike Slip:
  • Compressional:
  • Extensional:
  • This figure shows what a transform plate boundary fault is. Looking down from outer space, the crust on either side of the fault moves side-by-side. When one is standing on the ground, on one side of the fault, looking across the fault as it moves… If the crust on the other side of the fault moves to the right, the fault is a “right lateral” strike slip fault. The Mendocino and San Andreas faults are right-lateral (dextral) strike-slip faults. I believe this is from Pearson Higher Ed.

  • For more on the graphical representation of moment tensors and focal mechnisms, check this IRIS video out:
  • Here is a fantastic infographic from Frisch et al. (2011). This figure shows some examples of earthquakes in different plate tectonic settings, and what their fault plane solutions are. There is a cross section showing these focal mechanisms for a thrust or reverse earthquake. The upper right corner includes my favorite figure of all time. This shows the first motion (up or down) for each of the four quadrants. This figure also shows how the amplitude of the seismic waves are greatest (generally) in the middle of the quadrant and decrease to zero at the nodal planes (the boundary of each quadrant).


    References:

  • Geist, E.L. and Andrews D.J., 2000. Slip rates on San Francisco Bay area faults from anelastic deformation of the continental lithosphere, Journal of Geophysical Research, v. 105, no. B11, p. 25,543-25,552.
  • Irwin, W.P., 1990. Quaternary deformation, in Wallace, R.E. (ed.), 1990, The San Andreas Fault system, California: U.S. Geological Survey Professional Paper 1515, online at: http://pubs.usgs.gov/pp/1990/1515/
  • Langenheim, V.E., Jachens, R.C., Wentworht, C.M., and McLaughlin, R.J., 2012. Previously unrecognized regional structure of the Coastal Belt of the Franciscan Complex, northern California, revealed by magnetic data in Geosphere, v. 9, no. 6, doi:10.1130/GES0094
  • McLaughlin, R.J., Sarna-Wojcicki, A.M., Wagner, D.L., Fleck, R.J., Langenheim, V.E., Jachens, R.C., Clahan, K., and Allen, J.R., 2012. Evolution of the Rodgers Creek–Maacama right-lateral fault system and associated basins east of the northward-migrating Mendocino Triple Junction, northern California in Geosphere, v. 8, no. 2., p. 342-373.
  • McCrory, P.A.,. Blair, J.L., Waldhauser, F., kand Oppenheimer, D.H., 2012. Juan de Fuca slab geometry and its relation to Wadati-Benioff zone seismicity in JGR, v. 117, B09306, doi:10.1029/2012JB009407.
  • Stoffer, P.W., 2006, Where’s the San Andreas Fault? A guidebook to tracing the fault on public lands in the San Francisco Bay region: U.S. Geological Survey General Interest Publication 16, 123 p., online at http://pubs.usgs.gov/gip/2006/16/
  • Wallace, Robert E., ed., 1990, The San Andreas fault system, California: U.S. Geological Survey Professional Paper 1515, 283 p. [https://pubs.er.usgs.gov/publication/pp1515].

Earthquake Report: Caroline Ridge Update #1

Well, there was an earthquake this morning (my time) that may help us select a fault plane solution. Recall that these fault plane solutions (moment tensors and focal mechanisms) have two possible fault planes. We need additional information (like fault maps for the region, or aftershock patterns, etc.) in order to choose the more likely potential fault plane. Because we are scientists and we cannot make direct observations (the key part of the scientific method), we cannot ever know which fault plane is the correct one. However, we can be very certain based upon some basic reasoning.
I speculated in my initial Earthquake Report here, that the M 6.5 and M 6.4 seemed to align along a north-northeast orientation, slightly favoring the NE striking right-lateral strike slip fault plane as the principal fault plane. Today’s M 6.1 earthquake provides additional corroborating evidence to support this initial interpretation.
In the interpretive poster, I draw a dashed red line connecting the earthquake epicenters along a hypothetical fault. This is pure conjecture, other than the aftershock pattern. However, these earthquakes are aligned in a way that is sub-parallel to a submarine mountain range (oriented ~north-south; note this range to the north of the epicenters). This range could be formed by faulting in the region. If this structure is related to these earthquakes, it might be a right-lateral strike-slip fault.
I also highlight some normal faults in the subducting Caroline plate to the east of these earthquakes. As the subducting plate flexes downward (during and preceding to subduction), this causes extension in the upper part of the plate. This extension leads to normal faulting as evidenced in the bathymetry. I simply digitized these faults here as a test bed to suggest that there are similar faults along the Yap Trench to the west of the earthquakes (tho the higher resolution multibeam bathymetry here is more spotty, so more difficult to interpret).
The subduction zone associated with the Mariana Trench may continue as the Challenger Deep and then as the Yap Trench, but there may be some strike-slip motion for part of this plate boundary fault (based upon the Fujiwara et al. (2000) hypothesis mentioned in my initial report. However, this strike-slip motion may be located on a separate fault system (often plate boundary motion can be partitioned between separate fault systems, e.g. the Sumatra-Andaman subduction zone and the Sumatra forearc sliver fault). It is not altogether clear what is happening here. There is a lineament to the north of the plate boundary mapped by the USGS here, but we really need some seismic reflection data to confirm this as a possibility.

Below is my interpretive poster for this earthquake.

I plot the seismicity from the past month, with color representing depth and diameter representing magnitude (see legend). I include earthquake epicenters from 1917-2017 with magnitudes M > 6.5 (though there are not many historic earthquakes in this small region).
I plot the USGS fault plane solutions (moment tensors in blue) for the M 6.5, M 6.4, and M 6.1 earthquakes.

  • I placed a moment tensor / focal mechanism legend on the poster. There is more material from the USGS web sites about moment tensors and focal mechanisms (the beach ball symbols). Both moment tensors and focal mechanisms are solutions to seismologic data that reveal two possible interpretations for fault orientation and sense of motion. One must use other information, like the regional tectonics, to interpret which of the two possibilities is more likely.
  • I also include the shaking intensity contours on the map. These use the Modified Mercalli Intensity Scale (MMI; see the legend on the map). This is based upon a computer model estimate of ground motions, different from the “Did You Feel It?” estimate of ground motions that is actually based on real observations. The MMI is a qualitative measure of shaking intensity. More on the MMI scale can be found here and here. This is based upon a computer model estimate of ground motions, different from the “Did You Feel It?” estimate of ground motions that is actually based on real observations.
  • I include the slab contours plotted (Hayes et al., 2012), which are contours that represent the depth to the subduction zone fault. These are mostly based upon seismicity. The depths of the earthquakes have considerable error and do not all occur along the subduction zone faults, so these slab contours are simply the best estimate for the location of the fault. The hypocentral depth plots this close to the location of the fault as mapped by Hayes et al. (2012).
  • Here are the USGS pages for the main earthquake in this sequence.
  • 2017.12.08 M 6.5
  • 2017.12.08 M 6.4
  • 2017.12.09 M 6.1
  • I include some inset figures.

  • In the upper center I include a map showing the tectonics of the region to the north of these earthquakes (Stern et al., 2003). I place a blue star where these earthquakes are located and a green rectangle showing the general limit of this interpretive poster.
  • In the lower right corner I include the tectonic model from Fujuwara et al. (2000) for the subduction of the Caroline Ridge (they hypothesize that the Yap Trench was part of the Mariana Trench, but has been offset due to the attempted (and succeeded?) subduction of the Caroline Ridge).
  • In the upper left corner I include a figure from Emry et al. (2014) that shows how the bending moment normal faults (I mention these above, as outlined in orange in the interpretive poster) are evidenced by normal fault plate solutions.


  • Here is the interpretive poster from my original Earthquake Report.

  • This shows the arc and backarc tectonic elements in this region (Stern et al., 2003).

  • Generalized locality map for the Izu-Bonin-Mariana Arc system. Dashed line labeled STL = Sofugan Tectonic Line.

  • This shows, in cross-section form, the magmatic evolution of the Back-Arc along the Mariana Trench (Stern et al., 2003).

  • Simplified history of the IBM arc system. Shaded areas are magmatically inactive, cross-hatched areas are magmatically active.

  • Here is a map showing the fault plane solutions used by Emry et al. (2014) to evaluate the faulting related to the Mariana Trench.

  • Relocated GCMT earthquakes in map view. Lower hemisphere stereographic projections for earthquakes are shown with compressional P wave quadrants (containing the T axis in black) and dilatational P wave quadrants (containing the P axis in white). The event numbers next to each focal mechanism correspond to Tables 2 and 4. The red arrow shows the angle of convergence of the Pacific plate relative to the Mariana fore arc as determined by Kato et al. [2003]. High-resolution bathymetry data in Northern and Central Mariana are from 2010 Mariana Law of the Sea Cruise [Gardner, 2010] and high-resolution bathymetry data in Southern Mariana are courtesy of F.Martinez. The color scale for bathymetry is positioned below and is the same for all bathymetric maps in the paper. (inset) Tectonic setting of the Philippine Sea. Bathymetry contours are shown by thin black lines. Subduction trenches are shown in blue; spreading centers are shown in red; transforms are shown in green.

  • Here is the larger scale map from Emry et al. (2014) showing some moment tensors and high resolution multibeam bathymetry, revealing fault geomorphology. Below the map is a cross section, showing how these normal faulting earthquakes occur in the downgoing Pacific plate, beneath the subduction zone fault.

  • (top) Relocated GCMT earthquake locations in mapview. Lower hemisphere stereographic projections for earthquakes are shown with compressional quadrants (in black) and dilatational quadrants (in white). Event numbers next to each focal mechanism correspond to Tables 2 and 4. The red arrow shows the angle and rate of Pacific plate convergence relative to the fore arc as determined by Kato et al. [2003]. High-resolution bathymetry data are from Gardner [2010]. The bathymetry scale is the same as in Figure 1. Inset shows the tectonic setting of the Mariana Islands. Bathymetry contours are shown by thin black lines. The trench axis is shown in blue; back-arc spreading center is in red; transform is in green. (bottom) Trench perpendicular cross section with the location of the subduction trench at 0 km; negative distances indicate the distance landward (or west of the trench) and positive distances indicate seaward distances (or east of the trench). Thick black lines show the bathymetry along (17.25°N, 147.3577°E) to (17.2752°N, 148.9311°E). Thick red lines show depth to the Moho used in our waveform inversion. Black squares show the depth to the plate interface at ~17°N from Oakley et al. [2008]; red squares indicate the continuation of the Moho landward from the trench. Focal mechanisms for the region are rotated 90° into cross section. Dilatational quadrants are indicated by white while compressional quadrants are indicated by red. The event numbers next to each focal mechanism correspond to Tables 2 and 4. Vertical exaggeration (VE) is 1.5.

  • This is a cross section showing how Fujiwara et al. (2000) interpret how the Pacific plate (Caroline Ridge) subducts beneath the Philippine Sea plate at the Yap Trench.

  • Schematic across the axis cross section of the northern part of the Yap Trench and its tectonic interpretation.

  • This illustration shows four time steps in the evolution of the plate boundary in this area.

  • Proposed scenario of the evolution of the Yap Trench.


    References:

  • Bird, P., 2003. An updated digital model of plate boundaries in Geochemistry, Geophysics, Geosystems, v. 4, doi:10.1029/2001GC000252, 52 p.
  • Emry, E. L., Wiens, D. A., and Garcia-Castellanos, D., 2014. Faulting within the Pacific plate at the Mariana Trench: Implications for plate interface coupling and subduction of hydrous minerals, J. Geophys. Res. Solid Earth, 119, 3076–3095, doi:10.1002/2013JB010718. Fujiwara, T., Tamura, C., Nishizawa, A., Fujioka, K., Kobayashi, K., and Iwabuschi, Y., 2000. Morphology and tectonics of the Yap Trench in Marine Geophysical Researches, v. 21, p. 69-86
  • Gaina, C. and Müller, R.D., 2007. Cenozoic tectonic and depth/age evolution of the Indonesian gateway and associated back-arc basins in Earth-Science Reviews v. 83, p. 177-203
  • Hayes, G. P., D. J. Wald, and R. L. Johnson (2012), Slab1.0: A three-dimensional model of global subduction zone geometries, J. Geophys. Res., 117, B01302, doi:10.1029/2011JB008524.
  • Holm, R.J., Rosenbaum, G., Richards, S.W., 2016. Post 8 Ma reconstruction of Papua New Guinea and Solomon Islands: Microplate tectonics in a convergent plate boundary setting in Eartth Science Reviews, v. 156, p. 66-81.
  • Müller, R.D., Sdrolias, M., Gaina, C., and Roest, W.R., 2008. Age, spreading rates, and spreading asymmetry of the world’s ocean crust in Geochemistry, Geophysics, Geosystems, v. 9, no. 3. Q04006, doi:10.1029/2007GC001743
  • Okino, K., Ohara, Y., Fujiwara, T., Lee, S-M., Koizumi, K., Nakamura, Y., and Wu., S., 2009. Tectonics of the southern tip of the Parece Vela Basin, Philippine Sea Plate in Tectonophysics, v. 466, p. 213-228.
  • Richards, S., Holm, R., Barber, G., 2011. When slabs collide: A tectonic assessment of deep earthquakes in the Tonga-Vanuatu region in Geology, v. 39, no. 8., p. 787-790
  • Smoczyk, G.M., Hayes, G.P., Hamburger, M.W., Benz, H.M., Villaseñor, Antonio, and Furlong, K.P., 2013, Seismicity of the Earth 1900–2012 Philippine Sea Plate and vicinity: U.S. Geological Survey Open-File Report 2010–1083-M, scale 1:10,000,000, https://dx.doi.org/10.3133/ofr20101083m.
  • Stern, R.J., 2010. The anatomy and ontogeny of modern intra-oceanic arc systems in Kusky, T. M., Zhai, M.-G. & Xiao, W. (eds) The Evolving Continents: Understanding Processes of Continental Growth. Geological Society, London, Special Publications, 338, 7–34.
  • Stern, R. J., Fouch, M. J. & Klemperer, S. 2003. An overview of the Izu–Bonin–Mariana subduction factory. In: Eiler, J. (ed.) Inside the Subduction Factory. American Geophysical Union, Geophysical Monograph, 138, 175–222.
  • Uyeda and Kanamori, 1979. Back-Arc Opening and the Mode of Subduction in JGR, v. 84, no. B3, p. 1049-1061.
  • Zahirovic et al., 2014. The Cretaceous and Cenozoic tectonic evolution of Southeast Asia in Solid Earth, v. 5, p. 227-273, doi:10.5194/se-5-227-2014.

Earthquake Report: Caroline Ridge

There was an earthquake sequence beginning 2017.12.08 along the northern flank of Caroline Ridge in the western Pacific Ocean, near the intersection of the Mariana and Yap trenches.
The two largest earthquakes, M 6.5 and M 6.4, are both strike-slip earthquakes. The M 6.5 is northeast of the M 6.4, so maybe this represents a northeast striking left lateral earthquake. But I rank this a low certainty interpretation. I did not find any geologic maps of this region that might show geologic structures that we might associate with this seismicity, so it is difficult to know if the alternate solution is correct (northwest striking left-lateral strike slip). However, there is possibly a transform (strike-slip) plate boundary fault associated with the southern boundary of the Caroline Ridge (this interpretation is based upon my interpretation of the “Age of Oceanic Lithosphere” map below). There may be synthetic faults to this transform boundary fault, ones sub-parallel to the main fault (the red faultline with purple arrows showing sense of motion). In this case, I would interpret the M 6.5 and M 6.4 earthquakes as northwest striking left-lateral earthquakes.
The Yap and Mariana trenches are formed by the subduction of the Pacific plate beneath the Philippine Sea plate.
The Caroline Islands are volcanic islands formed when the Pacific plate passed over a hotspot (Rehman et al., 2013). As in Hawaii (and other young hotspot volcanic island chains), the younger islands are to the east. The westward movement of this oceanic ridge, formed similar in fashion to the Ninetyeast Ridge, has interacted with the subduction zone in a way that has indented the trench. Prior to the ridge hitting the trench, the Mariana trench may have extended further south. As the ridge interacted with the subduction zone, the megathrust fault moved westwards, offsetting the trench and forming the Yap Trench. There is a great illustration from Fujiwara et al. (2000) below.
There are fossil oceanic spreading ridges within the Caroline plate. These show up in the bathymetry and evidenced by the magnetic anomaly data.

Below is my interpretive poster for this earthquake.

I plot the seismicity from the past month, with color representing depth and diameter representing magnitude (see legend). I include earthquake epicenters from 1917-2017 with magnitudes M > 6.5.
I plot the USGS fault plane solutions (moment tensors in blue and focal mechanisms in orange) for the M 6.5 and M 6.4 earthquakes, in addition to some relevant historic earthquakes.

  • I placed a moment tensor / focal mechanism legend on the poster. There is more material from the USGS web sites about moment tensors and focal mechanisms (the beach ball symbols). Both moment tensors and focal mechanisms are solutions to seismologic data that reveal two possible interpretations for fault orientation and sense of motion. One must use other information, like the regional tectonics, to interpret which of the two possibilities is more likely.
  • I also include the shaking intensity contours on the map. These use the Modified Mercalli Intensity Scale (MMI; see the legend on the map). This is based upon a computer model estimate of ground motions, different from the “Did You Feel It?” estimate of ground motions that is actually based on real observations. The MMI is a qualitative measure of shaking intensity. More on the MMI scale can be found here and here. This is based upon a computer model estimate of ground motions, different from the “Did You Feel It?” estimate of ground motions that is actually based on real observations.
  • I include the slab contours plotted (Hayes et al., 2012), which are contours that represent the depth to the subduction zone fault. These are mostly based upon seismicity. The depths of the earthquakes have considerable error and do not all occur along the subduction zone faults, so these slab contours are simply the best estimate for the location of the fault. The depth is probably not very well constrained due to the geometry and lack of seismometer coverage in the oceanic setting.
  • Here are the USGS pages for the main earthquake in this sequence.
  • 2017.12.08 M 6.5
  • 2017.12.08 M 6.4
  • I include some inset figures.

  • In the lower left corner is a great figure showing the generalized plate tectonic boundaries in this region of the equatorial Pacific Ocean (Holm et al., 2016). I place a blue star in the general location of the M 6.5 and M 6.4 earthquakes (also plotted in other inset figures).
  • In the upper right corner I include a large scale view of the regional tectonics (Zahirovic et al., 2014). Plate boundary fault symbology (and other features, like fracture zones) is shown in the legend. I place a blue star on the map in the general location of this earthquake epicenter. There are two east-west green lines in the Caroline plate. These are the axes of fossil spreading centers (‘W. Caroline Trough’ & ‘Kilssguard Trough’).
  • In the lower right corner is a map that shows the age of the oceanic crust in the western Pacific (Müller et al., 2008). The big blue bleb is the older Pacific plate crust. The CA labels the Caroline plate. Note the two east-west trending magenta lines, these are the fossil spreading centers. See how the crust gets older to the north and south of these ancient spreading ridges. I also locate these spreading ridges on the main map.
  • In the upper left corner is a view of the seismicity with a better view of the bathymetry than in the main map. Note how the Caroline Ridge is an ~east-west trending (N80W or so) lighter blue area, because the ocean depth is shallower here. This region of the Pacific plate may be overthickened during its formation. The M 6.4 had a pretty deep hypocenter. Even if there was some considerable uncertainty, this is a deep earthquake for oceanic crust (~7 km on average for oceanic crust).
  • To the right of the inset seismicity map is an illustration that shows an interpretation about how the Caroline Islands, and surrounding crust, was formed (Rehman et al., 2013). Rehman et al. (2013) show how the Pacific plate passed over a hotspot, creating the Caroline Islands (like Hawaii) and leading to a thicker crust here (see panel B).


  • Here is a map from the USGS that shows the USGS seismicity from the 20th century or so (Smocyk et al., 2010). The cross sections show the earthquake hypocenters in orientations that reveal the various types of subduction zones in this region of Earth. For example, the northern Mariana Trench shows a steeply dipping megathrust fault (and very deep seismicity), while cross section E-E’ in the southern Mariana Trench is not as deep. Click on the map to see the entire 92 MB pdf poster.

  • Here is the plate tectonic map from Zahirovic et al. (2014), which shows the Sorol Trough as a fracture zone (strike-slip).

  • Regional tectonic setting with plate boundaries (MORs/transforms = black, subduction zones = teethed red) from Bird (2003) and ophiolite belts representing sutures modified from Hutchison (1975) and Baldwin et al. (2012). West Sulawesi basalts are from Polvé et al. (1997), fracture zones are from Matthews et al. (2011) and basin outlines are from Hearn et al. (2003)

  • This is a gravity anomaly map for the western Pacific north of Papua New Guinea (Gaina and Müller, 2007). Overlain on the map are magnetic anomaly isochrons (labeled C6 for example; lower chron numbers are younger). Note the fossil spreading center on the east is just younger than isochron C8, possibly the same for the West Caroline Trough on the west. Also clearly shown on this map are the subduction zones, which have negative gravity anomalies due to the downward flexing oceanic lithosphere as it approaches the trench.

  • Gravity anomaly derived from satellite altimetry (Sandwell and Smith, 2005) for the Caroline sea region. Superimposed are the interpreted magnetic lineations (C8–C16 stand for chron numbers, see detailed interpretation in Figs. 3 and 4). Locations of DSDP and ODP drilling are shown in white boxes. Abbreviations: CR—Caroline Ridge, PKR—Palau Kyushu Ridge, WCR—West Caroline Ridge, KT—Kiilsgaard Trough, PVB—Parece Vela Basin, WPB — West Philippine Basin.

  • Here is the crust age map from the poster (Müller et al., 2008).

  • Oceanic lithospheric age. the following isochrons are shown: West Philippine Basin (18y, 20o, 21o, 24o, 26o), Caroline Sea (8o, 10o, 11o, 13y, 15o, 16y), Ayu Trough (3o, 5o), Parece Vela/Shikoku Basin (5Dy, 6o, 6By, 7o, 8o, 9o), Mariana Trough (1o, 2Ao, 3o), South China Sea (5Dy, 6o, 6By, 7o, 8o, 19o, 11o), Celebes Sea (16o, 17o, 18o, 19o, 21o), Sulu Sea (3o, 5o), South Fiji Basin (7o, 8o, 9o, 10o, 11o), North Fiji Basin (1o), Solomon Sea (17o, 18o), North Loyalty Basin (16y, 17o, 18o, 20o), and Lau Basin (1o, 2Ao, 3o). SCS, South China Sea; SS, Solomon Sea; CS, Celebes Sea; BS, Bismark Sea; PS, Philippine Sea; AT, Ayu Trough; CA, Caroline Sea; PVB, Parece Vela Basin; SB, Shikoku Basin; MT,
    Marianas Trough; SO, Solomon Sea; CO, Coral Sea; LO, North Loyalty Basin; NF, North Fiji Basin; SF, South Fiji Basin; LB, Lau Basin.

  • Here is another oceanic crust age map, with more details in the region of the Caroline plate (Gaina and Müller, 2007).

  • Fig. 12. Set of tectonic reconstructions that depict the evolution of oceanic crust north of Australia since Middle Eocene (50 Ma). Light yellow represent continental blocks, rotated present day coastline are in black, island arcs are colored in pale brown. Grey areas depict regions with insufficient data to constrain paleo-age grids. Black lines are active plate boundaries (if dashed—unconstrained plate boundary), light grey lines are extinct spreading ridges. The two blue circles show the location of the Manus (west) and Caroline (east) hotspots assuming an underlying Pacific mantle. An additional position for the Manus hotspot depicts its location if part of moving Indian Ocean hotspot (green circle). Large Igneous Provinces (in this case Ontong Java Plateau, NE of Australia and Kerguelen and Broken Ridge plateaus, SWof Australia) are colored in magenta.

  • This is a cross section showing how Fujiwara et al. (2000) interpret how the Pacific plate (Caroline Ridge) subducts beneath the Philippine Sea plate at the Yap Trench.

  • Schematic across the axis cross section of the northern part of the Yap Trench and its tectonic interpretation.

  • This illustration shows four time steps in the evolution of the plate boundary in this area.

  • Proposed scenario of the evolution of the Yap Trench.

  • This shows an alternative hypothesis for the formation of the Yap Trench (Okino et al., 2009).

  • One hypothesis for the evolution of the southern tip of the PVB. (a) The landward side of the Yap Trench consists of island arc crust and remnant lithosphere inherited from old Philippine Sea. Backarc extension in E–W direction split the arc crust and new oceanic crust was formed. (b) Overlapping rifts developed at the southern tip of the PVB. (c) The southernmost overlapping rift system was abandoned and the NE–SWspreading occurred in the main PVB.

  • Here is a comparison of the two earthquakes from IPGP. Below are the links to the earthquake pages from IPGP. The IPGP depths are shallower, but still on the deep side for oceanic crust earthquakes.
  • 2017.12.08 M 6.5
  • 2017.12.08 M 6.4

  • Here is a map of the Pacific with the location of hotspots designated by orange dots (Nunn et al., 2016). The Caroline volcanic chain is ~2,800 km long.

  • Island locations within the Pacific Basin showing their relationship with principal island-forming island locations. Plate boundaries (in red) and hotspots active within the past 43 Ma (orange circles) are also shown. Active convergent plate boundaries are shown by lines with triangles pointing in the downthrust direction; all other plate boundaries are undistinguished, although most are transform except for most of the East Pacific Rise where divergence occurs. Hotspot locations are from King and Adam (2014).

  • This shows the arc and backarc tectonic elements in this region (Stern et al., 2003).

  • Generalized locality map for the Izu-Bonin-Mariana Arc system. Dashed line labeled STL = Sofugan Tectonic Line.

  • This shows, in cross-section form, the magmatic evolution of the Back-Arc along the Mariana Trench (Stern et al., 2003).

  • Simplified history of the IBM arc system. Shaded areas are magmatically inactive, cross-hatched areas are magmatically active.

  • This is the cross section from Hussong and Fryer (1982) showing the crustal structure in the region of Deep Sea Drilling Project Site 60. More about this site is available online here. The upper panel is the original figure (showing the drill sites) and the lower panel is an updated version. These figures also show the velocity model in km/second (this shows how the seismic velocity varies through different materials). Note the rough incoming oceanic crust (see the Magellan Seamounts on the Pacific plate). The rough plate is also visible in the main poster above.

  • Physiographic diagram and crustal structure across the Mariana Trench and arc and the Mariana Trough, with Leg 60 site location shown. Crustal structure generalized from IODP site survey data by D. Hussong. Physiography drawn from IPOD site survey data by W. Coulbourn. This diagram summarizes the data and structural interpretations available prior to drilling.


  • Here Stern (2010) updates the cross section of Uyeda and Kanamori (1979) even further.

  • Comparison of Andean-type arc (a) and intra-oceanic arc system (b), greatly simplified.

    • Here is the seismicity cross section prepared by Fouch also an inset in the poster above.

    • Map view of bathymetry and seismicity in the IBM subduction zone using the earthquake catalog of Engdahl, van der Hilst & Buland 1998. Circles denote epicentral locations; lighter circles represent shallower events, darker circles represent deeper events. Black lines denote cross sectional areas depicted in 6 profiles on right, organized from N to S. Black circles represent hypocentral locations in volume ~60 km to each side of the lines shown on the map at left. Large variations in slab dip and maximum depth of seismicity are apparent. Distance along each section is measured from the magmatic arc. A) Northern Izu-Bonin region. Slab dip is ~45°; seismicity tapers off from ~175 km to ~300 km depth but increases around 400 km, and terminates at ~475 km. B) Central Izu Bonin region. Slab dip is nearly vertical; seismicity tapers off from ~100 km to ~325 km but increases in rate and extends horizontally around 500 km, and terminates at ~550 km. C) Southern Izu Bonin region. Slab dip is ~50°; seismicity is continuous to ~200 km, but a very few anomalous events are evident down to ~600 km. D) Northern Mariana region. Slab dip is ~60°; seismicity is continuous to ~375 km and terminates at ~400 km, but a very few anomalous events are evident down to ~600 km. E) Central Mariana region. Slab dip is vertical; seismicity tapers off slightly between ~275 km and ~575 km, but is essentially continuous. A pocket of deep events around 600 km exists, as well as 1 deep event at 680 km. F) Southern Mariana region. Slab dip is ~55°; seismicity is continuous to ~225 km, with an anomalous event at 375 km.


      References:

    • Bird, P., 2003. An updated digital model of plate boundaries in Geochemistry, Geophysics, Geosystems, v. 4, doi:10.1029/2001GC000252, 52 p.
    • Fujiwara, T., Tamura, C., Nishizawa, A., Fujioka, K., Kobayashi, K., and Iwabuschi, Y., 2000. Morphology and tectonics of the Yap Trench in Marine Geophysical Researches, v. 21, p. 69-86
    • Gaina, C. and Müller, R.D., 2007. Cenozoic tectonic and depth/age evolution of the Indonesian gateway and associated back-arc basins in Earth-Science Reviews v. 83, p. 177-203
    • Hayes, G. P., D. J. Wald, and R. L. Johnson (2012), Slab1.0: A three-dimensional model of global subduction zone geometries, J. Geophys. Res., 117, B01302, doi:10.1029/2011JB008524.
    • Holm, R.J., Rosenbaum, G., Richards, S.W., 2016. Post 8 Ma reconstruction of Papua New Guinea and Solomon Islands: Microplate tectonics in a convergent plate boundary setting in Eartth Science Reviews, v. 156, p. 66-81.
    • Müller, R.D., Sdrolias, M., Gaina, C., and Roest, W.R., 2008. Age, spreading rates, and spreading asymmetry of the world’s ocean crust in Geochemistry, Geophysics, Geosystems, v. 9, no. 3. Q04006, doi:10.1029/2007GC001743
    • Okino, K., Ohara, Y., Fujiwara, T., Lee, S-M., Koizumi, K., Nakamura, Y., and Wu., S., 2009. Tectonics of the southern tip of the Parece Vela Basin, Philippine Sea Plate in Tectonophysics, v. 466, p. 213-228.
    • Richards, S., Holm, R., Barber, G., 2011. When slabs collide: A tectonic assessment of deep earthquakes in the Tonga-Vanuatu region in Geology, v. 39, no. 8., p. 787-790
    • Smoczyk, G.M., Hayes, G.P., Hamburger, M.W., Benz, H.M., Villaseñor, Antonio, and Furlong, K.P., 2013, Seismicity of the Earth 1900–2012 Philippine Sea Plate and vicinity: U.S. Geological Survey Open-File Report 2010–1083-M, scale 1:10,000,000, https://dx.doi.org/10.3133/ofr20101083m.
    • Stern, R.J., 2010. The anatomy and ontogeny of modern intra-oceanic arc systems in Kusky, T. M., Zhai, M.-G. & Xiao, W. (eds) The Evolving Continents: Understanding Processes of Continental Growth. Geological Society, London, Special Publications, 338, 7–34.
    • Stern, R. J., Fouch, M. J. & Klemperer, S. 2003. An overview of the Izu–Bonin–Mariana subduction factory. In: Eiler, J. (ed.) Inside the Subduction Factory. American Geophysical Union, Geophysical Monograph, 138, 175–222.
    • Uyeda and Kanamori, 1979. Back-Arc Opening and the Mode of Subduction in JGR, v. 84, no. B3, p. 1049-1061.
    • Zahirovic et al., 2014. The Cretaceous and Cenozoic tectonic evolution of Southeast Asia in Solid Earth, v. 5, p. 227-273, doi:10.5194/se-5-227-2014.