Earthquake Report: Delaware!

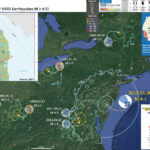
Today there was an earthquake in the state of Delaware, a region that does not have many mapped surface faults (I could not find any active faults in a couple hours of lit review). This area also does not have much historic seismicity, however there is an Open File Report from the Delaware Geological Survey, published in 2001. Today’s M 4.1 earthquake matches the record for the largest earthquake of record. There was a M 4.1 in the Wilmington, Delaware region on 1871.10.09 (see OFR42 linked above). The Wilmington region seems to be the most seismically active part of Delaware. Today’s earthquake, to the northeast of Dover, Delaware, happened in a place that has only had a single earthquake in the historic record (M 3.3 on 1879.03.26).
The earthquake happened along the coast plain, where the surficial geology is mapped as marsh deposits (underlain by Quaternary sediments, then by Tertiary sediments). I include a geological map below, along with a cross section. There does not appear to be any structural control for today’s earthquake (but I have only spent a couple hours on this, and the cross section is not very deep). To the south, in Maryland, there is an impact structure (from a Bolide impact). But the structures from this probably don’t extend this far north. There is probably some structures related to the active tectonics of the past (as mapped in the Appalachans to the west), and this earthquake is probably reactivating one of those structures.
Also, there is a possible chance that this is a foreshock. But we won’t know until later if this is the case.
Here is the USGS website for this 2017.11.30 M 4.1 earthquake.

Below is my interpretive poster for this earthquake.

I plot the seismicity from the past month, with color representing depth and diameter representing magnitude (see legend). I include earthquake epicenters from 1917-2017 with magnitudes M > 4.5. I include fault plane solutions (moment tensors in blue and focal mechanisms in orange) for the larger earthquakes in the eastern USA.

  • I placed a moment tensor / focal mechanism legend on the poster. There is more material from the USGS web sites about moment tensors and focal mechanisms (the beach ball symbols). Both moment tensors and focal mechanisms are solutions to seismologic data that reveal two possible interpretations for fault orientation and sense of motion. One must use other information, like the regional tectonics, to interpret which of the two possibilities is more likely. The structural grain of the Appalachians are oriented in a north-northeastern orientation, so the left-lateral northeast striking solution is slightly favored. However, more analysis will need to be done (or more lit review).
  • I also include the shaking intensity contours on the map. These use the Modified Mercalli Intensity Scale (MMI; see the legend on the map). This is based upon a computer model estimate of ground motions, different from the “Did You Feel It?” estimate of ground motions that is actually based on real observations. The MMI is a qualitative measure of shaking intensity. More on the MMI scale can be found here and here. This is based upon a computer model estimate of ground motions, different from the “Did You Feel It?” estimate of ground motions that is actually based on real observations. I include MMI contours for the earthquakes with fault plane solutions plotted (except, I do not include the MMI contours for the 2011.08.25 M 4.5 earthquake, an aftershock of the Mineral, Virginia M 5.8 earthquake.
  • I include some inset figures.

  • In the upper left corner I include an inset of the Geological Map of Kent County, Delaware (Ramsey, 2007). I include the legend for the relevant geological units on the map and on the cross section below. I place a blue star in the general location of the M 4.1 epicenter. Note that there are no mapped faults on this map (the geologic contacts are depositional contacts). Here is a link to a pdf of the map (19 MB pdf).
  • In the lower right corner I include the cross section B-B’ that shows the subsurface geology in this region (Ramsey, 2007). This cross section is constructed from well log data. The location of the cross section is shown on the geologic map as a red line. The well log locations are the vertices (labeled dots) along this red line. Only the easternmost portion of the cross section is represented on the map in the interpretive poster.
  • In the upper right corner is a plot showing “Did You Feel It?” (DYFI) responses for two earthquakes. This shows how earthquakes on the west coast attenuate faster than earthquakes on the east coast. Basically, on the west coast, due to the geology there, seismic waves are absorbed by the Earth with distance. While, on the east coast, they do so to a lesser degree. The result is that earthquakes on the east coast are felt from a greater distance than those on the west coast. This comparison is for between the 2004.09.28 M 6.0 Parkfield Earthquake in California and the 2011.08.23 M 5.8 Mineral Virginia Earthquake.
  • Below the DYFI comparison figure is a map from the 2014 USGS National Seismic Hazard Map project. This shows a simplified view of seismic hazard for the USA. “The 2014 U.S. Geological Survey (USGS) National Seismic Hazard Maps display earthquake ground motions for various probability levels across the United States and are applied in seismic provisions of building codes, insurance rate structures, risk assessments, and other public policy.” Today’s earthquake happened in a region of low seismic hazard (due to the lack of active faults in the region and the low background seismicity).


  • Here is the geologic map for the Dover, Delaware region (Ramsey, 2007) that is included in the interpretive poster above.

  • Here is cross section B-B’ for the Dover, Delaware region (Ramsey, 2007) that is included in the interpretive poster above. Note the petrophysical logs that the correlations are made with. The Tch unit is well correlated, especially in the western region of this section. The unit Tc has more variability within the unit, but it represents more time and geologic thickness. Note that there are no faults in this cross section (albeit a shallow cross section, only about 100 meters deep).

  • The Ramapo fault system is one of the best known fault systems in the Mid-Atlantic region. Today’s M 4.1 is not related to this fault system. Below is a map showing this fault system reltaed to the topography in the region. Todays’ M 4.1 earthquake is located behind the legend of this map, just to the south of the “g” in the word Furlong.

  • Here is a figure that shows a comparison between several earthquakes in this region. I plot intensity maps above and empirical relations between shaking and distance to the earthquake below. It is important to note that these maps are just models of ground shaking; the “Did You Feel It?” maps are better to show the actual felt intensities as they are based upon reports from real people. The solid and dashed lines represent the mean and 2 sigma range of the empirical relations between shaking and distance. Basically, thousands of earthquakes have been measured by seismometers. These measurements have been entered into a database and filtered by various factors. The filtered data have been regressed and the equation for these regression lines are used to estimate ground shaking at locations relative to their distance from the earthquake. In most cases, for earthquakes of smaller magnitude, the distance is measured as a point source from the epicentral location (which is not realistic). However, for larger earthquakes, where a fault can be resolved from the seismologic data (source inversions), the rectilinear fault is used as a source to model the intensities.
  • There was an aftershock to the 2011.08.23 M 5.8 Mineral, VA earthquake, an M 4.5 earthquake. This M 4.5 earthquake is more comparable to today’s M 4.1 earthquake. The maps are at different scales (unfortunately). However, the regressions are at the same scale. Note that the M 4.1 and M 4.5 have similar regression lines (due to their similar magnitude).

  • Here is the DYFI comparison map from the USGS. More can be found about the 2011.08.23 M 5.8 earthquake at the USGS website here.

  • Earthquakes in the central and eastern U.S., although less frequent than in the western U.S., are typically felt over a much broader region. East of the Rockies, an earthquake can be felt over an area as much as ten times larger than a similar magnitude earthquake on the west coast. A magnitude 4.0 eastern U.S. earthquake typically can be felt at many places as far as 100 km (60 mi) from where it occurred, and it infrequently causes damage near its source. A magnitude 5.5 eastern U.S. earthquake usually can be felt as far as 500 km (300 mi) from where it occurred, and sometimes causes damage as far away as 40 km (25 mi).

  • Here is a great video from IRIS that helps explain Earthquake Instensity.
  • Here is the generalized 2014 Seismic Hazard map for the USA.

  • The 2014 U.S. Geological Survey (USGS) National Seismic Hazard Maps display earthquake ground motions for various probability levels across the United States and are applied in seismic provisions of building codes, insurance rate structures, risk assessments, and other public policy. The updated maps represent an assessment of the best available science in earthquake hazards and incorporate new findings on earthquake ground shaking, faults, seismicity, and geodesy. The USGS National Seismic Hazard Mapping Project developed these maps by incorporating information on potential earthquakes and associated ground shaking obtained from interaction in science and engineering workshops involving hundreds of participants, review by several science organizations and State surveys, and advice from expert panels and a Steering Committee. The new probabilistic hazard maps represent an update of the seismic hazard maps; previous versions were developed by Petersen and others (2008) and Frankel and others (2002), using the methodology developed Frankel and others (1996). Algermissen and Perkins (1976) published the first probabilistic seismic hazard map of the United States which was updated in Algermissen and others (1990).
    The National Seismic Hazard Maps are derived from seismic hazard curves calculated on a grid of sites across the United States that describe the annual frequency of exceeding a set of ground motions. Data and maps from the 2014 U.S. Geological Survey National Seismic Hazard Mapping Project are available for download below. Maps for available periods (0.2 s, 1 s, PGA) and specified annual frequencies of exceedance can be calculated from the hazard curves. Figures depict probabilistic ground motions with a 2 percent probability of exceedance. Spectral accelerations are calculated for 5 percent damped linear elastic oscillators. All ground motions are calculated for site conditions with Vs30=760 m/s, corresponding to NEHRP B/C site class boundary.


Earthquake Report: Loyalty Islands Update #1

I just got back from one of the best conferences that I have ever attended, PATA Days 2017 (Paleoseismology, Active Tectonics, and Archeoseismology). This conference was held in Blenheim, New Zealand and was planned to commemorate the 300 year anniversary of the 1717 AD Alpine fault earthquake (the possibly last “full” margin rupture of the Alpine fault, a strike-slip plate boundary between the Australia and Pacific plates, with a slip rate of about 30 mm per year, tapering northwwards as synthetic strike slip faults splay off from the AF). While the meeting was being planned, the 2016 M 7.8 Kaikoura earthquake happened, which expanded the subject matter somewhat.
Prior to the meeting, we all attended a one day field trip reviewing field evidence for surface rupture and coseismic deformation and landslides from the M 7.8 earthquake in the northern part of the region. The road is still cut off and being repaired, so one cannot drive along the coast between Blenheim and Christchurch (will be open in a few months). During the meeting, there were three days of excellent talks (check out #PATA17 on twitter). Following the meeting, a myajority of the group attended a three day field trip to review the geologic evidence as reviewed by earthquake geologists here of historic and prehistoric earthquakes on the Alpine fault and faults along the Marlborough fault zone (faults that splay off the Alpine fault, extracting plate boundary motion from the Alpine fault). The final day we saw field evidence of rupture from the M 7.8 earthquake, including a coseismic landslide, which blocked a creek. The creek later over-topped some adjacent landscape, down-cutting and exposing stratigraphy that reveals evidence for past rupture on that fault. The trip was epic and the meeting was groundbreaking (apologies for the pun).
This region of the southern New Hebrides subduction zone is formed by the subduction of the Australia plate beneath the Pacific plate. There has been an ongoing earthquake sequence since around Halloween (I prepared a report shortly after I arrived in New Zealand; here is my report for the early part of this sequence). Today there was the largest magnitude earthquake in the sequence. This M 7.0 earthquake generated a tsunami measured on tide gages in the region. However, there was a low likelihood of a transpacific tsunami. The sequence beginning several weeks ago included outer rise extension earthquakes and associated thrust fault earthquakes along the upper plate. I have discussed how the lower/down-going plates in a subduction zone flex and cause extension in this flexed bulge (called the outer rise because it bulges up slightly). Here is my report discussing a possibly triggered outer rise earthquake associated with the 2011 M 9.0 Tohoku-oki earthquake. Here is my report for this M 6.0 earthquake from 2016.08.20.
While looking into this further today, I found that there was a similar sequence (to the current sequence) in 2003-2004. For both sequences, there is an interplay between the upper and lower plates, with compressional earthquakes in the upper plate and extensional earthquakes in the lower plate. Based upon the 2003-2004 sequence, it is possible that there may be a forthcoming compressional earthquake. However, there are many factors that drive the changes in static stress along subduction zones and how that stress may lead to an earthquake (so, there may not be a large earthquake in the upper plate). This is just a simple comparison (albeit for a section of the subduction zone in close proximity).

  • I list below some USGS earthquake pages for earthquakes in this report.
  • These are earthquakes from this current sequence.
  • 2017.10.31 M 6.8
  • 2017.11.16 M 5.9
  • 2017.11.19 M 6.4
  • 2017.11.19 M 5.9
  • 2017.11.19 M 6.6
  • 2017.11.19 M 7.0
  • 2017.11.20 M 5.8
  • These are earthquakes from the 2003-2004 sequence.
  • 2003.12.25 M 6.5
  • 2003.12.26 M 6.8
  • 2003.12.27 M 6.7
  • 2003.12.27 M 7.3
  • 2003.12.27 M 6.3
  • 2004.01.03 M 6.4
  • 2004.01.03 M 7.1

Below is my interpretive poster for this earthquake.

I plot the seismicity from the past month, with color representing depth and diameter representing magnitude (see legend). I include earthquake epicenters from 1917-2017 with magnitudes M > 6.5.

  • I placed a moment tensor / focal mechanism legend on the poster. There is more material from the USGS web sites about moment tensors and focal mechanisms (the beach ball symbols). Both moment tensors and focal mechanisms are solutions to seismologic data that reveal two possible interpretations for fault orientation and sense of motion. One must use other information, like the regional tectonics, to interpret which of the two possibilities is more likely. The moment tensor shows northeast-southwest compression, perpendicular to the convergence at this plate boundary. Most of the recent seismicity in this region is associated with convergence along the New Britain trench or the South Solomon trench.
  • I also include the shaking intensity contours on the map. These use the Modified Mercalli Intensity Scale (MMI; see the legend on the map). This is based upon a computer model estimate of ground motions, different from the “Did You Feel It?” estimate of ground motions that is actually based on real observations. The MMI is a qualitative measure of shaking intensity. More on the MMI scale can be found here and here. This is based upon a computer model estimate of ground motions, different from the “Did You Feel It?” estimate of ground motions that is actually based on real observations.
  • I include the slab contours plotted (Hayes et al., 2012), which are contours that represent the depth to the subduction zone fault. These are mostly based upon seismicity. The depths of the earthquakes have considerable error and do not all occur along the subduction zone faults, so these slab contours are simply the best estimate for the location of the fault.
  • I include some inset figures.

  • In the upper right corner I include the map and seismicity cross section from Benz et al. (2011). These maps plot the seismicity and this reveals the nature of the downgoing subducting slab. Shallower earthquakes are generally more related to the subduction zone fault or deformation within either plate (interplate and intraplate earthquakes). While the deeper earthquakes are not megathrust fault related, but solely due to internal crustal deformation (intraplate earthquakes). I highlight the location of the cross section with a blue line labeled G-G’ (and place this cross section in the general location on the main interpretive map.
  • In the lower left corner I include some tide gage records from the region, which are from the UNESCO IOC online Sea Level Monitoring Facility. These three records are labeled A, B, and C and the locations of these gages are designated by red dots on the main map, along with A, B, and C labels in white.
  • Above the raw tide gage records are some reported wave heights from the Pacific Tsunami Warning Center. These are basically the wave heights recorded on the tide gages, but interpreted by a subject matter expert to estimate the timing of wave arrival and the water surface elevation in excess of the ambient sea level.
  • In the lower right corner I include a comparison between the 2003-2004 sequence and the current and ongoing sequence. I plot moment tensors for earthquakes [largely] from after my initial report (though I include the largest magnitude earthquake in the upper plate). I plot USGS moment tensors for the larger magnitude earthquakes from the 2003 sequence. I also label the along strike extent for these two sequences. They overlap by a very small amount, but generally seem to be happening in adjacent sections of the fault system here. All things being equal, the 2003 sequence included M 7 earthquakes in both the upper and lower plates. If the 2017 sequence is similar, there may still be an M 7 earthquake in the upper plate. Of course, there is also a possiblity of a large subduction zone earthquake here too. We just don’t really have enough information to really know (it is difficult to know, if not impossible, the state of stress on the megathrust fault. this make it impossible to predict if there will be more or larger earthquakes here.).
  • In the upper left corner I include a figure from Lay et al. (2011) that shows the general tectonic setting at subduction zone faults. There are three examples. Lay et al. (2011) modeled the Japan trench subduction zone after the 2011 M 9.0 Tohoku-Oki earthquake and estimated the static stress changes imparted in the adjacent crust as a result of the M 9.0 earthquake. Lay et al. (2011) determined that the downgoing plate to the east of the M 9.0 earthquake experienced an increase in static stress. This was used to support the hypothesis that the M 6.0 earthquake along the outer rise, east of the M 9.0 slip patch, was statically triggered by the M 9.0 earthquake. The two sequences along the southern New Hebrides trench are probably playing out a similar fault-geometry and static stress relation.


  • Here is my poster from the beginning of this sequence.

  • Here is a map from the USGS report (Benz et al., 2011). Read more about this map on the USGS website. Earthquakes are plotted with color related to depth and circle diameter related to magnitude. Today’s M 6.8 earthquake occurred south of cross section G-G’.

  • This is the legend.

  • Here is a cross section showing the seismicity along swatch profile G-G’.

  • Craig et al. (2014) evaluated the historic record of seismicity for subduction zones globally. In particular, the evaluated the relations between upper and lower plate stresses and earthquake types (cogent for the southern New Hebrides trench). Below is a figure from their paper for this part of the world. I include their figure caption below in blockquote.

  • Outer-rise seismicity along the New Hebrides arc. (a) Seismicity and focal mechanisms. Seismicity at the southern end of the arc is dominated by two major outer-rise normal faulting events, and MW 7.6 on 1995 May 16 and an MW 7.1 on 2004 January 3. Earthquakes are included from Chapple & Forsyth (1979); Chinn & Isacks (1983); Liu & McNally (1993). (b) Time versus latitude plot.

  • Here is a summary figure from Craig et al. (2014) that shows different stress configurations possibly existing along subduction zones.

  • Schematic diagram for the factors influencing the depth of the transition from horizontal extension to horizontal compression beneath the outer rise. Slab pull, the interaction of the descending slab with the 660 km discontinuity (or increasing drag from the surround mantle), and variations in the interface stress influence both the bending moment and the in-plane stress. Increases in the angle of slab dip increases the dominance of the bending moment relative to the in-plane stress, and hence moves the depth of transition towards the middle of the mechanical plate from either an shallower or a deeper position. A decrease in slab dip enhances the influence of the in-plane stress, and hence moves the transition further from the middle of the mechanical plate, either deeper for an extensional in-plane stress, or shallower for a compressional in-plane stress. Increased plate age of the incoming plate leads to increases in the magnitude of ridge push and intraplate thermal contraction, increasing the in-plane compressional stress in the plate prior to bending. Dynamic topography of the oceanic plate seawards of the trench can result in either in-plane extension or compression prior to the application of the bending stresses.

  • Here is a great figure from here, the New Caledonian Seismologic Network. This shows how geologists have recorded uplift rates along dip (“perpendicular” to the subduction zone fault). On the left is a map and on the right is a vertical profile showing how these rates of uplift change east-west. This is the upwards flexure related to the outer rise, which causes extension in the upper part of the downgoing/subducting plate.

  • The subduction of the Australian plate under the Vanuatu arc is also accompanied by vertical movements of the lithosphere. Thus, the altitudes recorded by GPS at the level of the Quaternary reef formations that cover the Loyalty Islands (Ouvéa altitude: 46 m, Lifou: 104 m and Maré 138 m) indicate that the Loyalty Islands accompany a bulge of the Australian plate. just before his subduction. Coral reefs that have “recorded” the high historical levels of the sea serve as a reference marker for geologists who map areas in uprising or vertical depression (called uplift and subsidence). Thus, the various studies have shown that the Loyalty Islands, the Isle of Pines but alsothe south of Grande Terre (Yaté region) rise at speeds between 1.2 and 2.5 millimeters per decade.

  • Here are the figures from Richards et al. (2011) with their figure captions below in blockquote.
  • The main tectonic map

  • bathymetry, and major tectonic element map of the study area. The Tonga and Vanuatu subduction systems are shown together with the locations of earthquake epicenters discussed herein. Earthquakes between 0 and 70 km depth have been removed for clarity. Remaining earthquakes are color-coded according to depth. Earthquakes located at 500–650 km depth beneath the North Fiji Basin are also shown. Plate motions for Vanuatu are from the U.S. Geological Survey, and for Tonga from Beavan et al. (2002) (see text for details). Dashed line indicates location of cross section shown in Figure 3. NFB—North Fiji Basin; HFZ—Hunter Fracture Zone.

  • Here is the map showing the current configuration of the slabs in the region.

  • Map showing distribution of slab segments beneath the Tonga-Vanuatu region. West-dipping Pacifi c slab is shown in gray; northeast-dipping Australian slab is shown in red. Three detached segments of Australian slab lie below the North Fiji Basin (NFB). HFZ—Hunter Fracture Zone. Contour interval is 100 km. Detached segments of Australian plate form sub-horizontal sheets located at ~600 km depth. White dashed line shows outline of the subducted slab fragments when reconstructed from 660 km depth to the surface. When all subducted components are brought to the surface, the geometry closely approximates that of the North Fiji Basin.

  • This is the cross section showing the megathrust fault configuration based on seismic tomography and seismicity.

  • Previous interpretation of combined P-wave tomography and seismicity from van der Hilst (1995). Earthquake hypocenters are shown in blue. The previous interpretation of slab structure is contained within the black dashed lines. Solid red lines mark the surface of the Pacifi c slab (1), the still attached subducting Australian slab (2a), and the detached segment of the Australian plate (2b). UM—upper mantle;
    TZ—transition zone; LM—lower mantle.

  • Here is their time step interpretation of the slabs that resulted in the second figure above.

  • Simplifi ed plate tectonic reconstruction showing the progressive geometric evolution of the Vanuatu and Tonga subduction systems in plan view and in cross section. Initiation of the Vanuatu subduction system begins by 10 Ma. Initial detachment of the basal part of the Australian slab begins at ca. 5–4 Ma and then sinking and collision between the detached segment and the Pacifi c slab occur by 3–4 Ma. Initial opening of the Lau backarc also occurred at this time. Between 3 Ma and the present, both slabs have been sinking progressively to their current position. VT—Vitiaz trench; dER—d’Entrecasteaux Ridge.

  • Here is a figure that shows the coulomb stress changes due to the 2011 earthquake. Basically, this shows which locations on the fault where we might expect higher likelihoods of future earthquake slip. I include their figure caption below as a blockquote.

  • Maps of the Coulomb stress change predicted for the joint P wave, Rayleigh wave and continuous GPS inversion in Fig. 2. The margins of the latter fault model are indicated by the box. Two weeks of aftershock locations from the U.S. Geological Survey are superimposed, with symbol sizes scaled relative to seismic magnitude. (a) The Coulomb stress change averaged over depths of 10–15 km for normal faults with the same westward dipping fault plane geometry as the Mw 7.7 outer rise aftershock, for which the global centroid moment tensor mechanism is shown. (b) Similar stress changes for thrust faults with the same geometry as the mainshock, along with the Mw 7.9 thrusting aftershock to the south, for which the global centroid moment tensor is shown.

  • Here is a figure schematically showing how subduction zone earthquakes may increase coulomb stress along the outer rise. The outer rise is a region of the downgoing/subducting plate that is flexing upwards. There are commonly normal faults, sometimes reactivating fracture zone/strike-slip faults, caused by extension along the upper oceanic lithosphere. We call these bending moment normal faults. There was a M 7.1 earthquake on 2013.10.25 that appears to be along one of these faults. I include their figure caption below as a blockquote.

  • Schematic cross-sections of the A) Sanriku-oki, B) Kuril and C) Miyagi-oki subduction zones where great interplate thrust events have been followed by great trench slope or outer rise extensional events (in the first two cases) and concern about that happening in the case of the 2011 event.

  • Here is an animation that shows the seismicity for this region from 1960 – 2016 for earthquakes with magnitudes greater than or equal to 7.0.
  • I include some figures mentioned in my report from 2016.04.28 for a sequence of earthquakes in the same region as today’s earthquake (albeit shallower hypocentral depths), in addition to a plot from Cleveland et al. (2014). In the upper right corner, Cleveland et al. (2014) on the left plot a map showing earthquake epicenters for the time period listed below the plot on the right. On the right is a plot of earthquakes (diameter = magnitude) of earthquakes with latitude on the vertical axis and time on the horizontal axis. Cleveland et al (2014) discuss these short periods of seismicity that span a certain range of fault length along the New Hebrides Trench in this area. Above is a screen shot image and below is the video.

  • Here is a link to the embedded video below (6 MB mp4)

    References:

  • Benz, H.M., Herman, M., Tarr, A.C., Hayes, G.P., Furlong, K.P., Villaseñor, A., Dart, R.L., and Rhea, S., 2011. Seismicity of the Earth 1900–2010 New Guinea and vicinity: U.S. Geological Survey Open-File Report 2010–1083-H, scale 1:8,000,000.
  • Bird, P., 2003. An updated digital model of plate boundaries in Geochemistry, Geophysics, Geosystems, v. 4, doi:10.1029/2001GC000252, 52 p.
  • Craig, T.J., Copley, A., and Jackson, J., 2014. A reassessment of outer-rise seismicity and its implications for the mechanics of oceanic lithosphere in Geophysical Journal International, v. 197, p/ 63-89.
  • Geist, E.L., and Parsons, T., 2005, Triggering of tsunamigenic aftershocks from large strike-slip earthquakes: Analysis of the November 2000 New Ireland earthquake sequence: Geochemistry, Geophysics, Geosystems, v. 6, doi:10.1029/2005GC000935, 18 p. [Download PDF (6.5 MB)]
  • Hayes, G. P., D. J. Wald, and R. L. Johnson (2012), Slab1.0: A three-dimensional model of global subduction zone geometries, J. Geophys. Res., 117, B01302, doi:10.1029/2011JB008524.
  • Lay, T., and Kanamori, H., 1980, Earthquake doublets in the Solomon Islands: Physics of the Earth and Planetary Interiors, v. 21, p. 283-304.
  • Lay, T., Ammon, C.J., Kanamori, H., Kim, M.J., and Xue, L., 2011. Outer trench-slope faulting and the 2011 Mw 9.0 off the Pacific coast of Tohoku Earthquake in Earth Planets Space,
    v. 63, p. 713-718.
  • Richards, S., Holm, R., Barber, G., 2011. When slabs collide: A tectonic assessment of deep earthquakes in the Tonga-Vanuatu region in Geology, v. 39, no. 8., p. 787-790
  • Schwartz, S.Y., 1999, Noncharacteristic behavior and complex recurrence of large subduction zone earthquakes: Journal of Geophysical Research, v. 104, p. 23,111-123,125.
  • Schwartz, S.Y., Lay, T., and Ruff, L.J., 1989, Source process of the great 1971 Solomon Islands doublet: Physics of the Earth and Planetary Interiors, v. 56, p. 294-310.

Earthquake Report: Papua New Guinea!

Well. As I was preparing a job application at the library public wifi (the Airbnb I was staying at did not have wifi in my cabin, nor electricity for that matter), I prepared an interpretive poster for this earthquake. Interestingly, the library prevented any ftp connections, so I had to wait until today to upload my files.
Note: not sure why, but when I prepared this report, I initially entitled it as being along the Tonga subduction zone. This was not correct and I fixed it. There was a recent earthquake along the Tonga subduction zone and I had that on my mind.
This M 6.5 earthquake (here is the USGS website for this earthquake) happened in a region of Papua New Guinea (PNG) that has a long record of different types of tectonic deformation (including subduction, strike-slip, and several fold and thrust belts). To the northwest, in 1998, there was an earthquake that triggered a submarine landslide, which generated a large, devastating, and deadly tsunami. Here is the USGS website for this 1998 M 7.0 earthquake.
There are historic earthquakes to the west of this M 6.5 that are associated with the fold and thrust belt, but this M 6.5 earthquake is too deep to be associated with a possibly eastern extension of this fold and thrust belt. womp womp.
However, there have been a few earthquakes that are more closely (spatially) related to the 2017.11.07 M 6.5 earthquake. On 1986.06.24 there was an M 7.2 earthquake (here is the USGS website for this earthquake) to the southeast. These two earthquakes both have similar fault plane solutions (a moment tensor for the 2017 earthquake and a focal mechanism for the 1986 earthquake) and nearly identical depths. These deep earthquakes are deeper than we would expect for a subduction zone fault, so are possibly related to internal deformation within the downgoing slab. The subduction zone associated with the New Guinea (NG) trench (associated with the 1998 landslide tsunami earthquake) may or may not extend into this region (The Holm et al. (2016) figure below shows it does now). There is a fossil subduction zone (the Melanesian or Manus Trench) to the east of the NG trench, but this is also probably unrelated.
The best candidate is the downgoing slab associated with the New Britain Trench. This subduction zone is formed by the northward motion of the Solomon Sea plate beneath the South Bismarck plate (in the region of New Britain), but to the west, this fault splays into three mapped thrust faults that trend on land in eastern PNG. This is the slab imaged beneath where the epicenters are plotted for both 1986 and 2017 earthquakes. The Holm et al. (2016) figure has an inactive splay that more optimally (geometrically) is suited to fit these two earthquakes. There is a figure in the poster (and plotted below) that shows the geometry of this downgoing slab.

Below is my interpretive poster for this earthquake.

I plot the seismicity from the past month, with color representing depth and diameter representing magnitude (see legend). I include earthquake epicenters from 1917-2017 with magnitudes M ≥ 6.5.

  • I placed a moment tensor / focal mechanism legend on the poster. There is more material from the USGS web sites about moment tensors and focal mechanisms (the beach ball symbols). Both moment tensors and focal mechanisms are solutions to seismologic data that reveal two possible interpretations for fault orientation and sense of motion. One must use other information, like the regional tectonics, to interpret which of the two possibilities is more likely.
  • I also include the shaking intensity contours on the map. These use the Modified Mercalli Intensity Scale (MMI; see the legend on the map). This is based upon a computer model estimate of ground motions, different from the “Did You Feel It?” estimate of ground motions that is actually based on real observations. The MMI is a qualitative measure of shaking intensity. More on the MMI scale can be found here and here. This is based upon a computer model estimate of ground motions, different from the “Did You Feel It?” estimate of ground motions that is actually based on real observations.
  • I include the slab contours plotted (Hayes et al., 2012), which are contours that represent the depth to the subduction zone fault. These are mostly based upon seismicity. The depths of the earthquakes have considerable error and do not all occur along the subduction zone faults, so these slab contours are simply the best estimate for the location of the fault.
  • I include some inset figures.

  • In the upper left corner is a great figure showing the generalized plate tectonic boundaries in this region of the equatorial Pacific Ocean (Holm et al., 2016). I place a blue star in the general location of the M 6.5 earthquake (also plotted in other inset figures).
  • In the lower left corner is another plate tectonic map (Sapiie and Cloos, 2004) showing a slightly different interpretation of the faults in this region.
  • In the upper right corner are two figures from Holm and Richards (2013). Their paper discusses the back-arc spreading in the Bismarck Sea. They use hypocenter data to construct this 3-D model of the slab. On the right is a forecast of how the slab will be consumed along these subduction zones in the future.
  • In the lower right corner is another figure from Holm and Rihards (2013) where they present a low angle oblique view of the slab that they modeled in their paper.
  • To the left of the Holm and Richards figure is a map only has plate motions plotted (from Paul Tregoning at The Australian National University). The map plots, “linear velocities of GPS sites in PNG, showing absolute motions of the numerous tectonic plates.” Go to his website where he presents some related papers.


  • In 2015 there were a few small earthquakes to the northeast of the 1986 and 2017 deep earthquakes, but they were much shallower. However, they show a similarly oriented fault place solution. Though, these 2015 earthquakes are probably associated with the current strain being accumulated and released associated with plate tectonic boundaries (while the 1986 and 2017 deep earthquakes are not; their shared orientation is probably just coincidental?).
  • Here is the report from 2015. Below is the interpretive poster for those earthquakes (note how my posters are seeing a realized improvement over time).

  • Here is the Holm et al. (2016) figure.

  • Topography, bathymetry and regional tectonic setting of New Guinea and Solomon Islands. Arrows indicate rate and direction of plate motion of the Australian and Pacific plates (MORVEL, DeMets et al., 2010); Mamberamo thrust belt, Indonesia (MTB); North Fiji Basin (NFB)

  • Here is the tectonic map figure from Sappie and Cloos (2004). Their work was focused on western PNG, so their interpretations are more detailed there (and perhaps less relevant for us for these eastern PNG earthquakes).

  • Seismotectonic interpretation of New Guinea. Tectonic features: PTFB—Papuan thrust-and-fold belt; RMFZ—Ramu-Markham fault zone; BTFZ—Bewani-Torricelli fault zone; MTFB—Mamberamo thrust-and-fold belt; SFZ—Sorong fault zone; YFZ—Yapen fault zone; RFZ—Ransiki fault zone; TAFZ—Tarera-Aiduna fault zone; WT—Waipona Trough. After Sapiie et al. (1999).

  • This is the two panel figure from Holm and Richards (2013) that shows how the New Britain trench megathrust splays into three thrust faults as this fault system heads onto PNG. They plot active thrust faults as black triangles (with the triangles on the hanging wall side of the fault) and inactive thrust faults as open triangles. So, either the NG trench subduction zone extends further east than is presented in earlier work or the Bundi Fault Zone is the fault associated with this deep seismicity.

  • Topography, bathymetry and major tectonic elements of the study area. (a) Major tectonic boundaries of Papua New Guinea and the western Solomon Islands; CP, Caroline plate; MB, Manus Basin; NBP, North Bismarck plate; NBT, New Britain trench; NGT, New Guinea trench; NST, North Solomon trench; PFTB, Papuan Fold and Thrust Belt; PT, Pocklington trough; RMF, Ramu-Markham Fault; SBP, South Bismarck plate; SCT, San Cristobal trench; SS, Solomon Sea plate; TT, Trobriand trough; WB,Woodlark Basin; WMT,West Melanesian trench. Study area is indicated by rectangle labelled Figure 1b; the other inset rectangle highlights location for subsequent figures. Present day GPS motions of plates are indicated relative to the Australian plate (from Tregoning et al. 1998, 1999; Tregoning 2002; Wallace et al. 2004). (b) Detailed topography, bathymetry and structural elements significant to the South Bismarck region (terms not in common use are referenced); AFB, Aure Fold Belt (Davies 2012); AT, Adelbert Terrane (e.g. Wallace et al. 2004); BFZ, Bundi Fault Zone (Abbott 1995); BSSL, Bismarck Sea Seismic Lineation; CG, Cape Gloucester; FT, Finisterre Terrane; GF, Gogol Fault (Abbott 1995); GP, Gazelle Peninsula; HP, Huon Peninsula; MB, Manus Basin; NB, New Britain; NI, New Ireland; OSF, Owen Stanley Fault; RMF, Ramu-Markham Fault; SS, Solomon Sea; WMR, Willaumez-Manus Rise (Johnson et al. 1979); WT, Wonga Thrust (Abbott et al. 1994); minor strike-slip faults are shown adjacent to Huon Peninsula (Abers & McCaffrey 1994) and in east New Britain, the Gazelle Peninsula (e.g. Madsen & Lindley 1994). Circles indicate centres of Quaternary volcanism of the Bismarck arc. Filled triangles indicate active thrusting or subduction, empty triangles indicate extinct or negligible thrusting or subduction.

  • Here is the slab interpretation for the New Britain region from Holm and Richards, 2013. I include the figure caption below as a blockquote.

  • 3-D model of the Solomon slab comprising the subducted Solomon Sea plate, and associated crust of the Woodlark Basin and Australian plate subducted at the New Britain and San Cristobal trenches. Depth is in kilometres; the top surface of the slab is contoured at 20 km intervals from the Earth’s surface (black) to termination of slabrelated seismicity at approximately 550 km depth (light brown). Red line indicates the locations of the Ramu-Markham Fault (RMF)–New Britain trench (NBT)–San Cristobal trench (SCT); other major structures are removed for clarity; NB, New Britain; NI, New Ireland; SI, Solomon Islands; SS, Solomon Sea; TLTF, Tabar–Lihir–Tanga–Feni arc. See text for details.

  • Here are the forward models for the slab in the New Britain region from Holm and Richards, 2013. I include the figure caption below as a blockquote.

  • Forward tectonic reconstruction of progressive arc collision and accretion of New Britain to the Papua New Guinea margin. (a) Schematic forward reconstruction of New Britain relative to Papua New Guinea assuming continued northward motion of the Australian plate and clockwise rotation of the South Bismarck plate. (b) Cross-sections illustrate a conceptual interpretation of collision between New Britain and Papua New Guinea.

  • Earlier, in other earthquake reports, I have discussed seismicity from 2000-2015 here. The seismicity on the west of this region appears aligned with north-south shortening along the New Britain trench, while seismicity on the east of this region appears aligned with more east-west shortening. Here is a map that I put together where I show these two tectonic domains with the seismicity from this time period (today’s earthquakes are not plotted on this map, but one may see where they might plot).

  • This map shows plate velocities and euler poles for different blocks. I include the figure caption below as a blockquote.

  • Tectonic maps of the New Guinea region. (a) Seismicity, volcanoes, and plate motion vectors. Plate motion vectors relative to the Australian plate are surface velocity models based on GPS data, fault slip rates, and earthquake focal mechanisms (UNAVCO, http://jules.unavco.org/Voyager/Earth). Earthquake data are sourced from the International Seismological Center EHB Bulletin (http://www.isc.ac.uk); data represent events from January 1994 through January 2009 with constrained focal depths. Background image is generated from http://www.geomapapp.org. Abbreviations: AB, Arafura Basin; AT, Aure Trough; AyT, Ayu Trough; BA, Banda arc; BSSL, Bismarck Sea seismic lineation; BH, Bird’s Head; BT, Banda Trench; BTFZ, Bewani-Torricelli fault zone; DD, Dayman Dome; DEI, D’Entrecasteaux Islands; FP, Fly Platform; GOP, Gulf of Papua; HP, Huon peninsula; LA, Louisiade Archipelago; LFZ, Lowlands fault zone; MaT, Manus Trench; ML, Mt. Lamington; MT, Mt. Trafalgar; MuT, Mussau Trough; MV, Mt. Victory; MTB, Mamberamo thrust belt; MVF, Managalase Plateau volcanic field; NBT, New Britain Trench; NBA, New Britain arc; NF, Nubara fault; NGT, New Guinea Trench; OJP, Ontong Java Plateau; OSF, Owen Stanley fault zone; PFTB, Papuan fold-and-thrust belt; PP, Papuan peninsula; PRi, Pocklington Rise; PT, Pocklington Trough; RMF, Ramu-Markham fault; SST, South Solomons Trench; SA, Solomon arc; SFZ, Sorong fault zone; ST, Seram Trench; TFZ, Tarera-Aiduna fault zone; TJ, AUS-WDKPAC triple junction; TL, Tasman line; TT, Trobriand Trough;WD, Weber Deep;WB, Woodlark Basin;WFTB, Western (Irian) fold-and-thrust belt; WR,Woodlark Rift; WRi, Woodlark Rise; WTB, Weyland thrust; YFZ, Yapen fault zone.White box indicates the location shown in Figure 3. (b) Map of plates, microplates, and tectonic blocks and elements of the New Guinea region. Tectonic elements modified after Hill & Hall (2003). Abbreviations: ADB, Adelbert block; AOB, April ultramafics; AUS, Australian plate; BHB, Bird’s Head block; CM, Cyclops Mountains; CWB, Cendrawasih block; CAR, Caroline microplate; EMD, Ertsberg Mining District; FA, Finisterre arc; IOB, Irian ophiolite belt; KBB, Kubor & Bena blocks (including Bena Bena terrane); LFTB, Lengguru fold-and-thrust belt; MA, Mapenduma anticline; MB, Mamberamo Basin block; MO, Marum ophiolite belt; MHS, Manus hotspot; NBS, North Bismarck plate; NGH, New Guinea highlands block; NNG, Northern New Guinea block; OKT, Ok Tedi mining district; PAC, Pacific plate; PIC, Porgera intrusive complex; PSP, Philippine Sea plate; PUB, Papuan Ultramafic Belt ophiolite; SB, Sepik Basin block; SDB, Sunda block; SBS, South Bismarck plate; SIB, Solomon Islands block; WP, Wandamen peninsula; WDK, Woodlark microplate; YQ, Yeleme quarries.

  • This figure incorporates cross sections and map views of various parts of the regional tectonics (Baldwin et al., 2012). These deep earthquakes are nearest the cross section D (though are much deeper than these shallow cross sections). I include the figure caption below as a blockquote.

  • Oblique block diagram of New Guinea from the northeast with schematic cross sections showing the present-day plate tectonic setting. Digital elevation model was generated from http://www.geomapapp.org. Oceanic crust in tectonic cross sections is shown by thick black-and-white hatched lines, with arrows indicating active subduction; thick gray-and-white hatched lines indicate uncertain former subduction. Continental crust, transitional continental crust, and arc-related crust are shown without pattern. Representative geologic cross sections across parts of slices C and D are marked with transparent red ovals and within slices B and E are shown by dotted lines. (i ) Cross section of the Papuan peninsula and D’Entrecasteaux Islands modified from Little et al. (2011), showing the obducted ophiolite belt due to collision of the Australian (AUS) plate with an arc in the Paleogene, with later Pliocene extension and exhumation to form the D’Entrecasteaux Islands. (ii ) Cross section of the Papuan peninsula after Davies & Jaques (1984) shows the Papuan ophiolite thrust over metamorphic rocks of AUS margin affinity. (iii ) Across the Papuan mainland, the cross section after Crowhurst et al. (1996) shows the obducted Marum ophiolite and complex folding and thrusting due to collision of the Melanesian arc (the Adelbert, Finisterre, and Huon blocks) in the Late Miocene to recent. (iv) Across the Bird’s Head, the cross section after Bailly et al. (2009) illustrates deformation in the Lengguru fold-and-thrust belt as a result of Late Miocene–Early Pliocene northeast-southwest shortening, followed by Late Pliocene–Quaternary extension. Abbreviations as in Figure 2, in addition to NI, New Ireland; SI, Solomon Islands; SS, Solomon Sea; (U)HP, (ultra)high-pressure.

References:

Earthquake Report: Tonga!

Well, I was just getting ready for bed and saw the PTWC email notification. It took a couple minutes before the USGS email notification came through, but the earthquake was already listed on the website. By the time the ENS email came in, the magnitude was adjusted, as well as the location.
This M 6.8 earthquake was originally reported as a deep earthquake at 80 km, but after real people took a look at the data, the depth was also adjusted.
It is interesting that this earthquake happened just a few days after the sequence to the west, though these earthquakes are probably too far away to be related. Here is my report from a couple days ago. I include the interpretive poster from that earthquake below today’s interpretive poster. I use some of the same figures for both of these posters since they are each in a similar region of the world. Then, moments later, there was an M 5.5 in the Loyalty Islands region. Hmmmmm.
Today’s M 6.8 earthquake did occur near the earthquake from 2009 (almost immediately down-dip of the 2009 earthquake), an M 8.1 earthquake in the downgoing slab, that caused a large and damaging tsunami in the Samoa Islands.

  • Here are the USGS websites for the M 6.8 earthquake.
  • 2017.11.04 M 6.8 Tonga
  • Here are the USGS earthquake pages for the earthquakes for which I plot fault plane solutions in the inset figure below.
  • 1981-09-01 M 7.7
  • 1985-06-03 M 6.7
  • 1990-01-04 M 6.5
  • 1993-05-16 M 6.6
  • 1995-04-07 M 7.4
  • 1996-08-05 M 6.7
  • 2009-08-30 M 6.6
  • 2009-09-29 M 8.1
  • 2015-03-30 M 6.5

Below is my interpretive poster for this earthquake.

I plot the seismicity from the past month, with color representing depth and diameter representing magnitude (see legend). I include earthquake epicenters from 1917-2017 with magnitudes M ≥ 6.5.

  • I placed a moment tensor / focal mechanism legend on the poster. There is more material from the USGS web sites about moment tensors and focal mechanisms (the beach ball symbols). Both moment tensors and focal mechanisms are solutions to seismologic data that reveal two possible interpretations for fault orientation and sense of motion. One must use other information, like the regional tectonics, to interpret which of the two possibilities is more likely.
  • I also include the shaking intensity contours on the map. These use the Modified Mercalli Intensity Scale (MMI; see the legend on the map). This is based upon a computer model estimate of ground motions, different from the “Did You Feel It?” estimate of ground motions that is actually based on real observations. The MMI is a qualitative measure of shaking intensity. More on the MMI scale can be found here and here. This is based upon a computer model estimate of ground motions, different from the “Did You Feel It?” estimate of ground motions that is actually based on real observations.
  • I include the slab contours plotted (Hayes et al., 2012), which are contours that represent the depth to the subduction zone fault. These are mostly based upon seismicity. The depths of the earthquakes have considerable error and do not all occur along the subduction zone faults, so these slab contours are simply the best estimate for the location of the fault.
  • I include some inset figures.

  • In the upper right corner is a map from Benz et al. (2011) that shows seismicity with color representing depth and circle diameter representing magnitude. This report is available online for more information. I include the general location of this M 6.8 earthquake as a blue star. Cross section H-H’ is plotted on the left of the map. I include the location of this x-sec on the main map as a blue line.
  • In the lower left corner are several more cross sections as determined from seismic tomography (de Paor et al., 2012). Seismic tomography is basically an X-ray of Earth’s interior that uses seismic waves rather than X-rays. More on seismic tomography can be found here or here. The cross section A-A’ is shown on the main map as a green line.
  • In the upper left corner is a low-angle oblique view of the megathrust fault (the slab). This is from Green (2003).
  • In the lower left corner I plot the USGS moment tensors (blue) and focal mechanisms (orange) for earthquakes in this region. These earthquakes fit two distinct domains (outlined in dashed white).
    The easternmost quakes are in the downgoing Pacific plate and are the result of extension (either slab tension or due to bending in the upper part of the plate). The westernmost quakes are either near the megathrust (subduction zone) or in the upper plate (most appear to be in the upper plate). Something that all earthquakes share is that their principal strain direction (the orientation of maximum or minimum stress) rotates with the orientation of the subduction zone fault. This may represent strain partitioning at this plate boundary. Basically, thrust earthquakes tend to be oriented perpendicular to the megathrust fault strike, and there are other strike-slip earthquakes that accommodate the non-perpendicular plate motion. There are no examples of these strike-slip earthquakes here. The subduction zone here is quite complicated as there is backarc spreading and a complex interaction between mantle flow at the edge of the subduction zone and a hotspot plume.


  • Here is the oblique view of the slab from Green (2003).

  • Earthquakes and subducted slabs beneath the Tonga–Fiji area. The subducting slab and
    detached slab are defined by the historic earthquakes in this region: the steeply dipping surface descending from the Tonga Trench marks the currently active subduction zone, and the surface lying mostly between 500 and 680 km, but rising to 300 km in the east, is a relict from an old subduction zone that descended from the fossil Vitiaz Trench. The locations of the mainshocks of the two Tongan earthquake sequences discussed by Tibi et al. are marked in yellow (2002 sequence) and orange (1986 series). Triggering mainshocks are denoted by stars; triggered mainshocks by circles. The 2002 sequence lies wholly in the currently subducting slab (and slightly extends the earthquake distribution in it),whereas the 1986 mainshock is in that slab but the triggered series is located in the detached slab,which apparently contains significant amounts of metastable olivine

  • Here is a great figure showing an interpretation of how the mantle flow and hotspot plume may interact here (Chang et al., 2015).

  • Illustrated time history of the plume–slab interaction and a cartoon for summarizing current features. (a) The Samoan plume is generated at the Mega ULVZ19 at the core–mantle boundary and is ascending to the surface. (b) The Samoan plume collided with the Tonga slab at the transition zone at about 10 Myr. (c) The upward stress by the collision has caused the stagnant slab and intense seismicity (cross marks), which is further enhanced by fast slab retreat (red arrow) due to the subduction of the Hikurangi plateau. (d) A schematic diagram illustrating the slab–plume interaction beneath the Tonga–Kermadec arc. Cyan lines on the surface show trenches, as shown in Fig. 1. HP, Hikurangi Plateau; KT, Kermadec Trench; NHT, New Hebrides Trench; TT, Tonga Trench; VT, Vitiaz Trench. The Samoan plume originates from a Mega ULVZ at the core–mantle boundary (CMB). The buoyancy caused by large
    stress from the plume at the bottom of the Tonga slab may contribute to the slab stagnation within the mantle transition zone, while the Kermadec slab is penetrating into the lower mantle directly. At the northern end of the Tonga slab, plume materials migrate into the mantle wedge, facilitated by strong toroidal flow around the slab edge induced by fast slab retreat.

  • Here are figures from Richards et al. (2011) with their figure captions below in blockquote.
  • The main tectonic map

  • bathymetry, and major tectonic element map of the study area. The Tonga and Vanuatu subduction systems are shown together with the locations of earthquake epicenters discussed herein. Earthquakes between 0 and 70 km depth have been removed for clarity. Remaining earthquakes are color-coded according to depth. Earthquakes located at 500–650 km depth beneath the North Fiji Basin are also shown. Plate motions for Vanuatu are from the U.S. Geological Survey, and for Tonga from Beavan et al. (2002) (see text for details). Dashed line indicates location of cross section shown in Figure 3. NFB—North Fiji Basin; HFZ—Hunter Fracture Zone.

  • Here is the map showing the current configuration of the slabs in the region.

  • Map showing distribution of slab segments beneath the Tonga-Vanuatu region. West-dipping Pacifi c slab is shown in gray; northeast-dipping Australian slab is shown in red. Three detached segments of Australian slab lie below the North Fiji Basin (NFB). HFZ—Hunter Fracture Zone. Contour interval is 100 km. Detached segments of Australian plate form sub-horizontal sheets located at ~600 km depth. White dashed line shows outline of the subducted slab fragments when reconstructed from 660 km depth to the surface. When all subducted components are brought to the surface, the geometry closely approximates that of the North Fiji Basin.

  • This is the cross section showing the megathrust fault configuration based on seismic tomography and seismicity.

  • Previous interpretation of combined P-wave tomography and seismicity from van der Hilst (1995). Earthquake hypocenters are shown in blue. The previous interpretation of slab structure is contained within the black dashed lines. Solid red lines mark the surface of the Pacifi c slab (1), the still attached subducting Australian slab (2a), and the detached segment of the Australian plate (2b). UM—upper mantle;
    TZ—transition zone; LM—lower mantle.

  • Here is their time step interpretation of the slabs that resulted in the second figure above.

  • Simplified plate tectonic reconstruction showing the progressive geometric evolution of the Vanuatu and Tonga subduction systems in plan view and in cross section. Initiation of the Vanuatu subduction system begins by 10 Ma. Initial detachment of the basal part of the Australian slab begins at ca. 5–4 Ma and then sinking and collision between the detached segment and the Pacifi c slab occur by 3–4 Ma. Initial opening of the Lau backarc also occurred at this time. Between 3 Ma and the present, both slabs have been sinking progressively to their current position. VT—Vitiaz trench; dER—d’Entrecasteaux Ridge.

#Earthquake Report: Loyalty Islands

BOO! Happy Halloween/Samhain….
I am on the road and worked on this report while on layovers with intermittent internets access… Though this earthquake sequence spanned a day or so, so it is good that it took me a while to compile my figures.

Below is my interpretive poster for this earthquake.

I plot the seismicity from the past month, with color representing depth and diameter representing magnitude (see legend). I include earthquake epicenters from 1917-2017 with magnitudes M > 7.5. I also plot the moment tensors for some earthquakes to the southeast of the current sequence. Also, there was a sequence in December of 2016. Here is my report for that series of earthquakes. There are other earthquakes in this region listed at the bottom of this page above the references. Note the special symbology that I used for the 1920 earthquake epicenter.

  • I placed a moment tensor / focal mechanism legend on the poster. There is more material from the USGS web sites about moment tensors and focal mechanisms (the beach ball symbols). Both moment tensors and focal mechanisms are solutions to seismologic data that reveal two possible interpretations for fault orientation and sense of motion. One must use other information, like the regional tectonics, to interpret which of the two possibilities is more likely. The moment tensor shows northeast-southwest compression, perpendicular to the convergence at this plate boundary. Most of the recent seismicity in this region is associated with convergence along the New Britain trench or the South Solomon trench.
  • I also include the shaking intensity contours on the map. These use the Modified Mercalli Intensity Scale (MMI; see the legend on the map). This is based upon a computer model estimate of ground motions, different from the “Did You Feel It?” estimate of ground motions that is actually based on real observations. The MMI is a qualitative measure of shaking intensity. More on the MMI scale can be found here and here. This is based upon a computer model estimate of ground motions, different from the “Did You Feel It?” estimate of ground motions that is actually based on real observations.
  • I include the slab contours plotted (Hayes et al., 2012), which are contours that represent the depth to the subduction zone fault. These are mostly based upon seismicity. The depths of the earthquakes have considerable error and do not all occur along the subduction zone faults, so these slab contours are simply the best estimate for the location of the fault. The hypocentral depth plots this close to the location of the fault as mapped by Hayes et al. (2012). The M 6.8 is plotted really close to the megathrust and is also very shallow. The depth is probably not very well constrained due to the geometry and lack of seismometer coverage in the oceanic setting.
  • Here is the USGS page for the main earthquake in this sequence.
  • 2017.10.31 M 6.8
  • I include some inset figures.

  • In the upper left corner I include a figure from Richards et al. (2011) that shows the major plate boundary faults in the region. They also plot seismicity with color representing depth. This allows us to visualize the subduction zone fault as it dips (eastward for the New Hebrides and westwards for the Tonga subduction zones). The cross section in the panel on the right is designated by the black dashed line. I also place this line as a dashed green line in the interpretive poster below. I place a yellow star in the general location of the M 6.8 earthquake.
  • In the upper right corner I include the Richards et al. (2011) cross section showing earthquake hypocenters as colored circles and the megathrust subduction zone faults as red lines.
  • To the left of the cross section is a panel that shows how Richards et al. (2011) hypothesize about how the New Hebrides subducting slab (Australia plate) and the Fiji Basin (the upper plate) interacted to create the configuration of the plates and faults in this region. Note how shallow the New Hebrides fault is.
  • In the lower left corner I plot the USGS moment tensors for the main earthquakes from this sequence. Note how the mainshock is a thrust (compressional) earthquake, while the earthquakes in the downgoing Australia plate, to the west of the subduction zone, are mostly normal (extensional) earthquakes. There are many examples of this globally (Samoa, Marianas, Kuril, etc.). I will follow up by linking other reports of mine that discuss these at a later time. I am working on very little sleep from my travels.


  • Here is my interpretive poster for the 2016.12.08 earthquake.

  • Here is an animation that shows the seismicity for this region from 1960 – 2016 for earthquakes with magnitudes greater than or equal to 7.0.
  • I include some figures mentioned in my report from 2016.04.28 for a sequence of earthquakes in the same region as today’s earthquake (albeit shallower hypocentral depths), in addition to a plot from Cleveland et al. (2014). In the upper right corner, Cleveland et al. (2014) on the left plot a map showing earthquake epicenters for the time period listed below the plot on the right. On the right is a plot of earthquakes (diameter = magnitude) of earthquakes with latitude on the vertical axis and time on the horizontal axis. Cleveland et al (2014) discuss these short periods of seismicity that span a certain range of fault length along the New Hebrides Trench in this area. Above is a screen shot image and below is the video.

  • Here is a link to the embedded video below (6 MB mp4)
  • Here is a map from the USGS report (Benz et al., 2011). Read more about this map on the USGS website. Earthquakes are plotted with color related to depth and circle diameter related to magnitude. Today’s M 6.8 earthquake occurred south of cross section G-G’.

  • This is the legend.

  • Here is a cross section showing the seismicity along swatch profile G-G’.

  • Here are the figures from Richards et al. (2011) with their figure captions below in blockquote.
  • The main tectonic map

  • bathymetry, and major tectonic element map of the study area. The Tonga and Vanuatu subduction systems are shown together with the locations of earthquake epicenters discussed herein. Earthquakes between 0 and 70 km depth have been removed for clarity. Remaining earthquakes are color-coded according to depth. Earthquakes located at 500–650 km depth beneath the North Fiji Basin are also shown. Plate motions for Vanuatu are from the U.S. Geological Survey, and for Tonga from Beavan et al. (2002) (see text for details). Dashed line indicates location of cross section shown in Figure 3. NFB—North Fiji Basin; HFZ—Hunter Fracture Zone.

  • Here is the map showing the current configuration of the slabs in the region.

  • Map showing distribution of slab segments beneath the Tonga-Vanuatu region. West-dipping Pacifi c slab is shown in gray; northeast-dipping Australian slab is shown in red. Three detached segments of Australian slab lie below the North Fiji Basin (NFB). HFZ—Hunter Fracture Zone. Contour interval is 100 km. Detached segments of Australian plate form sub-horizontal sheets located at ~600 km depth. White dashed line shows outline of the subducted slab fragments when reconstructed from 660 km depth to the surface. When all subducted components are brought to the surface, the geometry closely approximates that of the North Fiji Basin.

  • This is the cross section showing the megathrust fault configuration based on seismic tomography and seismicity.

  • Previous interpretation of combined P-wave tomography and seismicity from van der Hilst (1995). Earthquake hypocenters are shown in blue. The previous interpretation of slab structure is contained within the black dashed lines. Solid red lines mark the surface of the Pacifi c slab (1), the still attached subducting Australian slab (2a), and the detached segment of the Australian plate (2b). UM—upper mantle;
    TZ—transition zone; LM—lower mantle.

  • Here is their time step interpretation of the slabs that resulted in the second figure above.

  • Simplifi ed plate tectonic reconstruction showing the progressive geometric evolution of the Vanuatu and Tonga subduction systems in plan view and in cross section. Initiation of the Vanuatu subduction system begins by 10 Ma. Initial detachment of the basal part of the Australian slab begins at ca. 5–4 Ma and then sinking and collision between the detached segment and the Pacifi c slab occur by 3–4 Ma. Initial opening of the Lau backarc also occurred at this time. Between 3 Ma and the present, both slabs have been sinking progressively to their current position. VT—Vitiaz trench; dER—d’Entrecasteaux Ridge.

  • Here is a screenshot of my seat’s screen showing where my plane flight was today (last night). I actually flew right overhead of these earthquakes! Interestingly, I was on a ship collecting piston cores for a seismoturbidite study offshore the North Island last year when the M 7.8 Kaikoura earthquake ruptured. I did not feel the earthquakes in either case (these Halloween earthquakes nor the Kaikoura earthquakes.


    References:

  • Benz, H.M., Herman, M., Tarr, A.C., Hayes, G.P., Furlong, K.P., Villaseñor, A., Dart, R.L., and Rhea, S., 2011. Seismicity of the Earth 1900–2010 New Guinea and vicinity: U.S. Geological Survey Open-File Report 2010–1083-H, scale 1:8,000,000.
  • Bird, P., 2003. An updated digital model of plate boundaries in Geochemistry, Geophysics, Geosystems, v. 4, doi:10.1029/2001GC000252, 52 p.
  • Geist, E.L., and Parsons, T., 2005, Triggering of tsunamigenic aftershocks from large strike-slip earthquakes: Analysis of the November 2000 New Ireland earthquake sequence: Geochemistry, Geophysics, Geosystems, v. 6, doi:10.1029/2005GC000935, 18 p. [Download PDF (6.5 MB)]
  • Hayes, G. P., D. J. Wald, and R. L. Johnson (2012), Slab1.0: A three-dimensional model of global subduction zone geometries, J. Geophys. Res., 117, B01302, doi:10.1029/2011JB008524.
  • Lay, T., and Kanamori, H., 1980, Earthquake doublets in the Solomon Islands: Physics of the Earth and Planetary Interiors, v. 21, p. 283-304.
  • Richards, S., Holm, R., Barber, G., 2011. When slabs collide: A tectonic assessment of deep earthquakes in the Tonga-Vanuatu region in Geology, v. 39, no. 8., p. 787-790
  • Schwartz, S.Y., 1999, Noncharacteristic behavior and complex recurrence of large subduction zone earthquakes: Journal of Geophysical Research, v. 104, p. 23,111-123,125.
  • Schwartz, S.Y., Lay, T., and Ruff, L.J., 1989, Source process of the great 1971 Solomon Islands doublet: Physics of the Earth and Planetary Interiors, v. 56, p. 294-310.