Earthquake Report: Gorda Plate!

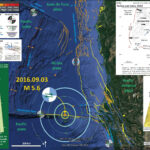
Last night, while I was preparing an online exam for my students to take while I am at the Geological Society of America Annual Meeting in Denver Colorado, there were a couple earthquakes in the Gorda plate offshore of northern California.

    Here are the USGS web pages for the earthquakes plotted in my interpretive poster below. The two from last night are in the Gorda plate and there is also a recent earthquake associated with the Mendocino fault. Here is my report for the M 5.6 Mendocino fault earthquake.

  • 2019.09.25 M 5.0 Gorda plate
  • 2019.09.25 M 4.6 Gorda plate
  • 2016.09.03 M 5.6 Mendocino fault

Below is my interpretive poster for this earthquake. I include faults from the USGS quaternary fault and fold database. The two earthquakes do not appear to be along the same fault plane, if my interpretation is correct. This leads me to think that perhaps these earthquakes are possibly on faults antithetic to the regional structural grain.
I placed a moment tensor / focal mechanism legend on the poster. There is more material from the USGS web sites about moment tensors and focal mechanisms (the beach ball symbols). Both moment tensors and focal mechanisms are solutions to seismologic data that reveal two possible interpretations for fault orientation and sense of motion. One must use other information, like the regional tectonics, to interpret which of the two possibilities is more likely. Given our knowledge of the tectonics of this region, I interpret this earthquake to be a left-lateral strike-slip earthquake in the Gorda plate. I include some figures below that show evidence that supports this interpretation.


Here is a map of the Cascadia subduction zone, modified from Nelson et al. (2006). The Juan de Fuca and Gorda plates subduct norteastwardly beneath the North America plate at rates ranging from 29- to 45-mm/yr. Sites where evidence of past earthquakes (paleoseismology) are denoted by white dots. Where there is also evidence for past CSZ tsunami, there are black dots. These paleoseismology sites are labeled (e.g. Humboldt Bay). Some submarine paleoseismology core sites are also shown as grey dots. The two main spreading ridges are not labeled, but the northern one is the Juan de Fuca ridge (where oceanic crust is formed for the Juan de Fuca plate) and the southern one is the Gorda rise (where the oceanic crust is formed for the Gorda plate).


Here is a version of the CSZ cross section alone (Plafker, 1972). This shows two parts of the earthquake cycle: the interseismic part (between earthquakes) and the coseismic part (during earthquakes). Regions that experience uplift during the interseismic period tend to experience subsidence during the coseismic period.


Here is a map from Chaytor et al. (2004) that shows some details of the faulting in the region. The moment tensor (at the moment i write this) shows a north-south striking fault with a reverse or thrust faulting mechanism. While this region of faulting is dominated by strike slip faults (and most all prior earthquake moment tensors showed strike slip earthquakes), when strike slip faults bend, they can create compression (transpression) and extension (transtension). This transpressive or transtentional deformation may produce thrust/reverse earthquakes or normal fault earthquakes, respectively. The transverse ranges north of Los Angeles are an example of uplift/transpression due to the bend in the San Andreas fault in that region.


These are the models for tectonic deformation within the Gorda plate as presented by Jason Chaytor in 2004.
Mw = 5 Trinidad Chaytor
Here is a map from Rollins and Stein, showing their interpretations of different historic earthquakes in the region. This was published in response to the Januray 2010 Gorda plate earthquake. The faults are from Chaytor et al. (2004).


In this map below, I label a number of other significant earthquakes in this Mendocino triple junction region. Another historic right-lateral earthquake on the Mendocino fault system was in 1994. There was a series of earthquakes possibly along the easternmost section of the Mendocino fault system in late January 2015, here is my post about that earthquake series.


The Gorda and Juan de Fuca plates subduct beneath the North America plate to form the Cascadia subduction zone fault system. In 1992 there was a swarm of earthquakes with the magnitude Mw 7.2 Mainshock on 4/25. Initially this earthquake was interpreted to have been on the Cascadia subduction zone (CSZ). The moment tensor shows a compressional mechanism. However the two largest aftershocks on 4/26/1992 (Mw 6.5 and Mw 6.7), had strike-slip moment tensors. These two aftershocks align on what may be the eastern extension of the Mendocino fault.
There have been several series of intra-plate earthquakes in the Gorda plate. Two main shocks that I plot of this type of earthquake are the 1980 (Mw 7.2) and 2005 (Mw 7.2) earthquakes. I place orange lines approximately where the faults are that ruptured in 1980 and 2005. These are also plotted in the Rollins and Stein (2010) figure above. The Gorda plate is being deformed due to compression between the Pacific plate to the south and the Juan de Fuca plate to the north. Due to this north-south compression, the plate is deforming internally so that normal faults that formed at the spreading center (the Gorda Rise) are reactivated as left-lateral strike-slip faults. In 2014, there was another swarm of left-lateral earthquakes in the Gorda plate. I posted some material about the Gorda plate setting on this page.
There are three types of earthquakes, strike-slip, compressional (reverse or thrust, depending upon the dip of the fault), and extensional (normal). Here is are some animations of these three types of earthquake faults. Many of the earthquakes people are familiar with in the Mendocino triple junction region are either compressional or strike slip. The following three animations are from IRIS.
Strike Slip:

Compressional:

Extensional:


    References:

  • Atwater, B.F., Musumi-Rokkaku, S., Satake, K., Tsuju, Y., Eueda, K., and Yamaguchi, D.K., 2005. The Orphan Tsunami of 1700—Japanese Clues to a Parent Earthquake in North America, USGS Professional Paper 1707, USGS, Reston, VA, 144 pp.
  • Burgette, R. et al., 2009. Interseismic uplift rates for western Oregon and along-strike variation in locking on the Cascadia subduction zone in Journal of Geophysical Research, v. 114, B01408, doi:10.1029/2008JB005679
  • Chaytor, J.D., Goldfinger, C., Dziak, R.P., and Fox, C.G., 2004. Active deformation of the Gorda plate: Constraining deformation models with new geophysical data: Geology v. 32, p. 353-356
  • Goldfinger, C., Nelson, C.H., Morey, A., Johnson, J.E., Gutierrez-Pastor, J., Eriksson, A.T., Karabanov, E., Patton, J., Gràcia, E., Enkin, R., Dallimore, A., Dunhill, G., and Vallier, T., 2012. Turbidite Event History: Methods and Implications for Holocene Paleoseismicity of the Cascadia Subduction Zone, USGS Professional Paper # 1661F. U.S. Geological Survey, Reston, VA, 184 pp.
  • McCrory, P. A., Blair, J. L., Oppenheimer, D. H., and Walter, S. R., 2006. Depth to the Juan de Fuca slab beneath the Cascadia subduction margin; a 3-D model for sorting earthquakes U. S. Geological Survey
  • Nelson, A.R., Kelsey, H.M., and Witter, R.C., 2006. Great earthquakes of variable magnitude at the Cascadia subduction zone: Quaternary Research, doi:10.1016/j.yqres.2006.02.009, p. 354-365.
  • Plafker, G., 1972. Alaskan earthquake of 1964 and Chilean earthquake of 1960: Implications for arc tectonics in Journal of Geophysical Research, v. 77, p. 901-925.
  • Rollins, J.C., Stein, R.S., 2010. Coulomb Stress Interactions Among M ≥ 5.9 Earthquakes in the Gorda Deformation Zone and on the Mendocino Fault Zone, Cascadia Subduction Zone, and Northern San Andreas Fault. Journal of Geophysical Research 115, 19 pp.
  • USGS Quaternary Fault Database: http://earthquake.usgs.gov/hazards/qfaults/
  • Wang, K., Wells, R., Mazzotti, S., Hyndman, R. D., and Sagiya, T., 2003. A revised dislocation model of interseismic deformation of the Cascadia subduction zone Journal of Geophysical Research, B, Solid Earth and Planets v. 108, no. 1.

Earthquake Report: Solomon Islands

There was an earthquake along the South Solomon Trench earlier today (before I woke up). Here is the USGS website for this M 6.0 earthquake.
Below is my interpretive poster for this earthquake. This map shows the slab contours (an estimate of the subduction zone plate interface). These contours are estimated by Hayes et al., (2012). The hypocentral depth is 10.0 km, which is shallower than the slab depth according to Hayes et al. (2012), which is about 220 km. However, the 10.0 km is probably not a correct depth as the USGS assigns default depths to earthquakes until they are analyzed further. If this depth is correct, then the earthquake could either be along the subduction megathrust fault, or a fault in the accretionary prism/upper plate.
I placed a moment tensor / focal mechanism legend on the poster. There is more material from the USGS web sites about moment tensors and focal mechanisms (the beach ball symbols). Both moment tensors and focal mechanisms are solutions to seismologic data that reveal two possible interpretations for fault orientation and sense of motion. One must use other information, like the regional tectonics, to interpret which of the two possibilities is more likely. The moment tensor shows northeast-southwest compression, perpendicular to the convergence at this plate boundary. Most of the recent seismicity in this region is associated with convergence along the New Britain trench or the South Solomon trench.

    I include some inset figures.

  • In the upper right corner is a comprehensive tectonic map of this region (Baldwin et al., 2012). The lower panel shows an inset with details for the region of the New Britain and South Solomon Trenches.
  • In the lower left corner is another generalized tectonic map of the region from Holm et al., 2015. This map shows the major plate boundary faults including the New Britain trench (NBT), one of the main culprits for recent seismicity of this region.
  • To the right of that is a figure from Oregon State University, which are based upon Hamilton (1979). “Tectonic microplates of the Melanesian region. Arrows show net plate motion relative to the Australian Plate.” This is from Johnson, 1976.


      In this region, there was a subduction zone earthquake that generated ground deformation and a tsunami on 2007.04.10. Below is some information about that earthquake and tsunami.

    • Here is a map from the USGS that shows the rupture area of the 2007 earthquake with a hashed polygon. The epicenter is shown as a red dot. The USGS preliminary analysis of the tsunami is here. I include their text as a blockquote below.

    • The M=8.1 earthquake that occurred in the Solomon Islands on April 1, 2007 (UTC), was located along the Solomon Islands subduction zone, part of the Pacific “Ring of Fire”. A subduction zone is a type of plate tectonic boundary where one plate is pulled (subducted) beneath another plate. For most subduction zones that make up the western half of the Ring of Fire, the Pacific plate is being subducted beneath local plates. In this case, however, the Pacific plate is the overriding or upper plate. There are three plates being subducted along the Solomon Islands subduction zone: the Solomon Sea plate, the Woodlark plate, and the Australian plate (see figure below). A spreading center separates the Woodlark and Australian plates. More detailed information on the plate tectonics of this region can be found in Tregoning and others (1998) and Bird (2003).

        Below are some animations of the USGS tsunami simulation for the 2007 earthquake. From the USGS:

        To create a preliminary simulation of the April 2007 tsunami, we start with the fault mechanism determined by the Global CMT Project. The length of the fault that ruptured can be determined from the distribution of aftershocks or from the seismic inversion. In this case, however, we used the results from ShakeMap soon after the event to obtain an estimate of rupture length. Shown below is the preliminary simulation of the tsunami as viewed from different directions. The source and propagation model is based on an earlier study (Geist and Parsons, 2005) that investigated tsunamis from the November 2000 New Ireland earthquake sequence (tsunami also observed at Gizo for the New Ireland event).

      • Tsunami wavefield at 2.4 minutes. Regional view across the Solomon Sea. Here is a link to the video file embedded below. (mp4)
      • Initial tsunami wavefield looking to the NW. Close-up view near the earthquake source. Here is a link to the video file embedded below. (mp4)
      • Initial tsunami wavefield looking to the SE. Close-up view near the earthquake source. Here is a link to the video file embedded below. (mp4)
  • This is a map showing the seismicity of this region since 2000 A.D.

  • Earlier, I discussed seismicity from 2000-2015 here. The seismicity on the west of this region appears aligned with north-south shortening along the New Britain trench, while seismicity on the east of this region appears aligned with more east-west shortening. Here is a map that I put together where I show these two tectonic domains with the seismicity from this time period (today’s earthquakes are not plotted on this map, but one may see where they might plot).

  • Here is the generalized tectonic map of the region from Holm et al., 2015. I include the figure caption below as a blockquote.

  • Tectonic setting and mineral deposits of eastern Papua New Guinea and Solomon Islands. The modern arc setting related to formation of the mineral deposits comprises, from west to east, the West Bismarck arc, the New Britain arc, the Tabar-Lihir-Tanga-Feni Chain and the Solomon arc, associated with north-dipping subduction/underthrusting at the Ramu-Markham fault zone, New Britain trench and San Cristobal trench respectively. Arrows denote plate motion direction of the Australian and Pacific plates. Filled triangles denote active subduction. Outlined triangles denote slow or extinct subduction. NBP: North Bismarck plate; SBP: South Bismarck plate; AT: Adelbert Terrane; FT: Finisterre Terrane; RMF: Ramu-Markham fault zone; NBT: New Britain trench.

  • This map shows plate velocities and euler poles for different blocks. Note the counterclockwise motion of the plate that underlies the Solomon Sea (Baldwin et al., 2012). I include the figure caption below as a blockquote.

  • Tectonic maps of the New Guinea region. (a) Seismicity, volcanoes, and plate motion vectors. Plate motion vectors relative to the Australian plate are surface velocity models based on GPS data, fault slip rates, and earthquake focal mechanisms (UNAVCO, http://jules.unavco.org/Voyager/Earth). Earthquake data are sourced from the International Seismological Center EHB Bulletin (http://www.isc.ac.uk); data represent events from January 1994 through January 2009 with constrained focal depths. Background image is generated from http://www.geomapapp.org. Abbreviations: AB, Arafura Basin; AT, Aure Trough; AyT, Ayu Trough; BA, Banda arc; BSSL, Bismarck Sea seismic lineation; BH, Bird’s Head; BT, Banda Trench; BTFZ, Bewani-Torricelli fault zone; DD, Dayman Dome; DEI, D’Entrecasteaux Islands; FP, Fly Platform; GOP, Gulf of Papua; HP, Huon peninsula; LA, Louisiade Archipelago; LFZ, Lowlands fault zone; MaT, Manus Trench; ML, Mt. Lamington; MT, Mt. Trafalgar; MuT, Mussau Trough; MV, Mt. Victory; MTB, Mamberamo thrust belt; MVF, Managalase Plateau volcanic field; NBT, New Britain Trench; NBA, New Britain arc; NF, Nubara fault; NGT, New Guinea Trench; OJP, Ontong Java Plateau; OSF, Owen Stanley fault zone; PFTB, Papuan fold-and-thrust belt; PP, Papuan peninsula; PRi, Pocklington Rise; PT, Pocklington Trough; RMF, Ramu-Markham fault; SST, South Solomons Trench; SA, Solomon arc; SFZ, Sorong fault zone; ST, Seram Trench; TFZ, Tarera-Aiduna fault zone; TJ, AUS-WDKPAC triple junction; TL, Tasman line; TT, Trobriand Trough;WD, Weber Deep;WB, Woodlark Basin;WFTB, Western (Irian) fold-and-thrust belt; WR,Woodlark Rift; WRi, Woodlark Rise; WTB, Weyland thrust; YFZ, Yapen fault zone.White box indicates the location shown in Figure 3. (b) Map of plates, microplates, and tectonic blocks and elements of the New Guinea region. Tectonic elements modified after Hill & Hall (2003). Abbreviations: ADB, Adelbert block; AOB, April ultramafics; AUS, Australian plate; BHB, Bird’s Head block; CM, Cyclops Mountains; CWB, Cendrawasih block; CAR, Caroline microplate; EMD, Ertsberg Mining District; FA, Finisterre arc; IOB, Irian ophiolite belt; KBB, Kubor & Bena blocks (including Bena Bena terrane); LFTB, Lengguru fold-and-thrust belt; MA, Mapenduma anticline; MB, Mamberamo Basin block; MO, Marum ophiolite belt; MHS, Manus hotspot; NBS, North Bismarck plate; NGH, New Guinea highlands block; NNG, Northern New Guinea block; OKT, Ok Tedi mining district; PAC, Pacific plate; PIC, Porgera intrusive complex; PSP, Philippine Sea plate; PUB, Papuan Ultramafic Belt ophiolite; SB, Sepik Basin block; SDB, Sunda block; SBS, South Bismarck plate; SIB, Solomon Islands block; WP, Wandamen peninsula; WDK, Woodlark microplate; YQ, Yeleme quarries.

    References:

  • Baldwin, S.L., Fitzgerald, P.G., and Webb, L.E., 2012, Tectonics of the New Guinea Region, Annu. Rev. Earth Planet. Sci., v. 40, pp. 495-520.
  • Bird, P., 2003. An updated digital model of plate boundaries in Geochemistry, Geophysics, Geosystems, v. 4, doi:10.1029/2001GC000252, 52 p.
  • Geist, E.L., and Parsons, T., 2005, Triggering of tsunamigenic aftershocks from large strike-slip earthquakes: Analysis of the November 2000 New Ireland earthquake sequence: Geochemistry, Geophysics, Geosystems, v. 6, doi:10.1029/2005GC000935, 18 p. [Download PDF (6.5 MB)]
  • Hamilton, W.B., 1979. Tectonics of the Indonesian Region, USGS Professional Paper 1078.
  • Hayes, G. P., D. J. Wald, and R. L. Johnson (2012), Slab1.0: A three-dimensional model of global subduction zone geometries, J. Geophys. Res., 117, B01302, doi:10.1029/2011JB008524.
  • Holm, R. and Richards, S.W., 2013. A re-evaluation of arc-continent collision and along-arc variation in the Bismarck Sea region, Papua New Guinea in Australian Journal of Earth Sciences, v. 60, p. 605-619.
  • Holm, R.J., Richards, S.W., Rosenbaum, G., and Spandler, C., 2015. Disparate Tectonic Settings for Mineralisation in an Active Arc, Eastern Papua New Guinea and the Solomon Islands in proceedings from PACRIM 2015 Congress, Hong Kong ,18-21 March, 2015, pp. 7.
  • Johnson, R.W., 1976, Late Cainozoic volcanism and plate tectonics at the southern margin of the Bismarck Sea, Papua New Guinea, in Johnson, R.W., ed., 1976, Volcanism in Australia: Amsterdam, Elsevier, p. 101-116
  • Lay, T., and Kanamori, H., 1980, Earthquake doublets in the Solomon Islands: Physics of the Earth and Planetary Interiors, v. 21, p. 283-304.
  • Schwartz, S.Y., 1999, Noncharacteristic behavior and complex recurrence of large subduction zone earthquakes: Journal of Geophysical Research, v. 104, p. 23,111-123,125.
  • Schwartz, S.Y., Lay, T., and Ruff, L.J., 1989, Source process of the great 1971 Solomon Islands doublet: Physics of the Earth and Planetary Interiors, v. 56, p. 294-310.
  • Tregoning, P., McQueen, H., Lambeck, K., Jackson, R. Little, T., Saunders, S., and Rosa, R., 2000. Present-day crustal motion in Papua New Guinea, Earth Planets and Space, v. 52, pp. 727-730.

Earthquake Report: Tanzania

Well, I am a little late preparing this report. I actually put it together over the weekend, but am only now uploading this.
There was an interesting earthquake along the southwestern edge of Lake Victoria, in the East-Africa Rift (EAR) system. The EAR is one of the few continental rift systems on Earth. We think that continental rift systems are early in the development of an oceanic spreading ridge system. This may be what the Mid Atlantic Ridge system looked like long ago. There are no mapped faults in this region (at least in the papers that I found on the subject). On 2016.09.10, there was a M 5.9 earthquake and here is the USGS website for this earthquake. My poster below shows it as a M 5.7, but the magnitude has been adjusted to M 5.9.
Below is my interpretive map that shows the epicenter, along with the shaking intensity contours. These contours use the Modified Mercalli Intensity (MMI) scale. The MMI is a qualitative measure of shaking intensity. More on the MMI scale can be found here and here. This is based upon a computer model estimate of ground motions, different from the “Did You Feel It?” estimate of ground motions that is actually based on real observations.
I placed a moment tensor / focal mechanism legend on the poster. There is more material from the USGS web sites about moment tensors and focal mechanisms (the beach ball symbols). Both moment tensors and focal mechanisms are solutions to seismologic data that reveal two possible interpretations for fault orientation and sense of motion. One must use other information, like the regional tectonics, to interpret which of the two possibilities is more likely. Because there are no mapped faults to give me a clue as to which slip plane this earthquake may have occurred on, it is equivocal. However, the faults to the west, which are mapped as normal (extensional) faults, may have some strike-slip faults associated with them. If this earthquake is related in that way, the right-lateral shear across the plate boundary here would suggest that this M 5.9 earthquake was along a north-south striking fault, with a right-lateral sense of motion.


    Here are some of the figures on their own. I include the original figure captions below them as blockquotes.

  • Regions of extension (Saemundsson, 2010).

  • The Afro-Arabian rift system (continental graben and depressions are shaded) (From: Baker et al., 1972)

  • Fault segments along the EAR, Chorowicz (2005).

  • Hypsographic DEM of the East African rift system. Black lines: main faults; E–W dotted lines: locations of cross-sections of Fig. 3; white surfaces: lakes; grey levels from dark (low elevations) to light (high elevations). The East African rift system is a series of several thousand kilometers long aligned successions of adjacent individual tectonic basins (rift valleys), separated from each other by relative shoals and generally bordered by uplifted shoulders. It can be regarded as an intra-continental ridge system comprising an axial rift.

  • Faults characterized vs. their major sense of motion, Chorowicz (2005).

  • Western branch and part of eastern branch of the East African rift system, on shadowed DEM.

  • Regional tectonic strain, Chorowicz (2005).

  • On-going individualization of the Somalian plate in Eastern Africa. Asthenospheric intrusions (black polygons) show already open lithosphere. White arrows show direction of relative divergent movement.

  • This is an illustration showing how the extension in this region may be accommodated by dextral (right-lateral) strike-slip faults, Chorowicz (2005).

  • Fault and fold zone of the Tanganyika–Rukwa–Malawi segment of the EARS. Folds are developed in stripes between left-stepping en echelon dextral strike-slip faults. This pattern of folds explains why some segment border areas of the Tanganyika rift form low plains instead of the usual high shoulders.

    References

  • Baker, B.H., Mohr P.A., and Williams, L.A.J., 1972: Geology of the Eastern Rift System of Africa in The Geol. Soc. of America. Special Paper, 136, 67 pp.
  • Chorowicz, J., 2005. The East African rift system in Journal of African Earth Sciences, v. 43., p. 379-410.
  • Saemundsson, K., 2010. East African Rift System – an Overview presented at Short Course V on Exploration for Geothermal Resources, organized by UNU-GTP, GDC and KenGen, at Lake Bogoria and Lake Naivasha, Kenya, Oct. 29 – Nov. 19, 2010, 10 pp.

Earthquake Report: Bering-Kresla Shear Zone (Russia, west of Aleutians)

If there is an earthquake and nobody is there to feel it, did it shake? Here is the USGS website for the M 6.3 earthquake that occurred in the far western Aleutians, so far west, it is called Russia.
Below is my interpretive poster for this earthquake. This map shows the slab contours (an estimate of the subduction zone plate interface). These contours are estimated by Hayes et al., (2012). The hypocentral depth is 12.3 km, which is shallower than the slab depth according to Hayes et al. (2012). This earthquake is clearly in the North America plate. Check out the Krutikov et al. (2008) figure below to see possible ways to interpret this moment tensor.
I placed a moment tensor / focal mechanism legend on the poster. There is more material from the USGS web sites about moment tensors and focal mechanisms (the beach ball symbols). Both moment tensors and focal mechanisms are solutions to seismologic data that reveal two possible interpretations for fault orientation and sense of motion. One must use other information, like the regional tectonics, to interpret which of the two possibilities is more likely. The moment tensor shows either right-lateral or left-lateral motion on a strike-slip fault.

    I include some inset figures.

  • In the upper right corner is a figure that shows the historic earthquake ruptures along the Aleutian Megathrust (Peter Haeussler, USGS). See more about this figure below.
  • To the left of that is a figure that shows (a) residual bathymetry modeled by Basset et al. (2015), (b) seismicity and moment tensors for historic earthquakes, and (c) earthquake slip patches for historic earthquakes.
  • In the lower left corner shows a low angle oblique view of the slab geometry for the Kuril-Kamchatka megathrust (Portnyagin and Manea, 2008).
  • To the right of that is a cross section of the Aleutian subduction zone (Saltus and Barnett, 2000) which shows an oblique cross section of the Aleutian subduction zone that is a part of the “Eastern Aleutian Volcanic Arc Digital Model.’


  • Here is a map that shows historic earthquake slip regions as pink polygons (Peter Haeussler, USGS). Dr. Haeussler also plotted the magnetic anomalies (grey regions), the arc volcanoes (black diamonds), and the plate motion vectors (mm/yr, NAP vs PP).

  • Here is a map that shows some of the large earthquakes in this region from 1996 through 2015. Refer to the moment tensor legend to help interpret the moment tensors for each earthquake. All, but one, are compressional solutions. Note how all the compressional earthquakes have roughly the same strike, oriented relative to the plate convergence vectors (blue arrows). The Aleutian arc may have slip partitioning that results in clockwise rotation of blocks instead of forearc sliver faults. I would have suspected that the strike of the thrust earthquakes would rotate with the strike of the subduction zone (like that occurs at the intersection of the New Britain and Solomon trenches).

  • Here is a map from Krutikov et al. 2008 (Active Tectonics and Seismic Potential of Alaska, Geophysical Monograph Series 179 Copyright 2008 by the American Geophysical Union. 10.1029/179GM07). Note that there are blocks that are rotating to accommodate the oblique convergence. There are also margin parallel strike slip faults that bound these blocks. These faults are in the upper plate, but may impart localized strain to the lower plate, resulting in strike slip motion on the lower plate (my arm waving part of this). Note how the upper plate strike-slip faults have the same sense of motion as these deeper earthquakes.

Here is the tectonic summary poster from the USGS. This shows epicenters for earthquakes from 1900-2014, plus the slab contours from Hayes et al. (2012). These slab contours are estimate for the location of the subduction zone fault and it is based upon the 3-D location of earthquakes. There is considerable uncertainty with this model, but it is the best that we have. Hayes and his colleagues are currently updating these global slab models.


The USGS prepared a more comprehensive summary poster for this region. This poster has some plots of seismicity in cross sectional view. Here is the poster, but I include some sections of the poster below that are relevant for this earthquake.


Here is a map for the southern Kamchatka Peninsula. Earthquakes are plotted with diameter scaled to magnitude. The cross section C-C’ is labeled, as are the Hayes et al. (2012) slab contours. I place the epicenter for this earthquake as a green circle. The diameter is scaled approximately to magnitude and the location is approximate.


Here I place the hypocenter for the 2016.01.30 earthquake on the cross section from the USGS poster. The location is approximate.

  • Here is the low-angle oblique map from Portnyagin and Manea (2008). I include the figure caption as a blockquote below.

  • Kamchatka subduction zone. A: Major geologic structures at the Kamchatka–Aleutian Arc junction. Thin dashed lines show isodepths to subducting Pacific plate (Gorbatov et al., 1997). Inset illustrates major volcanic zones in Kamchatka: EVB—Eastern Volcanic Belt; CKD—Central Kamchatka Depression (rift-like tectonic structure, which accommodates the northern end of EVB); SR—Sredinny Range. Distribution of Quater nary volcanic rocks in EVB and SR is shown in orange and green, respectively. Small dots are active vol canoes. Large circles denote CKD volcanoes: T—Tolbachik; K l — K l y u c h e v s k o y ; Z—Zarechny; Kh—Kharchinsky; Sh—Shiveluch; Shs—Shisheisky Complex; N—Nachikinsky. Location of profiles shown in Figures 2 and 3 is indicated. B: Three dimensional visualization of the Kamchatka subduction zone from the north. Surface relief is shown as semi-transparent layer. Labeled dashed lines and color (blue to red) gradation of subducting plate denote depths to the plate from the earth surface (in km). Bold arrow shows direction of Pacific Plate movement.

Earthquake Report: Oklahoma!

Oklahoma is OK! Albeit a little shaken up. Early this morning there was an earthquake that started off their Labor Day Weekend. Here is the USGS website for this M 5.6 earthquake. There have been earthquakes of similar magnitude in OK in 1952 and 2011.
Below is my interpretive map that shows the epicenter, along with the shaking intensity contours. These contours use the Modified Mercalli Intensity (MMI) scale. The MMI is a qualitative measure of shaking intensity. More on the MMI scale can be found here and here. This is based upon a computer model estimate of ground motions, different from the “Did You Feel It?” estimate of ground motions that is actually based on real observations.
I placed a moment tensor / focal mechanism legend on the poster. There is more material from the USGS web sites about moment tensors and focal mechanisms (the beach ball symbols). Both moment tensors and focal mechanisms are solutions to seismologic data that reveal two possible interpretations for fault orientation and sense of motion. One must use other information, like the regional tectonics, to interpret which of the two possibilities is more likely. This earthquake could be either a northeast striking left lateral earthquake or a northwest striking left-lateral strike-slip earthquake. Based upon the seismicity for this region of the past week or so, it appears aligned along a northwest trend.

    I include some inset figures.

  • In the upper right corner is a plot showing “Did You Feel It?” (DYFI) responses for two earthquakes. This shows how earthquakes on the west coast attenuate faster than earthquakes on the east coast. Basically, on the west coast, due to the geology there, seismic waves are absorbed by the Earth with distance. While, on the east coast, they do so to a lesser degree. The result is that earthquakes on the east coast are felt from a greater distance than those on the west coast. This comparison is for between the 2004.09.28 M 6.0 Parkfield Earthquake in California and the 2011.08.23 M 5.8 Mineral Virginia Earthquake.
  • In the lower right corner is an isoseismal map from the 1952 Oklahoma earthquake. The black lines are isoseismal lines, which means that along those lines, there were ground motions of equal intensity. The scale used on this map is similar (but different from) the MMI scale discussed above and plotted on the main map.
  • In the lower left corner are two panels. The upper panel is a map that shows the responses from “DYFI?” reports. When this map was made, there were 51,680 responses. The lower panel shows how ground motions attenuate with distance, based upon these DYFI reports. The small blue dots are individual reports. The large blue and red dots are the mean and median intensity, respectively. The green line is based upon a Ground Motion Prediction Equation (GMPE) numerical model. GMPE models are empirical relations developed using thousands of earthquake seismologic observations. This model is based upon earthquakes from the central and eastern USA.
  • To the right of those panels are two shaking intensity maps. These maps are generated using the GMPE models. The map on the left is from this 2016.09.03 M 5.6 earthquake. The map on the right is from the 2011.11.06 M 5.6 earthquake.


    I created an animation showing the uptake in seismicity in this region in the past decade or so. This animation shows seismicity from 1974 through this morning. I queried the USGS earthquake website extending the date range to 1900, but the earliest earthquake records for this region are in 1974. This increased seismicity has made Oklahoma the new earthquake capital of the lower 48 (Alaska is the earthquake king up north and Puerto Rico wins an award for number of earthquakes per unit area, down south). The increased seismicity, has been linked to the injection of waste water into the ground. Individual earthquakes are difficult to link to individual actions. However, when waste water injection is halted, seismicity is reduced. Do not confuse waste water injection with fracking. Sure, the waste water comes from the fracking industry, but the induced seismicity is largely from the waste water injection. There is some induced seismicity from fracking, but it is typically of much smaller magnitude than that for induced seismicity resulting from waste water injection.

  • First I show a map with all the earthquakes shown in the animation, then I present the animation. The map and animation include the MMI contours from today’s M 5.6 earthquake.

  • Here is a link to the embedded video below (3 MB mp4)
    Here is a map from the USGS link above that shows seismicity since 1980. There are polygons drawn where these earthquakes are suggested to be induced by humans.


UPDATES:

    Update: 2016.09.03 14:30 PST

  • Steve Hicks, from the University of Liverpool, (@seismo_steve) used some published faults from OK, compared to the epicenters of the 2011 Prague and 2016 Pawnee earthquakes, to interpret the fault plane solution for the moment tensors. This is a reasonable interpretation, given the fault maps. However, I remember doing this for the 2012 earthquakes offshore Sumatra.

  • Daniel McNamara, from the USGS, (@DanielMcNamara) later plotted the aftershocks. These aftershocks appear to align along a possible fault that is oblique to some of the previously mapped faults. Perhaps this is a better interpretation.

Earthquake Report: Mendocino fault!

Well, I felt that one. The shaking lasted about 5-7 seconds in Manila, CA (where I live). Here is the USGS website for this M = 5.6 earthquake. This earthquake appears to have occurred along the Mendocino fault, a right-lateral (dextral) transform plate boundary. This plate boundary connects the Gorda ridge and Juan de Fuca rise spreading centers with their counterparts in the Gulf of California, with the San Andreas strike-slip fault system. Transform plate boundaries are defined that they are strike-slip and that they connect spreading ridges. In this sense of the definition, the Mendocino fault and the San Andreas fault are part of the same system. This earthquake appears to have occurred in a region of the Mendocino fault that ruptured in 1994. See the figures from Rollins and Stein below.
Below is my interpretive map that shows the epicenter, along with the shaking intensity contours. These contours use the Modified Mercalli Intensity (MMI) scale. The MMI is a qualitative measure of shaking intensity. More on the MMI scale can be found here and here. This is based upon a computer model estimate of ground motions, different from the “Did You Feel It?” estimate of ground motions that is actually based on real observations.
I placed a moment tensor / focal mechanism legend on the poster. There is more material from the USGS web sites about moment tensors and focal mechanisms (the beach ball symbols). Both moment tensors and focal mechanisms are solutions to seismologic data that reveal two possible interpretations for fault orientation and sense of motion. One must use other information, like the regional tectonics, to interpret which of the two possibilities is more likely. Based on the moment tensor and my knowledge of the tectonics of this region, I interpret this earthquake to have had a right lateral strike slip motion along an east-west fault.

    I have placed several inset figures.

  • In the lower left corner is a map of the Cascadia subduction zone and regional tectonic plate boundary faults. This is modified from several sources (Chaytor et al., 2004; Nelson et al., 2004)
  • Above the CSZ map is an illustration from Atwater et al. (2005). This figure shows how a subduction zone deforms between (interseismic) and during (coseismic) earthquakes. We also can see how a subduction zone generates a tsunami. Atwater et al., 2005.
  • In the upper right corner is a map from Rollins and Stein (2010), showing their interpretations of different historic earthquakes in the region. This was published in response to the January 2010 Gorda plate earthquake.
  • In the lower right corner is an image from an introductory textbook I found several years ago. I believe this is from Pearson Higher Ed.


For more on the graphical representation of moment tensors and focal mechnisms, check this IRIS video out:

Here is a map of the Cascadia subduction zone, modified from Nelson et al. (2004). The Juan de Fuca and Gorda plates subduct norteastwardly beneath the North America plate at rates ranging from 29- to 45-mm/yr. Sites where evidence of past earthquakes (paleoseismology) are denoted by white dots. Where there is also evidence for past CSZ tsunami, there are black dots. These paleoseismology sites are labeled (e.g. Humboldt Bay). Some submarine paleoseismology core sites are also shown as grey dots. The two main spreading ridges are not labeled, but the northern one is the Juan de Fuca ridge (where oceanic crust is formed for the Juan de Fuca plate) and the southern one is the Gorda rise (where the oceanic crust is formed for the Gorda plate).


Here is a map from Rollins and Stein, showing their interpretations of different historic earthquakes in the region. This was published in response to the January 2010 Gorda plate earthquake. The faults are from Chaytor et al. (2004). The 1980, 1992, 1994, 2005, and 2010 earthquakes are plotted and labeled. I did not mention the 2010 earthquake, but it most likely was just like 1980 and 2005, a left-lateral strike-slip earthquake on a northeast striking fault.


Here is a large scale map of the 1983 earthquake swarm. The mainshock epicenter is a black star and epicenters are denoted as white circles. Note how the aftershocks trend slightly southeast in this region. Today’s swarm does the same (and the moment tensor also shows a slightly southeast strike). Note how the interpreted fault dips slightly to the north, which is the result of north-south compression from the relative northward motion of the Pacific plate.


Here is a large scale map of the 1994 earthquake swarm. The mainshock epicenter is a black star and epicenters are denoted as white circles.


Here is a plot of focal mechanisms from the Dengler et al. (1995) paper in California Geology.


In this map below, I label a number of other significant earthquakes in this Mendocino triple junction region. Another historic right-lateral earthquake on the Mendocino fault system was in 1994. There was a series of earthquakes possibly along the easternmost section of the Mendocino fault system in late January 2015, here is my post about that earthquake series.


The Gorda and Juan de Fuca plates subduct beneath the North America plate to form the Cascadia subduction zone fault system. In 1992 there was a swarm of earthquakes with the magnitude Mw 7.2 Mainshock on 4/25. Initially this earthquake was interpreted to have been on the Cascadia subduction zone (CSZ). The moment tensor shows a compressional mechanism. However the two largest aftershocks on 4/26/1992 (Mw 6.5 and Mw 6.7), had strike-slip moment tensors. These two aftershocks align on what may be the eastern extension of the Mendocino fault.
There have been several series of intra-plate earthquakes in the Gorda plate. Two main shocks that I plot of this type of earthquake are the 1980 (Mw 7.2) and 2005 (Mw 7.2) earthquakes. I place orange lines approximately where the faults are that ruptured in 1980 and 2005. These are also plotted in the Rollins and Stein (2010) figure above. The Gorda plate is being deformed due to compression between the Pacific plate to the south and the Juan de Fuca plate to the north. Due to this north-south compression, the plate is deforming internally so that normal faults that formed at the spreading center (the Gorda Rise) are reactivated as left-lateral strike-slip faults. In 2014, there was another swarm of left-lateral earthquakes in the Gorda plate. I posted some material about the Gorda plate setting on this page.
There are three types of earthquakes, strike-slip, compressional (reverse or thrust, depending upon the dip of the fault), and extensional (normal). Here is are some animations of these three types of earthquake faults. Many of the earthquakes people are familiar with in the Mendocino triple junction region are either compressional or strike slip. The following three animations are from IRIS.
Strike Slip:

Compressional:

Extensional:

This figure shows what a transform plate boundary fault is. Looking down from outer space, the crust on either side of the fault moves side-by-side. When one is standing on the ground, on one side of the fault, looking across the fault as it moves… If the crust on the other side of the fault moves to the right, the fault is a “right lateral” strike slip fault. The Mendocino and San Andreas faults are right-lateral (dextral) strike-slip faults.

    References:

  • Atwater, B.F., Musumi-Rokkaku, S., Satake, K., Tsuju, Y., Eueda, K., and Yamaguchi, D.K., 2005. The Orphan Tsunami of 1700—Japanese Clues to a Parent Earthquake in North America, USGS Professional Paper 1707, USGS, Reston, VA, 144 pp.
  • Chaytor, J.D., Goldfinger, C., Dziak, R.P., and Fox, C.G., 2004. Active deformation of the Gorda plate: Constraining deformation models with new geophysical data: Geology v. 32, p. 353-356.
  • Dengler, L.A., Moley, K.M., McPherson, R.C., Pasyanos, M., Dewey, J.W., and Murray, M., 1995. The September 1, 1994 Mendocino Fault Earthquake, California Geology, Marc/April 1995, p. 43-53.
  • Nelson, A.R., Asquith, A.C., and Grant, W.C., 2004. Great Earthquakes and Tsunamis of the Past 2000 Years at the Salmon River Estuary, Central Oregon Coast, USA: Bulletin of the Seismological Society of America, Vol. 94, No. 4, pp. 1276–1292
  • Rollins, J.C. and Stein, R.S., 2010. Coulomb stress interactions among M ≥ 5.9 earthquakes in the Gorda deformation zone and on the Mendocino Fault Zone, Cascadia subduction zone, and northern San Andreas Fault: Journal of Geophysical Research, v. 115, B12306, doi:10.1029/2009JB007117, 2010.

Earthquake Report: New Zealand!

This was a very busy week for me, so I missed reporting on this series of earthquakes offshore the North Island of New Zealand. I did put together an interpretive Earthquake Report poster for these earthquakes for my general education earthquakes class, of which I present below. Initially there was a M 5.8 earthquake (USGS website for M 5.8), with a M 7.1 about 18 hours later (USGS website for M 7.1). Here is a kml that includes these, as well as the aftershocks to date. We have a great deal of information about the plate tectonics of this region. These earthquakes are along the northern Hikurangi margin, which is a convergent plate boundary formed by the subduction of the Pacific plate westward beneath the Australia plate.
The M 5.8 earthquake had an hypocentral depth of ~22 km, which (based upon the slab contours) places this earthquake in the downgoing Pacific plate. As plates subduct, they undergo extension as the deeper part of the plate pulls down on the shallower part of the plate. This “slab tension” can result in extensional (normal) earthquakes. Also, due to various reasons, the downgoing plate can be bent or flexed downwards. This can happen oceanward of the subduction zone or beneath the tip of the subduction zone fault, after the downgoing plate has subducted. If this downgoing plate flexes downward, the upper part of the lithosphere undergoes extension and extensional/normal earthquakes occur.
Initially, the M 7.1 earthquake was given an hypocentral depth of ~300 km. This was confusing as it did not seem to be anywhere near oceanic lithosphere as estimated by people who study this region. Within minutes, the USGS hypocentral depth was re-determined to be ~19 km. Comparing this depth with the slab contours (Hayes et al., 2012), this earthquake also occurred in the Pacific plate. The M 5.8 is probably a foreshock for the M 7.1, but we also might consider that the M 5.8 triggered the M 7.1 earthquake. Others will need to analyze these earthquake more before this detail can be worked out.
Below is my interpretive poster for this earthquake. This map shows the slab contours (an estimate of the subduction zone plate interface). These contours are estimated by Hayes et al., (2012). The hypocentral depth is 19.0 km, which is deeper than the slab depth according to Hayes et al. (2012), which is probably about 15 km. This earthquake is clearly in one of the downgoing slabs of the Pacific plate.
I placed a moment tensor / focal mechanism legend on the poster. There is more material from the USGS web sites about moment tensors and focal mechanisms (the beach ball symbols). Both moment tensors and focal mechanisms are solutions to seismologic data that reveal two possible interpretations for fault orientation and sense of motion. One must use other information, like the regional tectonics, to interpret which of the two possibilities is more likely. The moment tensor shows northwest-southeast tension. If this is due to slab tension, then the slab would be dipping to the northwest, or the southeast. This tension may also be due to some form of bending in the slab, but it is difficult to tell given these limited data. Most of the recent seismicity in this region is associated with convergence along the New Britain trench or the South Solomon trench.

    I include some inset figures.

  • In the upper right corner is a generalized tectonic map from Mike Norton (see poster for attribution).
  • In the lower right corner is a cross section of the southern Kermadec Trench. This was produced by Jack Cook at the Woods Hole Oceanographic Institution. The Lousiville Seamount Chain is clearly visible in this graphic.
  • In the upper left corner I include a map from the USGS Open File Report for this region of the world (Benz et al., 2011). The map shows seismicity colored vs. depth, some slab contours, and the location of the two cross sections that are also included in this poster (J-J’ and K-K’).


    Here are two figures from Jascha Polet, a seismologist at Cal Poly Pomona.

  • Here is a map showing seismicity and moment tensors for historic earthquakes, as well as the m 7.1 earthquake.

  • Here is a cross section showing the same seismicity and moment tensor data.

  • Here are some cross sections from Scherwath et al. (2010), located close to where the M 7.1 earthquake occurred. Note how the M 7.1 occurred at a location where the downgoing Pacific plate is indeed bending downward near the M 7.1 hypocenter.

For more on the graphical representation of moment tensors and focal mechanisms, check this IRIS video out: