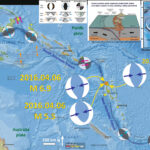
We have had several aftershocks and triggered earthquakes in the region. I provide a brief update below. Here were my first posts about this earthquake series: 2016.04.03 2016.04.06 Here are the USGS websites for the largest earthquakes plotted below. 2016.04.03…
Earthquake Report: Vanuatu!
We just had another M 6.9 earthquake about 40 km from another M 6.9 earthquake from a few days ago. Here is my earthquake report from that earlier earthquake. They are both about the same depth. While the depths probably…
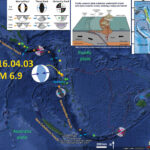
Earthquake Report: Vanuatu!
We just had an earthquake along the New Hebrides Trench in the western Pacific. Here is the USGS webpage for this M 6.9 earthquake. Below is my interpretive earthquake report poster. I plot the epicenters for earthquakes from the past…
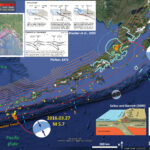
Earthquake Report: Alaska Peninsula!
Last night we had a shallow crustal earthquake along the Alaska Peninsula. Here is the USGS website for this M = 6.2 earthquake. Below is my interpretive map where I use Google Earth and the kml (keyhole markup language) files…
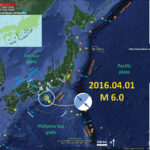
Earthquake Report: Japan!
Today there was an earthquake offshore of southern Japan. Here is the USGS website for the M 6.0 earthquake. It is difficult to tell if this earthquake was on the megathrust or not. Below is my interpretive map. I plot…