Flood Report: Eel and Van Duzen Rivers!

Yesterday and today were flood events on the Van Duzen and Eel Rivers. I will post more later as I am preparing for the beginning of the Spring Term which begins tomorrow.
First I post the USGS hydrographs from NOAA that I obtained at the water weather dot gov website here.

Van Duzen River

Observations: Jan. 17, 2016 (16:20-17:15)

Here is the Van Duzen River (at Bridgeville) hydrograph collected this afternoon (BRGC1). I made photo and video observations downstream of this gage and I post photos and videos below.


Here is a legend and some of the historic records at the BRGC1 gage.


Here is a map showing the gage location (approximate).


Here are the observations downloaded from the NOAA website, showing the USGS water surface elevations (river stage). I highlighted the time of the peak discharge and the times during which I collected these photos and videos.

    Here are some photos.

  • HWY 101 Bridge Panorama

  • HWY 101 Bridge

  • East of Carlotta

  • Swimmers Delight River Acess Panorama

  • Swimmers Delight BBQ grill

  • Swimmers Delight River access

Eel River

Observations: Jan. 18, 2016 (12:45-14:00)

Here is the Eel River (at Fernbridge) hydrograph collected this afternoon (FNRC1). I made photo and video observations downstream of this gage and i post photos and videos below.


Here is a legend and some of the historic records at the BRGC1 gage.


Here is a map showing the gage location (approximate).


Here are the observations downloaded from the NOAA website, showing the USGS water surface elevations (river stage). I highlighted the time of the peak discharge and the times during which I collected these photos and videos.

    Here are some photos.

  • Fernbridge

  • Fernbridge

  • Fernbridge

  • Fernbridge

  • Cock Island Robin Road Bridge

  • Cock Island Robin Road Bridge

  • Cock Island Robin Road Bridge

  • Cock Island Robin Road Bridge

  • Cock Island Robin Road Bridge

  • Cock Island Robin Road Bridge

Earthquake Report: Cuba, Jamaica, Hispaniola, Puerto Rico (1900-2016)!

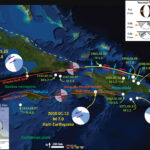
Following yesterdays earthquakes in Cuba, I put together an earthquake summary poster for this region for the period from 1900 through Jan 17, 2016. Here is the USGS query that I used to get the data.
Here is my Earthquake Report for the three earthquakes south of Cuba from yesterday. These earthquakes appear to have occurred along a left-lateral strike-slip fault system. I include some embedded animations about the different types of earthquake faults below.

Here is the map. I show the USGS epicenters and have plotted the USGS moment tensors for the earthquakes that have them calculated. The earlier earthquakes do not have these data. Like the map from yesterday, I include an inset from Guinta and Orioli (2011) that shows more details about the tectonics from this region. More can be found in their paper here.
There is a legend that shows how moment tensors can be interpreted. Moment tensors are graphical solutions of seismic data that show two possible fault plane solutions. One must use local tectonics, along with other data, to be able to interpret which of the two possible solutions is correct. The legend shows how these two solutions are oriented for each example (Normal/Extensional, Thrust/Compressional, and Strike-Slip/Shear). There is more about moment tensors and focal mechanisms at the USGS.


Here is another map showing the complicated faulting in the region (that is not reflected in my earthquake history map above!). This is from Prindell et al. (2005). I include their caption as a blockquote below. Prindell et al. (2011) present their comprehensive interpretation of the tectonic history of the region.

Plate-boundary map and bathymetry of the circum-Caribbean region, showing key tectonic features and geological provinces discussed in the text. Leading and trailing boundaries of the Caribbean plate are subduction zones associated with active volcanic arcs (Lesser Antilles and Panama–Costa Rica arcs, respectively). The southern plate boundary with Colombia, Venezuela, and Trinidad is wide, diffuse, and complex; strain is partitioned between thrust faulting and strike-slip faulting associated with development of pull-apart basins. Similarly, prior to the Eocene collision of Cuba with the Bahamas Bank, the northern plate boundary was also wide and complexly partitioned. Post-collision, the plate boundary was reorganized, with motion now concentrated on the relatively simple Cayman Trough in the west, whereas complexly partitioned thrust and strike-slip faulting continues in the Puerto Rico segment.

For more on the graphical representation of moment tensors and focal mechnisms, check this IRIS video out:

There are three types of earthquakes, strike-slip, compressional (reverse or thrust, depending upon the dip of the fault), and extensional (normal). Here is are some animations of these three types of earthquake faults. Many of the earthquakes people are familiar with in the Mendocino triple junction region are either compressional or strike slip. The following three animations are from IRIS.
Strike Slip:

Compressional:

Extensional:

This figure shows what a transform plate boundary fault is. Looking down from outer space, the crust on either side of the fault moves side-by-side. When one is standing on the ground, on one side of the fault, looking across the fault as it moves… If the crust on the other side of the fault moves to the right, the fault is a “right lateral” strike slip fault. The Mendocino and San Andreas faults are right-lateral (dextral) strike-slip faults.


Here is an IRIS animation showing a transform plate boundary fault as it relates to spreading ridges.

Earthquake Report: Cuba!

We just had three earthquakes on the southern boundary of Cuba.

    Here are the USGS websites for these earthquakes:

  • 2016.01.17 M 4.6
  • 2016.01.17 M 5.1
  • 2016.01.17 M 5.1

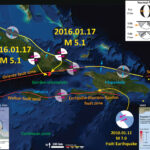
These do not have USGS moment tensors, but I suspect that they are strike-slip earthquakes associated with the Oriente fault zone. I include idealized pure strike slip moment tensors as examples of what they might look like. Below is a map showing the epicenters of these 3 earthquakes. I include some line work showing a simplified view of the plate boundary faults in this region. I include a more detailed fault map from Guinta and Orioli (2011). I also include some information about the 2010.01.12 M 7.0 Haiti earthquake. Here is the USGS web page for the Haiti earthquake. The Haiti inset shows shaking intensity, using the Modified Mercalli Intensity Scale, for this earthquake. There is quite a bit of summary information on the Wiki page for the Haiti earthquake.
There is a legend that shows how moment tensors can be interpreted. Moment tensors are graphical solutions of seismic data that show two possible fault plane solutions. One must use local tectonics, along with other data, to be able to interpret which of the two possible solutions is correct. The legend shows how these two solutions are oriented for each example (Normal/Extensional, Thrust/Compressional, and Strike-Slip/Shear). There is more about moment tensors and focal mechanisms at the USGS.


Here is the Guinta and Orioli (2011) tectonic map. They present their interpretation of the geologic history in their paper here.


Here is another figure from Guinta and Orioli (2011) showing even more detail about the faulting and geologic units of this region. They discuss the different terranes shown in this figure within their paper as well.


Here is the USGS poster for the 2010 M 7.0 Haiti earthquake.

Earthquake Report: Hokkaido!

Today we had an earthquake offshore of Hokkaido. This earthquake occurred near the 2003 Tokachi_oki earthquake, a M 8.3 earthquake that is responsible for one of the only direct observations of a seismogenic turbidity current.
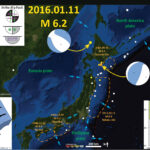
Here is my interpretive map. I plot the USGS earthquake epicenters from the past 30 days. Here is the USGS query that I used to make the base map. Here is the USGS web site for this M 6.7 earthquake. A few days ago there was also a very deep earthquake, with a magnitude of M 6.0, to the northwest. Here is the USGS website for that earthquake. The M 6.7 earthquake hypocenter plots where the subducting slab is mapped by Hayes et a. (2012). The M 6.2 plots deeper than the fault, which makes sense as it is extensional and probably not along the subduction zone.
I include dashed outlines for some of the subduction zone earthquakes for Japan. This is by no means an exhaustive survey of historic seismicity, just some of the notable ones that are at the top of my head. I include the 1944 M 8.1 Tonankai and 1946 M 8.0 Nankai earthquakes, the 2003 M 8.3 Tokachi-Oki earthquake, and the 2011 M 9.0 Tohoku-Oki earthquake.
I also include a schematic illustration from L. Jolivet, ISTO from here that shows how the Pacific and Philippine plates are subducting beneath the North America and Eurasia plates.
I include a slip distribution map for the 2003 Tokachi-Oki earthquake from the Earthquake Research Institute at The University of Tokyo here. They also plot the slip distributions from the 1952 M 8.2 Tokachi-Oki and 1973 M 7.4 Hokkaido earthquakes.
There is a legend that shows how moment tensors can be interpreted. Moment tensors are graphical solutions of seismic data that show two possible fault plane solutions. One must use local tectonics, along with other data, to be able to interpret which of the two possible solutions is correct. The legend shows how these two solutions are oriented for each example (Normal/Extensional, Thrust/Compressional, and Strike-Slip/Shear). There is more about moment tensors and focal mechanisms at the USGS.


This map shows the current tectonic configuration of this region, along with some inherited features from the tectonic past (e.g. green lines). This is from NUMO’s report: “Evaluating Site Suitability for a HLW Repository (Scientific Background and Practical Application of NUMO’s Siting Factors), NUMO-TR-04-04.”


Also from the NUMO report, this shows the Niigata-Kobe fold and thrust belt. In addition, this map shows a northwest striking convergent plate boundary along the southeastern boundary of Hokkaido. However, it cannot explain the interesting orientation of the M 6.2 deep (240 km) earthquake.


I have several earthquake reports for Japan and this region.
Here is a brief report on the 2011 M 9.0 Tohoku-Oki earthquake. Below is the USGS poster for this earthquake.


There are probably a 100 or more slip models for this earthquake, which reminds us that these slip models are non unique. We need to recognize that we do not really know how much any fault slips during an earthquake. We can only take the observations and make estimates. There continue to be aftershocks, which help define the fault that ruptured in 2011. In Feb. 2015 there was a series of M 6.0-6.7 earthquakes along the north east boundary of the 2011 slip region. They happened in a region of low slip. Here is my earthquake report for these earthquakes. Below is a map that shows these aftershocks, along with a slip model from Ammon et al., 2011.


I present several of the better slip models for the M 9.0 Tohoku-Oki earthquake on this page. Below is a figure from Toda et al. (2011) that shows focal mechanisms for many aftershocks as they relate to their slip model. Please check out the page that shows some other slip models. There is more information there.


There was an interesting triggered earthquake (though several years too late, so not really triggered, but related possibly) on 2013.10.25. This M 7.1 earthquake happened in the updip direction from the M 9.0 earthquake. Here is my earthquake report for this earthquake. On this page I discuss aftershocks and how they fit into the big picture (what is an aftershock, how long to they happen, etc.).
To the southeast of Japan is the Bonin trench and Mariana trench. This region has been quite active lately too! On 2015.05.30 there was a series of deep focus earthquakes, along with some shallower triggered earthquakes (some might call them aftershocks, but they are clearly not aftershocks). Here is my earthquake report for the deep M 6.8 earthquake. Below is my interpretive map.

Earthquake Report: Cape Mendocino!

We just had a pair of earthquakes near the town of Petrolia (first oil well in CA drilled here, ergo the name). The first one I did not feel, but I did feel the quick jolt of the second one.

    Here are the USGS websites for these earthquakes:

  • 2016.01.07 M 3.3
  • 2016.01.07 M 4.3
  • later there was another quake

  • 2016.01.07 M 3.3
  • and this one

  • 2016.01.07 M 2.7

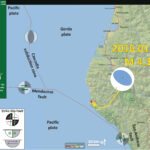
I will update this later, but for now, here is a map that shows the epicenter for these two earthquakes. I include the focal mechanism for the M 4.2 earthquake. The 3.3 was initially a 3.1 and the 4.2 was initially a 4.3. Interesting that we have had a number of earthquakes in this region, that have strike-slip senses of motion, probably associated with the Mendocino fault. If we get a moment tensor, it might show that this is also a strike-slip earthquake. We will just need to wait and see. Sometimes focal mechanisms and moment tensors show different types of earthquake motions.
The depth suggests that this is in the downgoing Gorda plate. I would have thought this would have been in the North America plate, given the compressional focal mechanism. However, the San Andreas fault system (Sierra Nevada block) is causing north-south compression. This is leading to the highest uplift rates in the continental US along the King Range. Perhaps this north-south compression is being transferred into the GP in this location. Of course, the depth could be incorrect (though this is not an offshore eq, so the depth is probably not that bad). Very interesting focal mechanism.
UPDATE midnight PST:
There is now a USGS moment tensor for this earthquake. I have updated the map to incorporate this. The orientation of compression from this moment tensor makes more sense given the convergence along the subduction zone. I will have to think about this a little more. The orig map is here. Also, the magnitude is back to a M 4.3.
/update
UPDATE thrs 11 AM PST:
Take a look at the “Did You Feel iT?” map in the lower right corner. The region of Petrolia has the highest shaking intensity (using the Modified Mercalli Intensity scale). Head to the east, into the hills, the shaking diminishes. However, head even further east, note that the shaking increases again. Why do you think this is the case? Those polygons include regions in the Eel River Valley. This area is a river valley filled with sediments. These sediments tend to amplify ground shaking. Fascinating (in a voice from Spock of Star Trek).
/update


Funny, when the first quake hit, the USGS had a ? for the magnitude. Here is a screenshot evidence of that.


Here is the seismograph from Jamie Wayne.


A few days ago, we had a strike-slip earthquake in this area. Here is the earthquake report for that M 4.5 earthquake. Below is a map. I include a good review of the local tectonics on this page.


Speaking of MF earthquakes in this region, there was a swarm in January of 2015
Here is my report that shows the seismicity aligning with where the MF may exist. Below is a map from that series of quakes.


Also, in April of 2015, we had an earthquake further offshore (M = 4.7). Here is my report for that earthquake. Below is a map that summarizes some of the earthquakes in this region from past few decades.


A few days later, there was another eq along the MF (M = 5.5). Here is my report for that earthquake. Below is a map.


Then in November 2015, there was a M 4.3 earthquake. Here is my report for that earthquake. Below is a map.


Here is the coolest of all of these earthquakes from the past year in this region. Here is my report for this M 3.0 earthquake. Below is a map.


Here is a summary of recent seismicity for this region, along with a couple summaries for Cascadia in general.

http://earthquake.usgs.gov/earthquakes/map/#%7B%22feed%22%3A%221day_m25%22%2C%22search%22%3Anull%2C%22listFormat%22%3A%22default%22%2C%22sort%22%3A%22newest%22%2C%22basemap%22%3A%22terrain%22%2C%22autoUpdate%22%3Atrue%2C%22restrictListToMap%22%3Atrue%2C%22timeZone%22%3A%22utc%22%2C%22mapposition%22%3A%5B%5B39.92237576385941%2C-125.82366943359374%5D%2C%5B40.99959341455489%2C-123.18695068359374%5D%5D%2C%22overlays%22%3A%7B%22plates%22%3Atrue%7D%2C%22viewModes%22%3A%7B%22map%22%3Atrue%2C%22list%22%3Afalse%2C%22settings%22%3Afalse%2C%22help%22%3Afalse%7D%7D

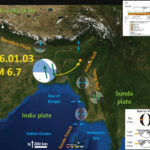
Earthquake Report: India!

Today we had a good sized earthquake in eastern India, within the India-Burmese wedge (IBW). The IBW is a part of the convergent plate boundary between the India plate to the west and the Burma (part of Eurasia) plate to the east. This plate boundary has been evolving since India came into the scene about 60 Ma (Curray, 2005). Prior to that, this boundary is thought to have been primarily convergent. Once India came into the region, prior to colliding with Asia (about?), this margin began to accommodate right lateral (dextral) shear. There is a major strike-slip fault, the Saging fault (SF), to the east of the IBW (Wang et al., 2014). The SF accommodates most of this shear, but some continues to be accommodated in the IBW (Maurin and Rangin, 2009).
Below is a map where I plot the epicenter for today’s M 6.7 earthquake, along with the moment tensor. I also include some inset maps. The lower left inset map is from Curray (2005) and shows the regional tectonics. The map on the right (Maurin and Rangin, 2009) shows the details of faulting in this region. In the upper right corner there is a cross section that is the east-west bold black line (at 22 degrees North) in the Maurin and Rangin (2009) map. This cross section is a little south of today’s earthquake, but is still relevant.
There is a legend that shows how moment tensors can be interpreted. Moment tensors are graphical solutions of seismic data that show two possible fault plane solutions. One must use local tectonics, along with other data, to be able to interpret which of the two possible solutions is correct. The legend shows how these two solutions are oriented for each example (Normal/Extensional, Thrust/Compressional, and Strike-Slip/Shear). There is more about moment tensors and focal mechanisms at the USGS.
Today’s M 6.7 earthquake (here is the USGS web page for this earthquake) possibly occurred along the Churachandpur-Mao fault (Wang et al., 2014). Based upon our knowledge of the regional tectonics I interpret this earthquake to have a right-lateral oblique sense of motion.


Here is the figure caption for the Maurin and Rangin (2009) map and cross section in the above map.

(a) General structural map of the Indo-Burmese ranges. The arrow shows the motion of the India Plate with respect to the Burma Plate [Socquet et al., 2006]. Figures 3, 5, 7, 8, and 13 are located with black boxes. The black dashed line is the trace of the buried incipient Chittagong Coastal Fault (C. C. Fault) discussed in this paper. The gray dashed line is the approximate position of the deformation front above the de´collement, in the western boundary of the outer wedge (see text for details). The gray area shows the position of the strong negative Bouguer gravity anomaly produced by the Sylhet Trough. (b) E-W synthetic cross section based on field observations and industrial multichannel seismic data discussed in this paper. The cross section is located as a thick black line in the map. Ages and thicknesses are based on unpublished well records and previously published sedimentological studies (see text for details). OIBW, outer Indo-Burmese Wedge; IIBW, inner Indo-Burmese Wedge.

Here is the Curray (2005) plate tectonic map.


Here is a map from Maurin and Rangin (2009) that shows the regional tectonics at a larger scale. They show how the Burma and Sunda plates are configured, along with the major plate boundary faults and tectonic features (ninetyeast ridge). The plate motion vectors for India vs Sunda (I/S) and India vs Burma (I/B) are shown in the middle of the map. Note the Sunda trench is a subduction zone, and the IBW is also a zone of convergence. There is still some debate about the sense of motion of the plate boundary between these two systems. This map shows it as strike slip, though there is evidence that this region slipped as a subduction zone (not strike-slip) during the 2004 Sumatra-Andaman subduction zone earthquake. I include their figure caption as a blockquote below.

Structural fabric of the Bay of Bengal with its present kinematic setting. Shaded background is the gravity map from Sandwell and Smith [1997]. Fractures and magnetic anomalies in black color are from Desa et al.[2006]. Dashed black lines are inferred oceanic fracture zones which directions are deduced from Desa et al. in the Bay of Bengal and from the gravity map east of the 90E Ridge. We have flagged particularly the 90E and the 85E ridges (thick black lines). Gray arrow shows the Indo-Burmese Wedge (indicated as a white and blue hatched area) growth direction discussed in this paper. For kinematics, black arrows show the motion of the India Plate with respect to the Burma Plate and to the Sunda Plate (I/B and I/S, respectively). The Eurasia, Burma, and Sunda plates are represented in green, blue, and red, respectively.

Here is a different cross section that shows how they interpret this plate boundary to have an oblique sense of motion (it is a subduction zone with some strike slip motion). Typically, these different senses of motion would be partitioned into different fault systems (read about forearc sliver faults, like the Sumatra fault. I mention this in my report about the earthquakes in the Andaman Sea from 2015.07.02). This cross section is further to the south than the one on the interpretation map above. I include their figure caption as a blockquote below.

Present cross section based on industrial multichannel seismics and field observations. The seismicity from USGS catalog and Engdahl [2002] is represented as black dots. Focal mechanisms from Global CMT (http://www.globalcmt.org/CMTsearch.html) catalog are also represented.

This figure shows the interpretation from Maurin and Rangin (2009) about how the margin has evolved over the past 10 Ma.


Wang et al. (2014) also have a very detailed map showing historic earthquakes along the major fault systems in this region. They also interpret the plate boundary into different sections, with different ratios of convergence:shear. I include their figure caption as a blockquote below.

Simplified neotectonic map of the Myanmar region. Black lines encompass the six neotectonic domains that we have defined. Green and Yellow dots show epicenters of the major twentieth century earthquakes (source: Engdahl and Villasenor [2002]). Green and yellow beach balls are focal mechanisms of significant modern earthquakes (source: GCMT database since 1976). Pink arrows show the relative plate motion between the Indian and Burma plates modified from several plate motion models [Kreemer et al., 2003a; Socquet et al., 2006; DeMets et al., 2010]. The major faults west of the eastern Himalayan syntax are adapted from Leloup et al. [1995] and Tapponnier et al. [2001]. Yellow triangle shows the uncertainty of Indian-Burma plate-motion direction.

Here is a map from Wang et al. (2014) that shows even more details about the faulting in the IBW. Today’s fault occurred nearby the CMf label. I include their figure caption as a blockquote below. Wang et al. (2014) found evidence for active faulting in the form of shutter ridges and an offset alluvial fan. Shutter ridges are mountain ridges that get offset during a strike-slip earthquake and look like window shutters. This geologic evidence is consistent with the moment tensor from today’s earthquake. There is a cross section (C-C’) that is plotted at about 22 degrees North (we can compare this with the Maurin and Rangin (2009) cross section if we like).

Figure 6. (a) Active faults and anticlines of the Dhaka domain superimposed on SRTM topography. Most of the active anticlines lie within 120 km of the deformation front. Red lines are structures that we interpret to be active. Black lines are structures that we consider to be inactive. CT = Comilla Tract. White boxes contain the dates and magnitudes of earthquakes mentioned in the text. CMf = Churachandpur-Mao fault; SM = St. Martin’s island antilcline; Da = Dakshin Nila anticline; M= Maheshkhali anticline; J = Jaldi anticline; P = Patiya anticline; Si = Sitakund anticline; SW= Sandwip anticline; L = Lalmai anticline; H = Habiganj anticline; R = Rashidpur anticline; F = Fenchunganj anticline; Ha = Hararganj anticline; Pa = Patharia anticline. (b) Profile from SRTM topography of Sandwip Island.

Here is the Wang et al. (2014) cross section. I include their figure caption as a blockquote below.

Schematic cross sections through two domains of the northern Sunda megathrust show the geometry of the megathrust and hanging wall structures. Symbols as in Figure 18. (a) The megathrust along the Dhaka domain dips very shallowly and has secondary active thrust faults within 120 km of the deformation front. See Figures 2 and 6 for profile location.

Early reports show that four people have been killed. AP report.
Here is a cross section that shows seismicity for this region. The earthquakes are plotted as focal mechanisms. This comes from Jacha Polet, Professor of Geophysics at Cal Poly Pomona.


Here is a map showing the seismicity and focal mechanisms, also from Jacha Polet.

Earthquake Report: 2015 Summary M GT 7

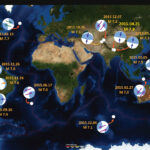
Here I summarize the global seismicity for 2015. I limit this summary to earthquakes with magnitude greater than or equal to M 7.0. I reported on all but one of these earthquakes.

    I include summaries of my earthquake reports in sorted into three categories. One may also search for earthquakes that may not have made it into these summary pages (use the search tool).

  • Magnitude
  • Region
  • Year

Annual Summary Poster

Here is the map where I show the epicenters as white circles. I also plot the USGS moment tensors for each earthquake, with arrows showing the sense of motion for each earthquake.
I placed a moment tensor / focal mechanism legend in the lower left corner of the map. There is more material from the USGS web sites about moment tensors and focal mechanisms (the beach ball symbols). Both moment tensors and focal mechanisms are solutions to seismologic data that reveal two possible interpretations for fault orientation and sense of motion. One must use other information, like the regional tectonics, to interpret which of the two possibilities is more likely.
In some cases, I am able to interpret the sense of motion for strike-slip earthquakes. In other cases, I do not know enough to be able to make this interpretation (so I plot both solutions).

  • 2015.07.18 Santa Cruz Islands


  • 2015.07.27 New Guinea

  • 2015.07.27 New Guinea update #1 updated interpretation
  • 2015.07.27 New Guinea update #2 animations and seismic records

  • Compilation Map from here

  • 2015.09.16 Illapel, Chile

  • 2015.09.16 Illapel, Chile update #1 new maps and tsunami data
  • 2015.09.16 Illapel, Chile update #2 tsunami observations
  • 2015.09.16 Illapel, Chile update #3 more tsunami observations
  • 2015.09.16 Illapel, Chile update #4 historic tsunami comparisons
  • 2015.09.16 Illapel, Chile update #5
    • First Map

    • Second Map

    • Third Map (made in November 2015 following a M 6.8 earthquake). Here is the first report and the second report for that M 6.8 earthquake.

    • Regional Historic Earthquake Comparison Map #1

    • Large Scale Historic Earthquake Comparison Map

    • Regional Historic Earthquake Comparison Map #2 (from here)

    • Historic Tsunami Comparisons
      • Here are the NOAA Center for Tsunami Research websites for the three tsunamis plotted in the map below, plus the one from 2015.09.16 not shown on the map below.

      • 1960.05.22 M 9.5 (There is no page for the 1960 earthquake, so this map is located on the 2010 page.)/li>
      • 2010.02.27 M 8.8
      • 2014.04.01 M 8.2
      • 2015.09.16 M 8.3

      Here is the map. These three maps use the same color scale. There is not yet a map with this scale for the 2015 tsunami, so we cannot yet make the comparison.


      Here is an animation of these three tsunami from the US NWS Pacific Tsunami Warning Center (PTWC). This is the YouTube link.

  • 2015.10.20 Vanuatu


  • 2015.10.26 Afghanistan

  • 2015.10.26 Afghanistan update #1
  • Global Map

  • Local Map

  • 2015.11.18 Solomon Islands


  • 2015.11.24 Peru

  • 2015.11.24 Peru update #1

    • Updated Map

  • 2015.11.24 Argentina/Brazil
  • 2015.12.04 Southeast Indian Ridge


  • 2015.12.07 Tajikistan


    • References:

    • See Earthquake Reports for the references in the maps from those individual earthquakes.

    Earthquake Report: San Bernardino (Devore)!

    A couple days ago, I was on the road and did not yet have my laptop. Therefore I am reporting about this earthquake a few days afterwards…
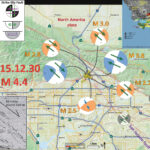
    There has been a swarm of seismic activity in the San Bernardino area. I actually drove along Lone Pine Canyon Road on my way to visit my family for the holidays. The San Andreas fault rips through (forms) the canyon through which this road traverses. Once on the 15, I drove within a few hundred meters of the epicenter of the largest magnitude earthquake from this series, a M 4.4 earthquake. Below I list the USGS web sites for the earthquakes of largest magnitude.

    Below is a map that shows the epicenters for earthquakes from the past week. I also place moment tensors (in blue) and focal mechanisms (orange) for the largest earthquakes (listed above). I also include a few inset maps. The lower left map is from Grant and Rockwell (2002) and shows how the Pacific-North America relative plate motion of 50 mm/yr is distributed across various fault systems. The San Andreas fault accommodates ~22 mm/yr and the San Jacinto fault accommodates ~12 mm/yr. The map in the upper right corner is from the Southern California Earthquake Center and shows the geometrical relations between the various major crustal faults in southern California.
    I placed a moment tensor / focal mechanism legend in the upper left corner of the map. There is more material from the USGS web sites about moment tensors and focal mechanisms (the beach ball symbols). Both moment tensors and focal mechanisms are solutions to seismologic data that reveal two possible interpretations for fault orientation and sense of motion. One must use other information, like the regional tectonics, to interpret which of the two possibilities is more likely.
    Presuming that these earthquakes are occurring on a fault synthetic to the San Jacinto fault, I interpret these earthquakes to have NW striking right-lateral strike-slip fault plane solutions. There is one earthquake that shows a compressional solution.


    In March 2014 there was a M 5.1 earthquake to the southwest of this swarm, near La Habra. I posted earthquake reports on 2014.03.28 and 2014.03.29.
    Here is an interactive map from the LA Times that shows the historic earthquakes in LA.


    Here is the Grant and Rockwell (2002) map alone. I include the caption below as a blockquote.

    Faults are annotated with geologically measured slip rates where available. Major faults include the San Andreas Fault and zone (SAF and SAFZ), San Jacinto Fault zone (SJFZ), Elsinore Fault zone (EFZ), Whittier Fault (WF), Palos Verdes Fault (PVF), Newport-Inglewood Fault Zone (NIFZ), Rose Canyon Fault (RCF), Agua Blanca Fault zone (ABFZ), San Miguel Fault zone (SMFZ), Imperial Fault (IF), Cerro Prieto (CPF), and Laguna Salada Fault (LSF). Offshore faults include the Coronado Bank Fault zone (CBFZ), San Diego Trough Fault (SDTF), San Clemente Fault zone (SCFZ), Santa Cruz Island Fault (SCIF), and Santa Rosa Island Fault (SRIF). The San Gabriel Fault (SGF), San Cayetano Fault (SCF), Oak Ridge Fault (ORF), and Santa Ynez Fault (SYF) are located in the Transverse Ranges.

    Here is that SCEC map alone. I include the caption below as a blockquote.

    SCEC Community Fault Model. This map shows the 3-dimensional structure of major faults beneath Southern California. Vertical faults such as the San Andreas (yellow band from top left to bottom right) are shown as a thin strip. Faults that are at an angle to the surface are shown as wider ribbons of color. The nearest fault to you might be a few miles beneath your home. Areas that seem to have few faults can still experience strong shaking from earthquakes on unmapped faults or from large earthquakes on distant faults.

    Here is an animation from the Southern California Earthquake Center that shows earthquake hypocenters in relation the SCEC fault model. Here is a link to the embedded video below (24 MB mp4).


    Here is a map from Jacha Polet, Professor of Geophysics at Cal Poly Pomona.

      References:

    • Grant, L. B. and Rockwell, T. K., 2002. A Northward-propagting Earthquake Sequence in Coastal Southern California? Seismological Research Letters, Volume 73, Number 4, pp. 461 – 469.

    Earthquake Report: Mendocino fault and Gorda plate!

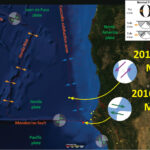
    We just had an earthquake along strike with the Mendocino fault zone. This region is seismically active and there were a number of MF earthquakes in 2015. Here is the USGS web page for today’s M = 4.5 MF earthquake. Also, there was a M 4.9 earthquake within the Gorda plate a week ago. Here is the USGS web page for that M = 4.9 GP earthquake.
    Here is a map that shows the epicenters for these two earthquakes. I also plot the moment tensors for these earthquakes.
    I placed a moment tensor / focal mechanism legend in the upper right corner of the map. There is more material from the USGS web sites about moment tensors and focal mechanisms (the beach ball symbols). Both moment tensors and focal mechanisms are solutions to seismologic data that reveal two possible interpretations for fault orientation and sense of motion. One must use other information, like the regional tectonics, to interpret which of the two possibilities is more likely.
    I include a plate tectonic map modified from Nelson et al. (2004) and Nelson et al. (2004). This map shows the Cascadia subduction zone, along with other major plate boundary faults in the region (Gorda Rise, Mendocino fault, San Andreas fault). The map also shows the interpretation of faults that are part of the internally deforming Gorda plate. These faults within the Gorda plate are responsible for the large damaging earthquakes in 1980, 2005, and 2010 (others also in 2014, and 2015).
    Based on our knowledge of the regional tectonics, I interpret the M 4.5 earthquake to have an E-W striking right-lateral strike-slip solution and the M 4.9 earthquake a NE striking left-lateral strike-slip earthquake. This M 4.5 earthquake appears to have occurred along the Mendocino fault, a right-lateral (dextral) transform plate boundary. This plate boundary connects the Gorda rise and Juan de Fuca ridge spreading centers with their counterparts in the Gulf of California, with the San Andreas strike-slip fault system. Transform plate boundaries are defined that they are strike-slip and that they connect spreading ridges. In this sense of the definition, the Mendocino fault and the San Andreas fault are part of the same system.


    For more on the graphical representation of moment tensors and focal mechnisms, check this IRIS video out:

    Here is a map of the Cascadia subduction zone, modified from Nelson et al. (2004). The Juan de Fuca and Gorda plates subduct norteastwardly beneath the North America plate at rates ranging from 29- to 45-mm/yr. Sites where evidence of past earthquakes (paleoseismology) are denoted by white dots. Where there is also evidence for past CSZ tsunami, there are black dots. These paleoseismology sites are labeled (e.g. Humboldt Bay). Some submarine paleoseismology core sites are also shown as grey dots. The two main spreading ridges are not labeled, but the northern one is the Juan de Fuca ridge (where oceanic crust is formed for the Juan de Fuca plate) and the southern one is the Gorda rise (where the oceanic crust is formed for the Gorda plate).

      There are several sources of seismicity in northern California, The Cascadia subduction zone, the Gorda plate, the Mendocino fault, the San Andreas fault, the Blanco fracture zone, and within the North America plate. Below are some pages that discuss earthquakes with these different sources.

    • 2015.01.28 M 5.7 Mendocino fault
    • 2014.03.10 M 6.8 Gorda plate
    • 2015.05.26 M 4.3 Gorda plate
    • 2015.06.10 M 5.9 Blanco fracture zone
    • 2015.04.12 M 4.2 Blanco fracture zone

    Here is a map from Rollins and Stein, showing their interpretations of different historic earthquakes in the region. This was published in response to the January 2010 Gorda plate earthquake. The faults are from Chaytor et al. (2004). The 1980, 1992, 1994, 2005, and 2010 earthquakes are plotted and labeled. I did not mention the 2010 earthquake, but it most likely was just like 1980 and 2005, a left-lateral strike-slip earthquake on a northeast striking fault.


    In this map below, I label a number of other significant earthquakes in this Mendocino triple junction region. Another historic right-lateral earthquake on the Mendocino fault system was in 1994. There was a series of earthquakes possibly along the easternmost section of the Mendocino fault system in late January 2015, here is my post about that earthquake series.


    The Gorda and Juan de Fuca plates subduct beneath the North America plate to form the Cascadia subduction zone fault system. In 1992 there was a swarm of earthquakes with the magnitude Mw 7.2 Mainshock on 4/25. Initially this earthquake was interpreted to have been on the Cascadia subduction zone (CSZ). The moment tensor shows a compressional mechanism. However the two largest aftershocks on 4/26/1992 (Mw 6.5 and Mw 6.7), had strike-slip moment tensors. These two aftershocks align on what may be the eastern extension of the Mendocino fault.
    There have been several series of intra-plate earthquakes in the Gorda plate. Two main shocks that I plot of this type of earthquake are the 1980 (Mw 7.2) and 2005 (Mw 7.2) earthquakes. I place orange lines approximately where the faults are that ruptured in 1980 and 2005. These are also plotted in the Rollins and Stein (2010) figure above. The Gorda plate is being deformed due to compression between the Pacific plate to the south and the Juan de Fuca plate to the north. Due to this north-south compression, the plate is deforming internally so that normal faults that formed at the spreading center (the Gorda Rise) are reactivated as left-lateral strike-slip faults. In 2014, there was another swarm of left-lateral earthquakes in the Gorda plate. I posted some material about the Gorda plate setting on this page.
    There are three types of earthquakes, strike-slip, compressional (reverse or thrust, depending upon the dip of the fault), and extensional (normal). Here is are some animations of these three types of earthquake faults. Many of the earthquakes people are familiar with in the Mendocino triple junction region are either compressional or strike slip. The following three animations are from IRIS.
    Strike Slip:

    Compressional:

    Extensional:

    This figure shows what a transform plate boundary fault is. Looking down from outer space, the crust on either side of the fault moves side-by-side. When one is standing on the ground, on one side of the fault, looking across the fault as it moves… If the crust on the other side of the fault moves to the right, the fault is a “right lateral” strike slip fault. The Mendocino and San Andreas faults are right-lateral (dextral) strike-slip faults.


    Here is an IRIS animation showing a transform plate boundary fault as it relates to spreading ridges.

      References:

    • Chaytor, J.D., Goldfinger, C., Dziak, R.P., and Fox, C.G., 2004. Active deformation of the Gorda plate: Constraining deformation models with new geophysical data: Geology v. 32, p. 353-356.
    • Nelson, A.R., Asquith, A.C., and Grant, W.C., 2004. Great Earthquakes and Tsunamis of the Past 2000 Years at the Salmon River Estuary, Central Oregon Coast, USA: Bulletin of the Seismological Society of America, Vol. 94, No. 4, pp. 1276–1292
    • Rollins, J.C. and Stein, R.S., 2010. Coulomb stress interactions among M ≥ 5.9 earthquakes in the Gorda deformation zone and on the Mendocino Fault Zone, Cascadia subduction zone, and northern San Andreas Fault: Journal of Geophysical Research, v. 115, B12306, doi:10.1029/2009JB007117, 2010.