While we were all excited about the local Gorda earthquake, there was an another interesting M 6.4 strike slip earthquake in the region of a recent series of earthquakes in the Scotia Sea. Sometimes earthquakes change the local stress field in the region of the earthquake and this may increase or decrease the stress of nearby faults. This “stress triggering” is short lived as the effects get spread out over time. The November 2013 earthquakes are recent enough that they may be blamed for triggering this M 6.4 earthquake, but that is pure speculation on my part. These fault systems are connected, but I have not done any modeling to determine if this is likely or not. One of the largest unknowns if he pre-earthquake stress on the fault that ruptured during this M 6.4 earthquake.
Please check out the pages I put together for the Scotia Sea earthquakes for more material on the regional tectonics here… There are some ascinating figures showing how this region was formed over the past few millions of years. The M 6.8 and M 7.8 earthquakes occurred along a strike slip fault system that links directly to the fault this M 6.4 earthquake may be located on. The M 7.0 earthquake occurred north of the M 6.8 and M 7.8, on another strike slip plate boundary fault. mmmm Sandwiches.
Here is a regional map showing the epicenter (in red and orange) with the plate boundary faults mapped in different colors.
Here is the Mww moment tensor for this earthquake. This shows the earthquake may be an east-west striking strike-slip earthquake, or a north-south striking strike slip earthquake.
Here is a local map showing the epicenter and the regional plate boundary faults. The largest orange dot is the epicenter for this M6.4 earthquake. There is an east-west green line that is a transform fault (strike-slip) nearest the epicenter. There are some north-south oriented faults (some magenta and some green). These are spreading ridges (extensional). Based on the tectonics here, I would interpret the moment tensor plotted above as a left-lateral strike slip earthquake.
Here is a regional map showing the modeled shaking intensity for this earthquake.
Here is the local map version of the shaking intensity map.
Here is a regional map showing the epicenter, along with a series of historic earthquake epicenters plotted as grey circles.
Here is the local map version of the epicentral map that includes the historic earthquakes.
Here are some maps i have put together that show the accumulated 
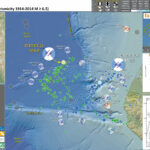
aftershocks from the M 6.8 Gorda plate earthquake on Sunday night. There was one M 3.3 earthquake less than 30 minutes before the main shock. I draw the general location for possible earthquake faults related to the earthquakes from the last couple of days.
The faults I have drawn are located in a general manner and more detailed seismological analyses would need to be conducted in order to further justify my general interpretations. The lack of aftershocks along the possible northwest striking main shock fault is strong evidence that the main shock was along a northeast striking fault. I present my reasoning below. Please look at my first page about this earthquake swarm for a couple of models of the local tectonics in this region.
Here is a local map showing the earthquake epicenters. The moment tensor is shown for the main shock (the M 6.8 earthquake). The main shock epicenter is designated by a red circle.
Here I have placed a red line that is one possible general location for the earthquake fault that ruptured during the main shock. This possible fault aligns nicely with some of the aftershocks (which supports that the main shock was likely a northeast striking strike-slip fault). The strike of a fault is the compass orientation of the line that is formed by the intersection of the fault plane and the surface of the Earth.
Here is a map where I have placed a second alternative possible fault for the mainshock. The strike of this fault is aligned with the second possible fault orientation based on the moment tensor. We can observe there are not many aftershocks that align with the orientation of this possible fault. This observation supports the hypothesis that the green fault is likely NOT the orientation of the fault for the main shock (the M 6.8 earthquake).
Here is a map where I have placed a blue line oriented along some aftershock epicenters. These earthquakes are not really aftershocks since they are on different faults. Some people still call them aftershocks (no biggie), while others might call them triggered earthquakes. This blue line possible fault is parallel to the main shock fault.
There are many historic examples of large earthquakes triggering other earthquakes on faults with antithetic orientations (not parallel). For this map, I have placed two possible antithetic faults (in green) that triggered earthquakes may be located on. Some aftershocks align with these possible fault orientations.
Here is the same map with just the recent epicenters (like the first map), along with select historic earthquakes fed from the USGS.
Carrie from KMUD news interviewed me for the local news broadcast on Monday 3/10/14 and rebroadcast the following morning.
KMUD archives their local news online for one year. Here is a recording of the KMUD local news. My interview is in the first 10 minutes (5 MB mp3 file)
Here are some photos from a landslide possibly triggered by the M 6.9 earthquake. It would be difficult to determine if this was caused by the rainfall or by the earthquake. Given that there were only a few landslides across the landscape, it is more likely these were caused by increased pore pressure due to the rain, rather than triggered failure from the earthquake. If the earthquake ground shaking were responsible, we might expect many more landslides across the entire landscape.
These photos were taken by Eric Johnston from KMUD. You can get a hold of eric here.
Here are some updated maps for this morning. There have been quite a few aftershocks. There are reports of landslides along the bluffs between Redway and Garberville.
Here is a map that just shows these 22 earthquakes:
Here is a map that shows these 22 earthquakes, plus major historic earthquakes:
Here is the list of the M 3.3 foreshock, M 6.9 mainshock, and 20 aftershocks in this region:
3.6
64km WSW of Ferndale, California
2014-03-10 08:16:29 UTC-07:0022.8 km
2.9
71km W of Ferndale, California
2014-03-10 08:00:15 UTC-07:000.6 km
3.0
66km W of Ferndale, California
2014-03-10 07:42:56 UTC-07:001.3 km
3.3
87km W of Ferndale, California
2014-03-10 06:58:39 UTC-07:005.0 km
2.9
65km W of Ferndale, California
2014-03-10 05:41:04 UTC-07:0024.2 km
3.7
89km W of Ferndale, California
2014-03-10 03:46:20 UTC-07:002.3 km
4.5
85km WNW of Ferndale, California
2014-03-10 03:28:16 UTC-07:005.1 km
3.4
88km WNW of Ferndale, California
2014-03-10 03:18:04 UTC-07:005.0 km
3.6
88km WNW of Ferndale, California
2014-03-10 02:54:22 UTC-07:002.6 km
3.5
96km WNW of Ferndale, California
2014-03-10 02:42:39 UTC-07:005.0 km
3.2
73km W of Ferndale, California
2014-03-10 00:49:00 UTC-07:005.1 km
2.7
47km W of Ferndale, California
2014-03-09 23:58:47 UTC-07:004.8 km
2.8
53km WNW of Ferndale, California
2014-03-09 23:39:09 UTC-07:000.4 km
3.3
81km W of Ferndale, California
2014-03-09 23:21:17 UTC-07:005.1 km
2.9
107km WNW of Ferndale, California
2014-03-09 23:12:19 UTC-07:0013.2 km
2.9
54km WNW of Ferndale, California
2014-03-09 22:57:30 UTC-07:000.3 km
4.6
76km W of Ferndale, California
2014-03-09 22:51:11 UTC-07:002.5 km
3.4
67km W of Ferndale, California
2014-03-09 22:43:26 UTC-07:000.2 km
3.5
68km W of Ferndale, California
2014-03-09 22:41:49 UTC-07:0022.9 km
4.4
140km W of Ferndale, California
2014-03-09 22:36:33 UTC-07:0010.0 km
6.8
77km WNW of Ferndale, California
2014-03-09 22:18:13 UTC-07:0016.6 km
3.3
83km WNW of Ferndale, California
2014-03-09 22:04:09 UTC-07:005.0 km
Updated map below. See additional more updated information about Gorda plate earthquakes in the Earthquake Report for the 10 January 2010 M 6.5 earthquake here.
That was exciting. I counted over 40 seconds of motion in Manila. This is a wake up call for all of us, including me.
Check back here for updates. I am posting some basic material to begin with. We had another earthquake in this region last year. Here is a page i put together for that earthquake.
Don’t forget to get to the USGS online to fill out the “Did You Feel It?” form. The information provided helps geologists and seismologists learn about the ground shaking response for earthquakes in this region. They also can apply this information elsewhere (in some ways).
The Cascadia subduction zone is formed where the Gorda and Juan de Fuca plates subduct northeastward beneath the North America plate. Here is a figure that Alan Nelson put together. I have updated it with material from Jason Chaytor’s 2004 paper.
This is most likely an earthquake in the underlying Gorda plate. The Gorda is losing the battle between the JdF plate to the north and the Pacific plate to the south, both of which are colder, older, and more dense (basically, they form a vise that is squeezing Gorda so much that it deforms internally). This internal deformation results in the formation of left lateral strike slip faults in the southern GP that form on preexisting faults (originally formed at the Gorda rise, where the Gorda plate crust is created).
Here is a map of the epicenter, about 70 km west of eureka:
This is the moment tensor, which shows it is either a northeast striking left-lateral strike slip earthquake or a southeast striking right lateral strike slip earthquake. Given what we know about the regional tectonics, I would interpret this to be a left lateral earthquake. It plots just southwest of the 1980 M 7.2 Trinidad earthquake. There was a focal mechanism earlier that matched this moment tensor and then a later focal mechanism that was incorrect. I have removed both of them as the moment tensor is a more reliable measure of the sense of motion on the fault.
Here is a map showing historic seismicity. The largest circle to the northeast of the epicenter in orange is the 1980 Trinidad earthquake.
Here is a map from Rollins and Stein (2010) showing the faults and tectonics of the Gorda plate. Today’s M 6.9 is probably somewhere in the right step of the dashed fault labeled “B.”
Here is the seismograph from Jamie Shuttmutt (downloaded from here)
Here is the seismograph from HSU dept. of Geology as taken by Jamie Shuttmutt
Here is the seismograph from the UC Berkeley Jacoby Creek seismometer, posted by Lori Dengler:
Here is a map showing the Modified Mercalli Shaking Intensity for the region. The contours and color over land have the same color scale. Note the increased shaking in the Humboldt Bay region. This is probably the result of the underlying material here (sediments vs bedrock).
Here is the shakemap, with colors designating the Modified Mercalli Shaking Intensity (scale bar in the legend):
This is the map of shaking intensity which changes as more people fill out their “Did You Feel It” (link above):
Here is the map from the Southern California Earthquake Center (SCEC). There are several aftershocks in red. There was a M3.3 foreshock. The aftershocks appear to align with the northeast striking faults in this region of the Gorda plate. These are likely triggered earthquakes on different faults than the mainshock (so may not be considered aftershocks, but triggered seismicity).
Here is a primer for the different types of earthquake faults:
These are the models for tectonic deformation within the Gorda plate as presented by Jason Chaytor in 2004.
Here is the pager information (shows the potential exposure, economic or human, to the ground shaking).
UPDATE 2023.03.09
The Updated Earthquake Report
This earthquake is in a tectonically complicated region of the western United States, the Mendocino triple junction. Here, three plate boundary fault systems meet (the definition of a triple junction): the San Andreas fault from the south, the Cascadia subduction zone from the north, and the Mendocino fault from the west. These plate boundary fault systems all overlap like fingers do when we fold our hands together.
The Cascadia subduction zone is a convergent (moving together) plate boundary where the Gorda and Juan de Fuca plates dive into the Earth beneath the North America plate. The fault formed here is called the megathrust subduction zone fault. Earthquakes on subduction zone faults generate the largest magnitude earthquakes of all fault types and also generate tsunami that can impact the local area and also travel across the ocean to impact places elsewhere. The most recent known Cascadia megathrust subduction zone fault earthquake was in January 1700.
The San Andreas and Mendocino fault systems are strike-slip (plates move side by side) fault systems. Many are familiar with the 1906 San Francisco Earthquake.
While the largest source of annual seismicity are intraplate Gorda plate earthquakes, the two largest contributors to seismic hazards in California are the Cascadia subduction zone (CSZ) and the San Andreas fault (SAF) systems. These sources overlap in the region of the Mendocino triple junction (MTJ) and may interact in ways we are only beginning to understand as evidenced by the 2016 M7.8 Kaikōura earthquake in New Zealand (Clark et al., 2017 Litchfield et al., 2018), which occurred along a similar subduction/transform boundary, and included co-seismic rupture of more than 20 faults.
The M 6.8 earthquake was a left-lateral strike-slip earthquake within the Gorda plate (an intra plate earthquake).
One thing people almost always ask is about whether or not there is a higher chance that there will be a Cascadia subduction zone earthquake. This is currently impossible to tell. However, we can make some estimates of how forces within the Earth might have changed after a given earthquake. There was a Gorda plate earthquake sequence in 2018 that allowed us to consider these changes in the crust to see if the megathrust was brought more close to rupture. Here is the report from that Gorda plate earthquake sequence.
I plot aftershocks and triggered earthquakes from both the 2014 (in green) and the 2010 (in blue) earthquake sequences. Each sequence includes primary rupture on northeast striking strike-slip faults within the Gorda plate. I place dashed lines roughly where these faults are.
I also interpret additional faults that appear to have slipped during these sequences. There is one fault for the 2010 sequence and two faults for the 2014 sequence. Those of you who are familiar with the 2012 Wharton Basin earthquakes would have these examples in your mind when you look at the interpretive poster below.
I never noticed these before but after working on similar seismicity trends following the 1992 Cape Mendocino and 2022 False Cape (Ferndale) earthquake sequences. We are learning more and more with each earthquake sequence. Stay tuned for more on these fault interactions.
Below is my interpretive poster for this earthquake
I plot the seismicity from the month following the earthquake, with diameter representing magnitude (see legend). I include earthquake epicenters from 1914-2014 with magnitudes M ≥ 6.5 in one version. I also include the 2010 earthquake sequence in blue.
I plot the USGS fault plane solutions (moment tensors in blue and focal mechanisms in orange), possibly in addition to some relevant historic earthquakes.
A review of the basic base map variations and data that I use for the interpretive posters can be found on the Earthquake Reports page. I have improved these posters over time and some of this background information applies to the older posters.
I include some inset figures. Some of the same figures are located in different places on the larger scale map below.
In the upper left corner is a map showing the tectonic plate boundaries and a century of seismicity.
In the upper right corner is a map that displays a variety of earthquake intensity information. I plot the USGS modeled intensity, the USGS Did You Feel It? observations of intensity, and the shaking magnitude using the Peak Ground Acceleration scale in units of g (gravitational acceleration). I describe this map later in the report.
Below the intensity map is a plot that shows how earthquake intensity diminishes with distance from the earthquake. The green and orange lines are the USGS modeled relations between intensity and distance. The blue and orange circles are Did You Feel It? reports of intensity made by real people. This plot and the above map are based on the same data.
In the lower right corner I include a map from Chaytor et al. (2004) that shows the faulting within the Gorda plate. Read more about their interpretations below.
Here is the map with 1 month’s seismicity plotted.
Some Relevant Discussion and Figures
Here is a map of the Cascadia subduction zone, modified from Nelson et al. (2006). The Juan de Fuca and Gorda plates subduct norteastwardly beneath the North America plate at rates ranging from 29- to 45-mm/yr. Sites where evidence of past earthquakes (paleoseismology) are denoted by white dots. Where there is also evidence for past CSZ tsunami, there are black dots. These paleoseismology sites are labeled (e.g. Humboldt Bay). Some submarine paleoseismology core sites are also shown as grey dots. The two main spreading ridges are not labeled, but the northern one is the Juan de Fuca ridge (where oceanic crust is formed for the Juan de Fuca plate) and the southern one is the Gorda rise (where the oceanic crust is formed for the Gorda plate).
Here is a version of the CSZ cross section alone (Plafker, 1972). This shows two parts of the earthquake cycle: the interseismic part (between earthquakes) and the coseismic part (during earthquakes). Regions that experience uplift during the interseismic period tend to experience subsidence during the coseismic period.
This poster includes seismicity from the past ~5 decades, for temblors M > 3.0. I also include the map and cross section as explained above. On the left is a map that shows the possible shaking intensity from a future CSZ earthquake.
I have compiled some literature about the CSZ earthquake and tsunami. Here is a short list that might help us learn about what is contained within the core that I collected.
This figure shows how a subduction zone deforms between (interseismic) and during (coseismic) earthquakes. We also can see how a subduction zone generates a tsunami. Atwater et al., 2005.
Here is an animation produced by the folks at Cal Tech following the 2004 Sumatra-Andaman subduction zone earthquake. I have several posts about that earthquake here and here. One may learn more about this animation, as well as download this animation here.
The Gorda and Juan de Fuca plates subduct beneath the North America plate to form the Cascadia subduction zone fault system. In 1992 there was a swarm of earthquakes with the magnitude Mw 7.2 Mainshock on 4/25. Initially this earthquake was interpreted to have been on the Cascadia subduction zone (CSZ). The moment tensor shows a compressional mechanism. However the two largest aftershocks on 4/26/1992 (Mw 6.5 and Mw 6.7), had strike-slip moment tensors. In my mind, these two aftershocks aligned on what may be the eastern extension of the Mendocino fault. However, looking at their locations, my mind was incorrect. These two earthquakes were not aftershocks, but were either left-lateral or right-lateral strike-slip Gorda plate earthquakes triggered by the M 7.1 thrust event.
These two quakes appear to be aligned with the two northwest trends in seismicity and the 18 March 2020 M 5.2. The orientation of the mechanisms are not as perfectly well aligned, but there are lots of reasons for this (perhaps the faults were formed in a slightly different orientation, but have rotated slightly).
There have been several series of intra-plate earthquakes in the Gorda plate. Two main shocks that I plot of this type of earthquake are the 1980 (Mw 7.2) and 2005 (Mw 7.2) earthquakes. I place orange lines approximately where the faults are that ruptured in 1980 and 2005. These are also plotted in the Rollins and Stein (2010) figure above. The Gorda plate is being deformed due to compression between the Pacific plate to the south and the Juan de Fuca plate to the north. Due to this north-south compression, the plate is deforming internally so that normal faults that formed at the spreading center (the Gorda Rise) are reactivated as left-lateral strike-slip faults. In 2014, there was another swarm of left-lateral earthquakes in the Gorda plate. I posted some material about the Gorda plate setting on this page.
This is the map used in the animation below. Earthquake epicenters are plotted (some with USGS moment tensors) for this region from 1917-2017 with M ≥ 6.5. I labeled the plates and shaded their general location in different colors.
I include some inset maps.
In the upper right corner is a map of the Cascadia subduction zone (Chaytor et al., 2004; Nelson et al., 2004).
In the upper left corner is a map from Rollins and Stein (2010). They plot epicenters and fault lines involved in earthquakes between 1976 and 2010.
Here is a map from Rollins and Stein, showing their interpretations of different historic earthquakes in the region. This was published in response to the Januray 2010 Gorda plate earthquake. The faults are from Chaytor et al. (2004).
Tectonic configuration of the Gorda deformation zone and locations and source models for 1976–2010 M ≥ 5.9 earthquakes. Letters designate chronological order of earthquakes (Table 1 and Appendix A). Plate motion vectors relative to the Pacific Plate (gray arrows in main diagram) are from Wilson [1989], with Cande and Kent’s [1995] timescale correction.
Here is a large scale map of the 1994 earthquake swarm. The mainshock epicenter is a black star and epicenters are denoted as white circles.
Here is a plot of focal mechanisms from the Dengler et al. (1995) paper in California Geology.
In this map below, I label a number of other significant earthquakes in this Mendocino triple junction region. Another historic right-lateral earthquake on the Mendocino fault system was in 1994. There was a series of earthquakes possibly along the easternmost section of the Mendocino fault system in late January 2015, here is my post about that earthquake series.
Here is a map from Chaytor et al. (2004) that shows some details of the faulting in the region. The moment tensor (at the moment i write this) shows a north-south striking fault with a reverse or thrust faulting mechanism. While this region of faulting is dominated by strike slip faults (and most all prior earthquake moment tensors showed strike slip earthquakes), when strike slip faults bend, they can create compression (transpression) and extension (transtension). This transpressive or transtentional deformation may produce thrust/reverse earthquakes or normal fault earthquakes, respectively. The transverse ranges north of Los Angeles are an example of uplift/transpression due to the bend in the San Andreas fault in that region.
A: Mapped faults and fault-related ridges within Gorda plate based on basement structure and surface morphology, overlain on bathymetric contours (gray lines—250 m interval). Approximate boundaries of three structural segments are also shown. Black arrows indicated approximate location of possible northwest- trending large-scale folds. B, C: uninterpreted and interpreted enlargements of center of plate showing location of interpreted second-generation strike-slip faults and features that they appear to offset. OSC—overlapping spreading center.
These are the models for tectonic deformation within the Gorda plate as presented by Jason Chaytor in 2004.
Models of brittle deformation for Gorda plate overlain on magnetic anomalies modified from Raff and Mason (1961). Models A–F were proposed prior to collection and analysis of full-plate multibeam data. Deformation model of Gulick et al. (2001) is included in model A. Model G represents modification of Stoddard’s (1987) flexural-slip model proposed in this paper.
Mendocino triple junction video
Cascadia subduction zone
General Overview
1700.09.26 M 9.0 Cascadia’s 315th Anniversary 2015.01.26
1700.09.26 M 9.0 Cascadia’s 316th Anniversary 2016.01.26 updated in 2017 and 2018
Frisch, W., Meschede, M., Blakey, R., 2011. Plate Tectonics, Springer-Verlag, London, 213 pp.
Hayes, G., 2018, Slab2 – A Comprehensive Subduction Zone Geometry Model: U.S. Geological Survey data release, https://doi.org/10.5066/F7PV6JNV.
Holt, W. E., C. Kreemer, A. J. Haines, L. Estey, C. Meertens, G. Blewitt, and D. Lavallee (2005), Project helps constrain continental dynamics and seismic hazards, Eos Trans. AGU, 86(41), 383–387, , https://doi.org/10.1029/2005EO410002. /li>
Jessee, M.A.N., Hamburger, M. W., Allstadt, K., Wald, D. J., Robeson, S. M., Tanyas, H., et al. (2018). A global empirical model for near-real-time assessment of seismically induced landslides. Journal of Geophysical Research: Earth Surface, 123, 1835–1859. https://doi.org/10.1029/2017JF004494
Kreemer, C., J. Haines, W. Holt, G. Blewitt, and D. Lavallee (2000), On the determination of a global strain rate model, Geophys. J. Int., 52(10), 765–770.
Kreemer, C., W. E. Holt, and A. J. Haines (2003), An integrated global model of present-day plate motions and plate boundary deformation, Geophys. J. Int., 154(1), 8–34, , https://doi.org/10.1046/j.1365-246X.2003.01917.x.
Kreemer, C., G. Blewitt, E.C. Klein, 2014. A geodetic plate motion and Global Strain Rate Model in Geochemistry, Geophysics, Geosystems, v. 15, p. 3849-3889, https://doi.org/10.1002/2014GC005407.
Pagani, M., J. Garcia-Pelaez, R. Gee, K. Johnson, V. Poggi, R. Styron, G. Weatherill, M. Simionato, D. Viganò, L. Danciu, D. Monelli (2018). Global Earthquake Model (GEM) Seismic Hazard Map (version 2018.1 – December 2018), DOI: 10.13117/GEM-GLOBAL-SEISMIC-HAZARD-MAP-2018.1
Silva, V ., D Amo-Oduro, A Calderon, J Dabbeek, V Despotaki, L Martins, A Rao, M Simionato, D Viganò, C Yepes, A Acevedo, N Horspool, H Crowley, K Jaiswal, M Journeay, M Pittore, 2018. Global Earthquake Model (GEM) Seismic Risk Map (version 2018.1). https://doi.org/10.13117/GEM-GLOBAL-SEISMIC-RISK-MAP-2018.1
Zhu, J., Baise, L. G., Thompson, E. M., 2017, An Updated Geospatial Liquefaction Model for Global Application, Bulletin of the Seismological Society of America, 107, p 1365-1385, https://doi.org/0.1785/0120160198
Chaytor, J.D., Goldfinger, C., Dziak, R.P., and Fox, C.G., 2004. Active deformation of the Gorda plate: Constraining deformation models with new geophysical data: Geology v. 32, p. 353-356.
Guo, H., McGuire, J., and Zhang, H., 2021. Correlation of porosity variations and rheological transitions on the southern Cascadia megathrust in Nature Geoscience, https://doi.org/10.1038/s41561-021-00740-1
Irwin, W.P., 1990. Quaternary deformation, in Wallace, R.E. (ed.), 1990, The San Andreas Fault system, California: U.S. Geological Survey Professional Paper 1515, online at: http://pubs.usgs.gov/pp/1990/1515/
McCrory, P.A.,. Blair, J.L., Waldhauser, F., kand Oppenheimer, D.H., 2012. Juan de Fuca slab geometry and its relation to Wadati-Benioff zone seismicity in JGR, v. 117, B09306, doi:10.1029/2012JB009407.
McLaughlin, R.J., Ellen, S.D., Blake, M.C. Jr., Jayko, A.S., Irwin, W.P., Aalto, F.R., Carver, G.A., and Clarke, S.H. Jr., 2000. Geology of the Cape Mendocino, Eureka, Garberville, and Southwestern Part of the Hayfork 30 x 60 Minute Quadrangles and Adjacent Offshore Area, Northern California, USGS Miscellaneous Field Studies Map MF-2336, http://pubs.usgs.gov/mf/2000/2336/
McLaughlin, R.J., Sarna-Wojcicki, A.M., Wagner, D.L., Fleck, R.J., Langenheim, V.E., Jachens, R.C., Clahan, K., and Allen, J.R., 2012. Evolution of the Rodgers Creek–Maacama right-lateral fault system and associated basins east of the northward-migrating Mendocino Triple Junction, northern California in Geosphere, v. 8, no. 2., p. 342-373.
Nelson, A.R., Asquith, A.C., and Grant, W.C., 2004. Great Earthquakes and Tsunamis of the Past 2000 Years at the Salmon River Estuary, Central Oregon Coast, USA: Bulletin of the Seismological Society of America, Vol. 94, No. 4, pp. 1276–1292
Rollins, J.C. and Stein, R.S., 2010. Coulomb stress interactions among M ≥ 5.9 earthquakes in the Gorda deformation zone and on the Mendocino Fault Zone, Cascadia subduction zone, and northern San Andreas Fault: Journal of Geophysical Research, v. 115, B12306, doi:10.1029/2009JB007117, 2010.
Stoffer, P.W., 2006, Where’s the San Andreas Fault? A guidebook to tracing the fault on public lands in the San Francisco Bay region: U.S. Geological Survey General Interest Publication 16, 123 p., online at http://pubs.usgs.gov/gip/2006/16/
Wallace, Robert E., ed., 1990, The San Andreas fault system, California: U.S. Geological Survey Professional Paper 1515, 283 p. [http://pubs.usgs.gov/pp/1988/1434/].
Wells, D.L., and Coopersmith, K.J., 1994. New empirical relationships among magnitude, rupture length, rupture width, rupture area, and surface displacement in BSSA, v. 84, no. 4, p. 974-1002
Wells, R.E., Blakely, R.J., Wech, A.G., McCrory, P.A., Michael, A., 2017. Cascadia subduction tremor muted by crustal faults in Geology, v. 45, no. 6, p. 515–518, https://doi.org/10.1130/G38835.1
Williams, T.B. and McPherson, R.C., (2006). Gorda Plate Deformation Contributes to Shortening Between the Klamath Block and the On-land Portion of the Accretionary Prism to the S. Cascadia Subduction Zone. In Hemphill-Haley, M., McPherson, R., Patton, J. R., Stallman, J., Leroy, T.H., Sutherland, D., and Williams, T.B., eds. (2006) Pacific Cell Friends of the Pleistocene Field Trip Guidebook, The Triangle of Doom: Signatures of Quaternary Crustal Deformation in the Mendocino Deformation Zone (MDZ) Arcata, CA.