Well well.
The faults in southern CA are large in number. Following Danielle’s lead, I looked into the tectonics of the region. The Shaw et al. (2002) paper has a really good summary of the tectonics of this region of southern CA. I posted some of his figures on my first page for this earthquake swarm.
Here is a map from Shaw et al. (2002) that shows the blind thrust faults that almost daylight just south of the Whittier fault.
Here, Danielle placed a georeferenced version of that map into google earth. She has the mainshock and some aftershocks plotted.
Along with her husband Chris, also a geologist at Earth Consultants International, have been discussing which fault this earthquake swarm ruptured. At first they thought it was on the Puente Hills Thrust fault, specifically the Coyote Hills segment. Now that we have this map rubbersheeted, we can compare the hypocentral depth of the M 5.1 earthquake (7.5 km) and compare with the geometry of the faults based on seismic profiles (the Shaw 2002 paper and Leon et al, 2007 paper). The depth of the PHT fault at the epicentral location of the M 5.1 earthquake shows a depth ~4-5 km, shallower than the M 5.1 earthquake. And, as Chris and Danielle point out, the M 5.1 hypocenter is not deep enough to be on the Elysian fault (which is shown on the following map from Shaw). A shared hypothesis from the Madugos (i just love how they combined their prior last names, madden and verdugo, to create their new shared last name), “Probably a conjugate accommodational structure in the hanging wall of the EPT.”
More updates.
The Southern California Seismic Network has put together a web site for this earthquake swarm.
Here is a summary of the potential of a larger aftershock, or triggered earthquake on a different fault, from the LA Times. It seems to me like this swarm may have retarded the earthquake likelihood of an earthquake on the Whittier fault, but possibly imparts stress on adjacent thrust faults in the region.
Here is a map the USGS put together to illustrate the historic earthquakes in the LA region. One may order a hard copy for 12 bucks.
Here is a map that shows the Modified Mercalli Intensity shaking modeled for this earthquake, shown in contours.
This map shows the ground motions in Peak Ground Acceleration (in % g, which stands for gravity, 9.8 m/s^2)
Here is an interactive map from the LA Times that shows the historic earthquakes in LA.
Here is a video from the Southern California Earthquake Center that shows the geometry of faults in the region of the Puente Hills Thrust fault. The animation ends with the PHT fault in purple. This is a 58 MB mov file.
Monthly Archives: March 2014
M 5.1 earthquake in La Habra
All Right!
A good sized shaker (nice and small) just happened near La Habra in southern CA. Here is the USGS web site for this earthquake. Here is some general information about earthquakes in southern CA. This is a really shallow earthquake at 1.9 km!
Based on reports from my family that live a few miles from the epicenter, they are shaken but not stirred.
Here is an early moment tensor. It looks like this is an oblique strike-slip/reverse earthquake. It probably shook pretty strongly there.
Here is a shaking intensity map based on a model of the earth and the magnitude of the earthquake. The colors represent shaking intensity using the Modified Mercalli Shaking Intensity Scale.
Here is a map showing some aftershocks. It appears that this may be a rupture on a northeast striking fault. A combination of a strike-slip earthquake and a thrust (compressional) earthquake. The hills north of Brea and La Habra are formed along the Whittier fault in the Elsinore fault zone, which is a sister fault system to the San Andreas fault system (a plate boundary transform fault system). If you click on the map, it will open an updated map that shows the main shock epicenter actually did change.
Based on Danielle Verdugo Madugo, Egill Hauksson thinks it is may be on the Puente Hills fault. Here is a map from Tucker and Dolan (2001). The Puente Hills blind thrust fault appears to be responsible for the uplift associated with the Coyote Hills east of La Mirada. The Puente Hills fault ruptured in 1987 with a M 6.0 earthquake. Here is a great paper by Leon et al. 2007 that describes the tectonics of the Puente Hills fault as it relates to seismic hazard.
Here is map and cross section showing the location of the 1987 M 6.0 “Whittier Narrows” earthquake. (A) Map showing Brea and downtown LA as they relate to the epicenter. The lighter shaded polygons are their estimates of the location of thrust fault planes as they dip to the north. The fault tips are the thick black lines. (B) The cross sectional view of the crust in this region. The cross section locations are located in (A) by the blue lines from B-B1-B2. There is a break in the cross section at B1.
The 1987 Whittier Narrows earthquake (i remember that one) is located at a depth of ~13 km. Tonight’s earthquake is also shallow, at about 8 km as i post this. The Whittier fault is marked by the “WF.” The 1987 EQ was north of the WF. Tonight’s earthquake would be up-dip of the 1987 earthquake, and further east. There are lots of faults in this region, so it is pretty complicated. Here is a map from Shaw et al. (2002) showing the different segments of the Puente Hills fault system.
Here is another cross section, from the Shaw paper, that shows where Santa Fe Springs and Montebello are. This cross section is west of today’s M 5.1 earthquake.
These are the seismic data Shaw et al. (2002) used to interpret their cross section above.
Based on the USGS web page:
“There have been 23 aftershocks as of 10:00PM on March 28, the largest of which was a M3.6 at 9:30PM, and was felt locally near the epicenter. The aftershock sequence may continue for several days to weeks, but will likely decay in frequency and magnitude as time goes by.
Here is a cool video from SCEC
The maximum observed instrumental intensity was VII, recorded in the LA Habra and Brea areas, although the ShakeMap shows a wide area of maximum intensity of VI. The maximum reported intensity for the Did You Feel It? map was reported at VI in the epicentral area.”
Here is an early “Did You Feel It?” map. I will update this later.
Here is a later DYFI map with more results:
Here is a plot showing how the intensity attenuates (is reduced) with distance from the epicenter. Distance in km is on the horizontal axis. Shaking intensity is on the vertical axis. The lines are the models (what the shaking intensity map is based on, above). The dots are the data from people who called in (like all of YOU)
This does a little to explain what the moment tensor represents (though this is a model of the focal mechanism plots, the concept is the same).
Oso, WA landslide 2014/03/22 Historical Animations
Here are a few animations I made based on historical aerial imagery. There are four animations that run the years 1989, 2003, 2005, 2006, 2007, 2009, 2011, and 2013. I used the historic imagery available from google earth. There could be better imagery out there, but this took me 15 minutes to put together.
Here is an over view of the region from the Seattle Times:
Here are my animations (click on a map to watch the video on a new window or click on the link under a map to download the video):
- Overview:
Here is a link if you want to save it to your computer. - Oblique looking from the southeast:
Here is a link if you want to save it to your computer. - Oblique looking from the south:
Here is a link if you want to save it to your computer. - Oblique looking from the south zoomed in to observe the toe of the slide:
One may observe a large slide deposit sediment at the base of the slope of the right bank (away from you) prior to the 2006 image. This entire toe continues to exist through the 2013 image. There is also a fan deposited on top of this slide toe on the left (the west) of these images. The fan becomes apparent in 2007 and obvious in 2009. The sediment source for this fan is the eroding material from the landslide upslope. The fan becomes vegetated in 2011 and 2013. The river does not appear to be eroding at the toe of this slide area, unless it did so during this seasons flood season.
Here is a link if you want to save it to your computer. - Here is a map showing the landslide history of the region. The youngest slides are labeled A, the youngest slides are labeled D. USGS put together this paper that describes their interpretation.
Here is an article on the AGU landslide blog about the slide.
Here are some photos taken on March 24 during an aerial survey conducted by the Washington State Department of Transportation, Washington State Department of Natural Resources, U.S. Geological Survey, and King County Sheriff’s Office. Photo Credit: King County Sheriff’s Office – Air Support Unit. I got these from the USGS.
- Here is the seismograph recorded at site JCW by the University of Washington Pacific Northwest Seismic Network, operated in cooperation with the USGS.
- Here is the yt link for the embedded video below.
Video
Interseismic Fault Coupling: the 2014 March Northern Chile Swarm
Given the paucity of great earthquakes in the region of the recent earthquake swarm along the subduction zone offshore or northern Chile, we are curious to know if there will be a large magnitude earthquake there. The seismologic record of great earthquakes extends back only a century, but there are a few places along the west coast of South America that have not ruptured. Here is an older map by Matt Pritchard (Cornell) that has some historic earthquakes plotted.
If we look at this region of northern Chile, some paleoseismic records exist for this part of the subduction zone. One question remains: does this swarm promote or retard the likelihood of a great earthquake? A great earthquake would probably generate a trans Pacific Tsunami. This figure from Chlieh et al. (2011) shows the slip models (earthquake slip in meters) and earthquake slip regions for pre-seimologic (prior to seismometers) earthquakes in grey. The swarm of earthquakes from this March are in the northern region of the 1877 M 8.8 subduction zone earthquake.
Chlieh et al. (2012) calculated the “slip deficit” (the amount of plate motion imparted upon the fault as strain given a plate convergence rate and some amount of time) a series of earthquakes along the west coast of South America. One of the largest unknowns is the state of stress on the fault prior to any modeling.
Chlieh also calculated the slip deficit following the 1877 M 8.8 great subduction zone earthquake in the region of this earthquake swarm.
Chlieh et al., 2011. Interseismic coupling and seismic potential along the Central Andes subduction zone, Journal of Geophysical Research, v. 116, B12405, 21 p.
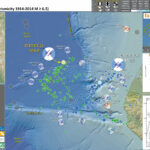
Still kicking off some aftershocks in northern Chile
Here is the latest view of the seismicity associated with this earthquake swarm offshore northern Chile. I first mentioned this since I thought it was an interesting region to get some earthquakes. Read more about that on that first page.
I have updated the map with the latest epicenters, as well as the historic earthquake rupture limits from Matt Pritchard and Loveless et al. (2010) Loveless, J. P., M. E. Pritchard, and N. Kukowski (2010) Testing mechanisms of subduction zone segmentation and seismogenesis with slip distributions from recent Andean earthquakes, Tectonophysics, [in press]. These are rupture lengths from only the past 100 years, so there is some age bias. One can see there is a gap between the 2001 Peru Mw 8.5 earthquake to the north and the 2007 Mw 7.7 earthquake to the south in Chile.
Here is a zoomed out view of the Pritchard and Loveless earthquake history. Earthquake magnitudes are plotted with the year. These represent earthquakes recorded since 1900.
Indian Ocean M 5.4 2014/03/27
Good Morning!
A very coolio M 5.4 earthquake in the northern Indian Ocean between the Ninetyeast Ridge and Sri Lanka.
Here is the USGS webpage for this earthquake.
This is interesting because it is northwest of a swarm of earthquakes from 2012. In 2012, the two largest magnitude strike-slip earthquakes ever recorded occurred in the deep lithosphere west of the 2004/2005 Sumatra-Andaman subduction zone earthquakes. While the structural grain in the crust (as evidenced by fracture zone generated seafloor topography and offsets in magnetic anomalies and gravity anomalies) in this part of the India plate, these earthquakes ruptured west-northwest striking faults.
Here is my first page on the Sumatra outer rise earthquakes. Here is a follow up page, after there were some aftershocks.
Here is the M 5.4, all by its lonesome, in the northern Indian Ocean (the westernmost orange dot). Ignore the magenta line, it is plotting the wharton ridge in the incorrect location, which is not really a plate boundary anyways. Some day the USGS will update this kml file. We can see the recent Andaman Sea Swarm in the upper right corner of this map. The Andaman Sea is a region in the back arc, where there is extension related to spreading ridges.
Here is the same map, but with historic earthquakes plotted in grey circles. I have labeled the largest magnitude earthquakes with some names and magnitudes. I have outlined the epicenters of these larger magnitude earthquakes also.
Here I have placed a red line where some place the location of the faults that ruptured in April 2012.
I am here placing a map that is merely based on wild speculation. The M 5.4 earthquake aligns with the southern fault that ruptured in 2012. There are not many historic earthquakes in this region. Strain accumulated in the India plate in this region has been estimated based on offsets of earthquake faults… but this 5.4 probably did not generate surface rupture. Currently it is listed at 13 km. This is an automatic depth (i think), and may change over time (if someone does more time to estimate the depth).
Finally, here is the “scientific” page for this earthquake. I place this here because one never knows if it will become unavailable online. The earthquake pages for the Mw 8.6 and 8.2 earthquakes no longer exist in the form they were in when those earthquakes occurred.
Not quite finally above…
Here is figure 1 from Dupatel et al., 2012 (The 2012 Sumatra great earthquake sequence), Earth and Planetary Letters v. 351-352, p 247-257. They plot some moment tensors from the two mainshocks some of the larger aftershocks.
Here Duputel et al. (2012), in figure 4, they plot aftershocks in profile to show how the aftershocks are related to the two different main shocks.
This is their coolest figure, where Duputel et al (2012), in figure 9, plot the epicenters with color representing time. They also plot the orientations of the faults that ruptured in this sequence. Note the interesting orientation of the west-northwest striking faults. There are some northeast striking faults, but the mainshocks were probably on the nw striking faults. Here is the Duputel paper.
Andaman Sea Swarm M 6.5
Here is a good sized earthquake swarm in the Andaman Sea. I am a little late posting this, I was otherwise detained.
Here is the USGS webpage for the Mw 6.5 earthquake.
The Andaman Sea is a region of back-arc spreading. The subduction zone is plotted in blue, to the west of these Nicobar Islands. The Nicobar Islands are probably formed by a combination of back thrust and/or strike slip faults. There are spreading ridges (like the Mid-Atlantic Ridge) connected with transform (strike slip) plate boundary faults. The green lines in the map below are the transform faults and the yellow lines are the spreading centers (generally, the USGS kml file is not completely correctly attributed). There are frequent eruptions in the arc volcanoes in this region also.
The largest magnitude earthquake in this swarm is a Mw 6.5 strike slip earthquake. Here is the Mww moment tensor for this earthquake.
Here is the same map with historic earthquakes plotted in grey.
This map that shows the Modified Mercalli Shaking Intensity in the region of the Mw 6.5 earthquake.
Gorda plate earthquake animations
I have put together a couple animations of the earthquake epicenters preceding, during, and following the recent earthquake swarm in the Gorda plate. Here is the first page I put together for this M 6.8 earthquake. Here are some maps I put together to explain the epicenter pattern and how it might relate to faults in the Gorda plate.
There was also a M 5.2 extensional earthquake in the Gorda rise (where the Gorda plate is created, it is like the Mid-Atlantic Ridge). Looking at the animations below, one may notice that there were a couple earthquakes in the region of this M 5.2 prior to the 2014 March Gorda Earthquake Swarm. While it may be considered that the Gorda earthquakes triggered the M 5.2, it is evident that the fault that slipped during the M 5.2 was probably getting ready to rupture. This is true for most triggered earthquakes. The change in stress on faults due to loading from other earthquakes is very very small compared to the amount of stress necessarily applied to a fault to cause rupture. In other words, a fault needs to be close to earthquake failure in order to be triggered by another earthquake. Also, that these triggered earthquakes are limited in time because the change in fault stress is short lived. The 2010 Rollins and Stein paper (downloadable here) discusses some coulomb stress modeling they did following the 2010 M 6.5 earthquake in the Gorda plate. Here is a paper that discusses how a Cascadia subduction zone earthquake could trigger an earthquake on the San Andreas fault.
I used the USGS website to download the epicenters in this region. One of the options is to export the epicenters as a google kml file. These files display in google earth.
Click on the maps to open/download the video in a new window.
Here is an animation of the region offshore northern California for the time range 2014/1/16 through 2014/3/23. (~23 MB avi)
Here is an animation zoomed into offshore of Humboldt County. The USGS fault and fold database show the faults. There are also plate boundary faults plotted (they are less certain and less precise). (~28 MB avi)
Here is an animation of the earthquake swarm itself. Note that there are some epicenters that strike at the same instance as the mainshock. These are probably all ruptures on the same fault. There are many other aftershocks that are not on the same fault, but synthetic (trend in a parallel or subparallel direction as the main fault) or antithetic faults (trend in a conjugate direction). In some cases there are also aftershocks that occur at the same instance and apparently align along another fault (they line up). For faults close to the mainshock fault, these aftershocks may actually be on the mainshock fault but are plotted incorrectly due to the assumptions made in the location inversions (i.e. velocity models). People like Mark Williams or Anne Trehu (among others) may want to do some double differencing to these data to get better locations for these earthquake hypocenters.
Here I have slowed down the animation to better visualize the temporal relations between bursts in seismic energy.
Finally, here is an animation of the western USA that reveals something about the random nature of background seismicity. There are a few locations that show patterns that suggest faults ruptured. The recent Gorda plate earthquake swarm is one example. There were also a series of epicenters that plot in a northeast strike/trend just west of the mouth of the Mattole River. There also appears to be a swarm of earthquakes in the Yellowstone region, the Geysers (CA), and Salinas, CA.
M 6.7 earthquake swarm in northern Chile! 2014/03/06
There was a really cool earthquake swarm in northern Chile. This swarm of earthquakes are at depths that places them near the subduction zone fault interface.
This earthquake swarm is interesting for several reasons, the first of which is that it is in a possible seismic gap (a region along a fault system that has not slipped in recent, or not so recent, history/prehistory). Seismic gaps may exist due to a short record of earthquakes or due to some inability for earthquakes to occur in that region of the fault (i.e. aseismic slip).
Here is a map of the globe with the swarm (orange dots) in the center. There are plate boundary faults mapped, as well as subduction zone fault contours. These fault “slab” contours were constructed based on seismicity by Gavin Hayes (USGS).
Here is a regional view of the same mapping configuration.
Here is a regional map with historic epicenters plotted as rey circles. Note the absence of earthquakes in the updip portion of hte subduction zone faul tin the region of this earthquake swarm.
Here is the swarm at a local scale. The shallowest red slab contour is 20 km. The second shallowest red contour is 40 km. These earthquakes have hypocentral depths about 20 km.
This is the Mww moment tensor for the mainshock. This shows an earthquake on a northwest striking thrust or reverse fault.
Here is the USGS Did You Feel It map for the mainshock.
Here is an older map by Matt Pritchard (Cornell) that has some historic earthquakes plotted.
This is a map from Giovanni et al. (2001) that shows some possible earthquakes in this gap region.
M 5.2 Gorda plate earthquake 2014/03/13
This is a very cool earthquake!
In the last few days, there was an earthquake swarm in the southeastern Gorda plate. This earthquake released accumulated strain along the faults in that region. A result of these earthquakes is that the stress field in the region changes for a short period of time. These stress changes are very very small compared to the amount of stress typically released during an earthquake. So other faults in the region may have increased stress or decreased stress, depending upon their orientation. Here is the USGS page for this earthquake.
Here are some pages for the recent earthquakes in the southeast Gorda plate:
Here is a map showing the epicenter of today’s earthquake in the central western Gorda plate.
Here is the seismograph from the seismometer at the HSU
Department of Geology. Thanks to Lori Dengler for posting this on the Redwood Coast Tsunami Workup facebook page
Here is an early moment tensor (Mww). There may be updates to this as this is an early data set.Looks like a normal (extensional) earthquake to me. I tell my students that normal/extensional earthquake moment tensors and focal mechanisms look like oreo cookies. There is a primer down lower on this page that may help explain what different faults and what moment tensors are.
The Cascadia subduction zone is formed where the Gorda and Juan de Fuca plates subduct northeastward beneath the North America plate. Here is a figure that Alan Nelson put together. I have updated it with material from Jason Chaytor’s 2004 paper.
The Gorda plate has many strike slip faults that have formed as a result of the internal deformation within the Gorda plate. This deformation is driven by the regional tectonics. Chaytor et al, 2004 is the most recent paper that does a great job at summarizing the various tectonic models. Here is a figure that shows a summary of their models.
Based on modeling conducted by Rollins and Stein (2010), stress changes from earthquakes in the se Gorda plate may extend as far as today’s M5 earthquake, but the changes in stress at that distance are very very low. It may be unlikely but still possible the earthquakes in the se Gorda triggered today’s earthquake.Here is a map Rollins put together in the last few days regarding these GP earthquakes.
Here is a map from Chaytor et al. (2004) that shows some details of the faulting in the region. The moment tensor (at the moment i write this) shows a north-south striking fault with a reverse or thrust faulting mechanism. While this region of faulting is dominated by strike slip faults (and most all prior earthquake moment tensors showed strike slip earthquakes), when strike slip faults bend, they can create compression (transpression) and extension (transtension). This transpressive or transtentional deformation may produce thrust/reverse earthquakes or normal fault earthquakes, respectively. The transverse ranges north of Los Angeles are an example of uplift/transpression due to the bend in the San Andreas fault in that region.
Here is a plot that shows the shaking intensity of this earthquake as it decreases with distance from the epicenter/hypocenter. This plot is based on the responses from people who fill out a “Did You Feel It?” form.
Here is a map I put together with the seismicity from 1973-2013
References:
- Chaytor, J.D., Goldfinger, C., Dziak, R.P., Fox, C.G., 2004. Active deformation of the Gorda plate: Constraining deformation models with new geophysical data. Geology 32, 353-356.
- Rollins, J.C., Stein, R.S., 2010. Coulomb Stress Interactions Among M ≥ 5.9 Earthquakes in the Gorda Deformation Zone and on the Mendocino Fault Zone, Cascadia Subduction Zone, and Northern San Andreas Fault. Journal of Geophysical Research 115, 19 pp.
Here is a primer for the different types of earthquake faults: