Earthquake Report: Gorda plate

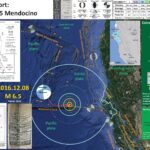
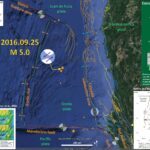
We just had an earthquake in the Gorda plate. The USGS magnitude is 5.1. This earthquake happened a few kilometers southwest of the 2014 M 6.8 earthquake. Based upon the orientation of the faults in the region, today’s earthquake may have occurred on the same fault as the 2014 earthquake (but it is really difficult to tell and just as likely did not).
The last earthquake report I prepared for a Gorda plate earthquake happened on 2016.09.25. Here is my report for that earthquake.

Here is the USGS website for this earthquake.

Below is my interpretive poster for this earthquake.

I plot the seismicity from the past month, with color representing depth and diameter representing magnitude (see legend).

  • I placed a moment tensor / focal mechanism legend on the poster. There is more material from the USGS web sites about moment tensors and focal mechanisms (the beach ball symbols). Both moment tensors and focal mechanisms are solutions to seismologic data that reveal two possible interpretations for fault orientation and sense of motion. One must use other information, like the regional tectonics, to interpret which of the two possibilities is more likely. Based upon the series of earthquakes and the mapped faults, I interpret this M 5.1 earthquake as a left-lateral strike-slip earthquake related to slip associated with the Gorda plate.
  • I also include the shaking intensity contours on the map. These use the Modified Mercalli Intensity Scale (MMI; see the legend on the map). This is based upon a computer model estimate of ground motions, different from the “Did You Feel It?” estimate of ground motions that is actually based on real observations. The MMI is a qualitative measure of shaking intensity. More on the MMI scale can be found here and here. This is based upon a computer model estimate of ground motions, different from the “Did You Feel It?” estimate of ground motions that is actually based on real observations.
  • I include the slab contours plotted (Hayes et al., 2012), which are contours that represent the depth to the subduction zone fault. These are mostly based upon seismicity. The depths of the earthquakes have considerable error and do not all occur along the subduction zone faults, so these slab contours are simply the best estimate for the location of the fault.

    I include some inset figures in the poster.

  • In the upper right corner is a map of the Cascadia subduction zone (CSZ) and regional tectonic plate boundary faults. This is modified from several sources (Chaytor et al., 2004; Nelson et al., 2004)
  • Below the CSZ map is an illustration modified from Plafker (1972). This figure shows how a subduction zone deforms between (interseismic) and during (coseismic) earthquakes. Today’s earthquake did not occur along the CSZ, so did not produce crustal deformation like this. However, it is useful to know this when studying the CSZ.
  • In the lower left corner is a figure from Rollins and Stein (2010). In their paper they discuss how static coulomb stress changes from earthquakes may impart (or remove) stress from adjacent crust/faults. I also present their figure where they present seismic observations for the 1983.08.24 M 5.5 earthquake (Rollins and Stein list M 6.3). I place a yellow star in the general location of today’s earthquake.
  • In the upper right corner is a map from Chaytor et al. (2004) that shows some details of the faulting in the region. More about this figure can be found below.


  • Here is a map of the Cascadia subduction zone, modified from Nelson et al. (2006). The Juan de Fuca and Gorda plates subduct norteastwardly beneath the North America plate at rates ranging from 29- to 45-mm/yr. Sites where evidence of past earthquakes (paleoseismology) are denoted by white dots. Where there is also evidence for past CSZ tsunami, there are black dots. These paleoseismology sites are labeled (e.g. Humboldt Bay). Some submarine paleoseismology core sites are also shown as grey dots. The two main spreading ridges are not labeled, but the northern one is the Juan de Fuca ridge (where oceanic crust is formed for the Juan de Fuca plate) and the southern one is the Gorda rise (where the oceanic crust is formed for the Gorda plate).

  • Here is a version of the CSZ cross section alone (Plafker, 1972). This shows two parts of the earthquake cycle: the interseismic part (between earthquakes) and the coseismic part (during earthquakes). Regions that experience uplift during the interseismic period tend to experience subsidence during the coseismic period.

  • Here is a map from Chaytor et al. (2004) that shows some details of the faulting in the region. The moment tensor (at the moment i write this) shows a north-south striking fault with a reverse or thrust faulting mechanism. While this region of faulting is dominated by strike slip faults (and most all prior earthquake moment tensors showed strike slip earthquakes), when strike slip faults bend, they can create compression (transpression) and extension (transtension). This transpressive or transtentional deformation may produce thrust/reverse earthquakes or normal fault earthquakes, respectively. The transverse ranges north of Los Angeles are an example of uplift/transpression due to the bend in the San Andreas fault in that region.

  • These are the models for tectonic deformation within the Gorda plate as presented by Jason Chaytor in 2004.
  • Mw = 5 Trinidad Chaytor

  • Here is a map from Rollins and Stein, showing their interpretations of different historic earthquakes in the region. This was published in response to the Januray 2010 Gorda plate earthquake. The faults are from Chaytor et al. (2004).

  • In this map below, I label a number of other significant earthquakes in this Mendocino triple junction region. Another historic right-lateral earthquake on the Mendocino fault system was in 1994. There was a series of earthquakes possibly along the easternmost section of the Mendocino fault system in late January 2015, here is my post about that earthquake series.

The Gorda and Juan de Fuca plates subduct beneath the North America plate to form the Cascadia subduction zone fault system. In 1992 there was a swarm of earthquakes with the magnitude Mw 7.2 Mainshock on 4/25. Initially this earthquake was interpreted to have been on the Cascadia subduction zone (CSZ). The moment tensor shows a compressional mechanism. However the two largest aftershocks on 4/26/1992 (Mw 6.5 and Mw 6.7), had strike-slip moment tensors. These two aftershocks align on what may be the eastern extension of the Mendocino fault.
There have been several series of intra-plate earthquakes in the Gorda plate. Two main shocks that I plot of this type of earthquake are the 1980 (Mw 7.2) and 2005 (Mw 7.2) earthquakes. I place orange lines approximately where the faults are that ruptured in 1980 and 2005. These are also plotted in the Rollins and Stein (2010) figure above. The Gorda plate is being deformed due to compression between the Pacific plate to the south and the Juan de Fuca plate to the north. Due to this north-south compression, the plate is deforming internally so that normal faults that formed at the spreading center (the Gorda Rise) are reactivated as left-lateral strike-slip faults. In 2014, there was another swarm of left-lateral earthquakes in the Gorda plate. I posted some material about the Gorda plate setting on this page.
There are three types of earthquakes, strike-slip, compressional (reverse or thrust, depending upon the dip of the fault), and extensional (normal). Here is are some animations of these three types of earthquake faults. Many of the earthquakes people are familiar with in the Mendocino triple junction region are either compressional or strike slip. The following three animations are from IRIS.
Strike Slip:

Compressional:

Extensional:


    References:

  • Atwater, B.F., Musumi-Rokkaku, S., Satake, K., Tsuju, Y., Eueda, K., and Yamaguchi, D.K., 2005. The Orphan Tsunami of 1700—Japanese Clues to a Parent Earthquake in North America, USGS Professional Paper 1707, USGS, Reston, VA, 144 pp.
  • Burgette, R. et al., 2009. Interseismic uplift rates for western Oregon and along-strike variation in locking on the Cascadia subduction zone in Journal of Geophysical Research, v. 114, B01408, doi:10.1029/2008JB005679
  • Chaytor, J.D., Goldfinger, C., Dziak, R.P., and Fox, C.G., 2004. Active deformation of the Gorda plate: Constraining deformation models with new geophysical data: Geology v. 32, p. 353-356
  • Goldfinger, C., Nelson, C.H., Morey, A., Johnson, J.E., Gutierrez-Pastor, J., Eriksson, A.T., Karabanov, E., Patton, J., Gràcia, E., Enkin, R., Dallimore, A., Dunhill, G., and Vallier, T., 2012. Turbidite Event History: Methods and Implications for Holocene Paleoseismicity of the Cascadia Subduction Zone, USGS Professional Paper # 1661F. U.S. Geological Survey, Reston, VA, 184 pp.
  • McCrory, P. A., Blair, J. L., Oppenheimer, D. H., and Walter, S. R., 2006. Depth to the Juan de Fuca slab beneath the Cascadia subduction margin; a 3-D model for sorting earthquakes U. S. Geological Survey
  • Nelson, A.R., Kelsey, H.M., and Witter, R.C., 2006. Great earthquakes of variable magnitude at the Cascadia subduction zone: Quaternary Research, doi:10.1016/j.yqres.2006.02.009, p. 354-365.
  • Plafker, G., 1972. Alaskan earthquake of 1964 and Chilean earthquake of 1960: Implications for arc tectonics in Journal of Geophysical Research, v. 77, p. 901-925.
  • Rollins, J.C., Stein, R.S., 2010. Coulomb Stress Interactions Among M ≥ 5.9 Earthquakes in the Gorda Deformation Zone and on the Mendocino Fault Zone, Cascadia Subduction Zone, and Northern San Andreas Fault. Journal of Geophysical Research 115, 19 pp.
  • USGS Quaternary Fault Database: http://earthquake.usgs.gov/hazards/qfaults/
  • Wang, K., Wells, R., Mazzotti, S., Hyndman, R. D., and Sagiya, T., 2003. A revised dislocation model of interseismic deformation of the Cascadia subduction zone Journal of Geophysical Research, B, Solid Earth and Planets v. 108, no. 1.

Earthquake Report: Trinidad, California

Early this morning, I was awakened by a mild jolt. I thought, well, seems like a M 3+- nearby. I did not get out of bed. The main shaking lasted a couple of seconds, though it seemed that there was some additional shaking for several more seconds afterwards (secondary shaking? I live in the Manila Dunes, which overlie several kms of water saturated sediment.

This earthquake is quite interesting. The hypocentral depth is about 20 km. The subduction zone fault has been modeled to be between 15 and 20 km depth at this location (McCrory et al., 2006, 2012). There is considerable uncertainty associated with this slab model (the “slab” refers to the downgoing oceanic lithosphere of the Gorda plate). If this earthquake were an interface event (on the subduction zone), the moment tensor would probably be a thrust fault solution. However, the USGS moment tensor is for a strike-slip earthquake. There was an M 4.8 earthquake on 2016.07.21 that had a similar orientation. Here are my two earthquake reports for that earthquake: (1) initial report and (2) update # 1. I also spoke with Bob McPherson about this earthquake and, without speaking for him, we agreed that this is indeed an interesting earthquake.

  • So, we can probably rule out this as a subduction zone interface earthquake. Then lets consider the other two options: (1) Gorda plate intraplate earthquake or (2) North America plate intraplate earthquake.
  1. The Gorda plate has a structural grain associated with its initial formation at the Gorda Rise. These faults initially form as ~north-south striking normal faults. As the plate is deformed with time, the faults in the southern half of the plate rotate in a clockwise fashion. As a result of the north-south compression (from the Pacific plate moving northwards,
    crushing the Gorda plate), these northeast striking faults slip with a left-lateral strike-slip motion. Today’s M 3.5 earthquake is not oriented with a northeast orientation. However, as these faults extend northwards, the strike of the faults tend to rotate back with a more northerly strike. It is possible that the faults in the Gorda plate have a north-south strike in the region of today’s earthquake. If this were the case, this would be a north-south striking left-lateral strike-slip earthquake.
  2. The North America plate (NAP) in this region has been sliced and diced by a suite of different tectonic forces that have changed with time. Prior to about 0.5 million years ago, the dominant tectonic regime was simply the subduction zone. The subduction zone exerted stresses into the NAP that resulted in thrust faults (and possibly forearc sliver faults). After that, the San Andreas fault (and the Mendocino triple junction, MTJ) came on the scene. Tertiary rocks have been uplifted and tilted northwards because of this influence. Also, the earlier formed thrust faults may rotate around to a more east-west orientation in the Humboldt Bay and south region. As the MTJ migrates north (which may not be the best way to view this motion), some San Andreas oriented fault motion has penetrated into the region north of the MTJ. The Trinidad and Big Lagoon faults are mapped as strike-slip faults offshore. These faults may have formed this sense of motion prior to the MTJ arrival (due to oblique plate motion on the subduction zone, formed as forearc sliver faults; Lange et al., 2008). One of the strands of the Big Lagoon fault zone is oriented north-south. The only (major) problem with this possibility is that these NAP strike-slip faults are all right-lateral. Today’s moment tensor, if using the north-south solution, is left-lateral. So, this is not a reasonable interpretation.

Below is my interpretive poster for this earthquake.

I plot the seismicity from the past month, with color representing depth and diameter representing magnitude (see legend). I highlighted the north-south striking Big Lagoon fault with a yellow line. I also labeled Mt. Shasta. I placed labels for the three major thrust fault systems in this region (Big Lagoon fault zone, Mad River fault zone, and the Little Salmon fault zone). The Big Lagoon and Mad River fault zones have offshore strike-slip motion. Also, the Little Salmon fault probably also has significant strike-slip motion (Pollitz et al., 2010).

  • I placed a moment tensor / focal mechanism legend on the poster. There is more material from the USGS web sites about moment tensors and focal mechanisms (the beach ball symbols). Both moment tensors and focal mechanisms are solutions to seismologic data that reveal two possible interpretations for fault orientation and sense of motion. One must use other information, like the regional tectonics, to interpret which of the two possibilities is more likely.
  • I also include the shaking intensity contours on the map. These use the Modified Mercalli Intensity Scale (MMI; see the legend on the map). This is based upon a computer model estimate of ground motions, different from the “Did You Feel It?” estimate of ground motions that is actually based on real observations. The MMI is a qualitative measure of shaking intensity. More on the MMI scale can be found here and here. This is based upon a computer model estimate of ground motions, different from the “Did You Feel It?” estimate of ground motions that is actually based on real observations.
  • I include the slab contours plotted (McCrory et al., 2006, 2012), which are contours that represent the depth to the subduction zone fault. These are mostly based upon seismicity. The depths of the earthquakes have considerable error and do not all occur along the subduction zone faults, so these slab contours are simply the best estimate for the location of the fault. I label the shallowest contours.

    I include some inset figures in the poster.

  • In the lower right corner I include a map of the Cascadia subduction zone (Chaytor et al., 2004; Nelson et al., 2004, 2006). I mention more about this below.
  • In the upper left corner I include a map from Rollins and Stein (2010) that show some historic earthquakes in the context of the regional tectonics. Their paper documents how these different earthquakes impose increased and decreased coulomb stress upon different faults following these earthquakes.
  • Below the Rollins and Stein (2010) figure is a figure from Chaytor et al. (2004) that shows 7 different models to explain the internal deformation in the Gorda plate.
  • In the upper right corner is a larger scale map showing the USGS Quaternary fault and fold database faults overlain upon Google Earth imagery (just like the main map). I also include labels like in the main map.


Here is the interpretive poster for the 2016.07.21 Bayside Earthquake.

  • Here is a map of the Cascadia subduction zone, modified from Nelson et al. (2004). The Juan de Fuca and Gorda plates subduct norteastwardly beneath the North America plate at rates ranging from 29- to 45-mm/yr. Sites where evidence of past earthquakes (paleoseismology) are denoted by white dots. Where there is also evidence for past CSZ tsunami, there are black dots. These paleoseismology sites are labeled (e.g. Humboldt Bay). Some submarine paleoseismology core sites are also shown as grey dots. The two main spreading ridges are not labeled, but the northern one is the Juan de Fuca ridge (where oceanic crust is formed for the Juan de Fuca plate) and the southern one is the Gorda rise (where the oceanic crust is formed for the Gorda plate).

  • Here is a version of the CSZ cross section alone (Plafker, 1972). This shows two parts of the earthquake cycle: the interseismic part (between earthquakes) and the coseismic part (during earthquakes). Regions that experience uplift during the interseismic period tend to experience subsidence during the coseismic period.

  • Here is a figure from Chaytor et al. (2004) that shows how they interpret the different faults based upon bathymetric data. Note the north-south striking faults in the northern part of the Gorda plate. However, they are normal faults, not strike slip. So, this makes it more difficult (again) to interpret today’s M 3.5 earthquake.

  • A: Mapped faults and fault-related ridges within Gorda plate based on basement structure and surface morphology, overlain on bathymetric contours (gray lines—250 m interval). Approximate boundaries of three structural segments are also shown. Black arrows indicated approximate location of possible northwest- trending large-scale folds. B, C:
    Uninterpreted and interpreted enlargements of center of plate showing location of interpreted second-generation strike-slip faults and features that they appear to offset. OSC—overlapping spreading center.

  • Here is another figure from Chaytor et al. (2004) that shows the different models for the Gorda plate faults.

  • Models of brittle deformation for Gorda plate overlain on magnetic anomalies modified from Raff and Mason (1961). Models A–F were proposed prior to collection and analysis of full-plate multibeam data. Deformation model of Gulick et al. (2001) is included in model A. Model G represents modification of Stoddard’s (1987) flexural-slip model proposed in this paper.

  • Here is a map showing a number of data sets. Seismicity is plotted versus depth (NCEDC). Tremor is plotted (Pacific Northwest Seismic Network). Vertical Deformation rates are plotted (unpublished). Slab depth contours (km) are plotted (McCrory et al., 2006). Fault locking zones are plotted (Wang et al., 2003; Burgette et al., 2009). Bob McPherson (Humboldt State University, Department of Geology) is currently working on a research paper where he will discuss how the seismicity reveals the location of the seismogenically locked fault zone.

  • Here is a great illustration that shows how forearc sliver faults form due to oblique convergence at a subduction zone (Lange et al., 2008). Strain is partitioned into fault normal faults (the subduction zone) and fault parallel faults (the forearc sliver faults, which are strike-slip). This figure is for southern Chile, but is applicable globally.

  • Proposed tectonic model for southern Chile. Partitioning of the oblique convergence vector between the Nazca plate and South American plate results in a dextral strike-slip fault zone in the magmatic arc and a northward moving forearc sliver. Modified after Lavenu and Cembrano (1999).

  • As mentioned above, Pollitz et al. (2010) modeled interseismic deformation along faults in the Pacific northwest and fit this deformation to GPS geodetic data. The authors evaluated how San Andreas type fault motion penetrates into the southern Cascadia subduction zone. Below are two figures from their paper that helps us understand their interpretations. The upper figure shows the GPS velocity field and the strain rate field for this region of northern California. The lower panel shows an estimate of right-lateral strike-slip rates for the Little Salmon fault.

  • Left-hand panel: velocity field obtained after correcting the observed GPS velocity field (Fig. 3) for the effect of deformation associated with all GDZ, Juan de Fuca, and Explorer plate boundaries. The sources that contribute to the correction are faults #30–46 and 81 of Table 1. Right-hand panel: strain rate fields corresponding to the plotted velocity fields, represented by the amplitudes and directions of the principal strain rate axes (thick and thin line segments denoting a principal contractile or tensile strain rate axis, respectively) and rotation rate (indicated by color shading). It is derived from the velocity field using the velocity-gradient determination method described in appendix A of Pollitz & Vergnolle (2006).


    Estimated right-lateral strike-slip rate on the Little Salmon fault as a function of strike-slip rate on the Russ fault. Reverse slip rate on the Mad River fault is held fixed at 10 mmyr−1. Slip rates are plotted with ±1 SD.

References

  • Atwater, B.F., Musumi-Rokkaku, S., Satake, K., Tsuju, Y., Eueda, K., and Yamaguchi, D.K., 2005. The Orphan Tsunami of 1700—Japanese Clues to a Parent Earthquake in North America, USGS Professional Paper 1707, USGS, Reston, VA, 144 pp.
  • Burgette, R. et al., 2009. Interseismic uplift rates for western Oregon and along-strike variation in locking on the Cascadia subduction zone in Journal of Geophysical Research, v. 114, B01408, doi:10.1029/2008JB005679
  • Chaytor, J.D., Goldfinger, C., Dziak, R.P., and Fox, C.G., 2004. Active deformation of the Gorda plate: Constraining deformation models with new geophysical data: Geology v. 32, p. 353-356
  • Lange, D., Cembrano, J., Rietbrock, A., Haberland, C., Dahm, T., and Bataille, K., 2008. First seismic record for intra-arc strike-slip tectonics along the Liquiñe-Ofqui fault zone at the obliquely convergent plate margin of the southern Andes in Tectonophysics, v. 455, p. 14-24
  • McCrory, P. A., Blair, J. L., Oppenheimer, D. H., and Walter, S. R., 2006. Depth to the Juan de Fuca slab beneath the Cascadia subduction margin; a 3-D model for sorting earthquakes U. S. Geological Survey
  • McCrory, P. A., Blair, J. L., Waldhauser, F., and Oppenheimer, D. H., 2012. Juan de Fuca slab geometry and its relation to Wadati-Benioff zone seismicity in JGR, v. 117, doi:10.1029/2012JB009407
  • Nelson, A.R., Asquith, A.C., and Grant, W.C., 2004. Great Earthquakes and Tsunamis of the Past 2000 Years at the Salmon River Estuary, Central Oregon Coast, USA: Bulletin of the Seismological Society of America, Vol. 94, No. 4, pp. 1276–1292
  • Nelson, A.R., Kelsey, H.M., and Witter, R.C., 2006. Great earthquakes of variable magnitude at the Cascadia subduction zone: Quaternary Research, doi:10.1016/j.yqres.2006.02.009, p. 354-365.
  • Plafker, G., 1972. Alaskan earthquake of 1964 and Chilean earthquake of 1960: Implications for arc tectonics in Journal of Geophysical Research, v. 77, p. 901-925.
  • Pollitz, F.F., McCrory, P., Wilson, D., Svarc, J., Puskas, C., and Smith, R.B., 2010. Viscoelastic-cycle model of interseismic deformation in the northwestern United States in GJI, v. 181, p. 665-696, doi: 10.1111/j.1365-246X.2010.04546.x
  • Rollins, J.C., Stein, R.S., 2010. Coulomb Stress Interactions Among M ≥ 5.9 Earthquakes in the Gorda Deformation Zone and on the Mendocino Fault Zone, Cascadia Subduction Zone, and Northern San Andreas Fault. Journal of Geophysical Research 115, 19 pp.
  • USGS Quaternary Fault Database: http://earthquake.usgs.gov/hazards/qfaults/
  • Wang, K., Wells, R., Mazzotti, S., Hyndman, R. D., and Sagiya, T., 2003. A revised dislocation model of interseismic deformation of the Cascadia subduction zone Journal of Geophysical Research, B, Solid Earth and Planets v. 108, no. 1.

Earthquake Report: 1700 Cascadia subduction zone 317 year commemoration

Today (possibly tonight at about 9 PM) is the birthday of the last known Cascadia subduction zone (CSZ) earthquake. There is some evidence that there have been more recent CSZ earthquakes (e.g. late 19th century in southern OR / northern CA), but they were not near full margin ruptures (where the entire fault, or most of it, slipped during the earthquake).
I have been posting material about the CSZ for the past couple of years here and below are some prior Anniversary posts, as well as Earthquake Reports sorted according to their region along the CSZ. Below I present some of the material included in those prior reports (to help bring it all together), but I have prepared a new map for today’s report as well.


On this evening, 317 years ago, the Cascadia subduction zone fault ruptured as a margin wide earthquake. I here commemorate this birthday with some figures that are in two USGS open source professional papers. The Atwater et al. (2005) paper discusses how we came to the conclusion that this last full margin earthquake happened on January 26, 1700 at about 9 PM (there may have been other large magnitude earthquakes in Cascadia in the 19th century). The Goldfinger et al. (2012) paper discusses how we have concluded that the records from terrestrial paleoseismology are correlable and how we think that the margin may have ruptured in the past (rupture patch sizes and timing). The reference list is extensive and this is but a tiny snapshot of what we have learned about Cascadia subduction zone earthquakes. Brian Atwater and his colleagues have updated the Orphan Tsunami and produced a second edition available here for download and here for hard copy purchase (I have a hard copy).

Here is a map of the Cascadia subduction zone, modified from Nelson et al. (2006). The Juan de Fuca and Gorda plates subduct northeastwardly beneath the North America plate at rates ranging from 29- to 45-mm/yr. Sites where evidence of past earthquakes (paleoseismology) are denoted by white dots. Where there is also evidence for past CSZ tsunami, there are black dots. These paleoseismology sites are labeled (e.g. Humboldt Bay). Some submarine paleoseismology core sites are also shown as grey dots. The two main spreading ridges are not labeled, but the northern one is the Juan de Fuca ridge (where oceanic crust is formed for the Juan de Fuca plate) and the southern one is the Gorda rise (where the oceanic crust is formed for the Gorda plate).


Today I prepared this new map showing the results of shakemap scenario model prepared by the USGS. I prepared this map using data that can be downloaded from the USGS website here. Shakemaps show what we think might happen during an earthquake, specifically showing how strongly the ground might shake. There are different measures of this, which include Peak Ground Acceleration (PGA), Peak Ground Velocity (PGV), and Modified Mercalli Intensity (MMI). More background information about the shakemap program at the USGS can be found here. One thing that all of these measures share is that they show that there is a diminishing of ground shaking with distance from the earthquake. This means that the further from the earthquake, the less strongly the shaking will be felt. This can be seen on the maps below. The USGS prepares shakemaps for all earthquakes with sufficiently large magnitudes (i.e. we don’t need shakemaps for earthquakes of magnitude M = 1.5). An archive of these USGS shakemaps can be found here. All the scenario USGS shakemaps can be found here.
I chose to use the MMI representation of ground shaking because it is most easily comparable for people to understand. This is because MMI scale is designed based upon relations between ground shaking intensity and observations that people are able to make (e.g. how strongly they felt the earthquake, how much objects in their residences or places of business responded, how much buildings were damaged, etc.).
The MMI ground motion model is based upon a computer model estimate of ground motions, different from the “Did You Feel It?” estimate of ground motions that is actually based on real observations. More on the MMI scale can be found here and here.


Here is the USGS version of this map. The outline of the fault that was used to generate the ground motions that these maps are based upon is outlined in black.


I prepared an end of the year summary for earthquakes along the CSZ. Below is my map from this Earthquake Report.

  • Here is the map where I show the epicenters as circles with colors designating the age. I also plot the USGS moment tensors for each earthquake, with arrows showing the sense of motion for each earthquake.
  • I placed a moment tensor / focal mechanism legend in the lower left corner of the map. There is more material from the USGS web sites about moment tensors and focal mechanisms (the beach ball symbols). Both moment tensors and focal mechanisms are solutions to seismologic data that reveal two possible interpretations for fault orientation and sense of motion. One must use other information, like the regional tectonics, to interpret which of the two possibilities is more likely.
  • In some cases, I am able to interpret the sense of motion for strike-slip earthquakes. In other cases, I do not know enough to be able to make this interpretation (so I plot both solutions).

    I include some inset figures in the poster.

  • In the upper left corner is a map of the Cascadia subduction zone (CSZ) and regional tectonic plate boundary faults. This is modified from several sources (Chaytor et al., 2004; Nelson et al., 2004)
  • Below the CSZ map is an illustration modified from Plafker (1972). This figure shows how a subduction zone deforms between (interseismic) and during (coseismic) earthquakes. Today’s earthquake did not occur along the CSZ, so did not produce crustal deformation like this. However, it is useful to know this when studying the CSZ.
  • To the lower right of the Cascadia map and cross section is a map showing the latest version of the Uniform California Earthquake Rupture Forecast (UCERF). Let it be known that this is not really a forecast, and this name was poorly chosen. People cannot forecast earthquakes. However, it is still useful. The faults are colored vs. their likelihood of rupturing. More can be found about UCERF here. Note that the San Andreas fault, and her two sister faults (Maacama and Bartlett Springs), are orange-red.
  • To the upper right of the Cascadia map and cross section is a map showing the shaking intensities based upon the USGS Shakemap model. Earthquake Scenarios describe the expected ground motions and effects of specific hypothetical large earthquakes. The color scale is the same as found on many of my #EarthquakeReport interpretive posters, the Modified Mercalli Intensity Scale (MMI). The latest version of this map is here.
  • In the upper right corner I include generalized fault map of northern California from Wallace (1990).
  • To the left of the Wallace (1990) map is a figure that shows the evolution of the San Andreas fault system since 30 million years ago (Ma). This is a figure from the USGS here.
  • In the lower right corner I include the Earthquake Shaking Potential map from the state of California. This is a probabilistic seismic hazard map, basically a map that shows the likelihood that there will be shaking of a given amount over a period of time. More can be found from the California Geological Survey here. I place a yellow star in the approximate location of today’s earthquake.


This figure shows how a subduction zone deforms between (interseismic) and during (coseismic) earthquakes. We also can see how a subduction zone generates a tsunami. Atwater et al., 2005.


Here is a version of the CSZ cross section alone (Plafker, 1972).


Here is an animation produced by the folks at Cal Tech following the 2004 Sumatra-Andaman subduction zone earthquake. I have several posts about that earthquake here and here. One may learn more about this animation, as well as download this animation here.

Here is a graphic showing the sediment-stratigraphic evidence of earthquakes in Cascadia. Atwater et al., 2005. There are 3 panels on the left, showing times of (1) prior to earthquake, (2) several years following the earthquake, and (3) centuries after the earthquake. Before the earthquake, the ground is sufficiently above sea level that trees can grow without fear of being inundated with salt water. During the earthquake, the ground subsides (lowers) so that the area is now inundated during high tides. The salt water kills the trees and other plants. Tidal sediment (like mud) starts to be deposited above the pre-earthquake ground surface. This sediment has organisms within it that reflect the tidal environment. Eventually, the sediment builds up and the crust deforms interseismically until the ground surface is again above sea level. Now plants that can survive in this environment start growing again. There are stumps and tree snags that were rooted in the pre-earthquake soil that can be used to estimate the age of the earthquake using radiocarbon age determinations. The tree snags form “ghost forests.


Here is a photo of the ghost forest, created from coseismic subsidence during the Jan. 26, 1700 Cascadia subduction zone earthquake. Atwater et al., 2005.


Here is a photo I took in Alaska, where there was a subduction zone earthquake in 1964. These tree snags were living trees prior to the earthquake and remain to remind us of the earthquake hazards along subduction zones.


This shows how a tsunami deposit may be preserved in the sediment stratigraphy following a subduction zone earthquake, like in Cascadia. Atwater et al., 2005. If there is a source of sediment to be transported by a tsunami, it will come along for the ride and possibly be deposited upon the pre-earthquake ground surface. Following the earthquake, tidal sediment is deposited above the tsunami transported sediment. Sometimes plants that were growing prior to the earthquake get entombed within the tsunami deposit.


The NOAA/NWS/Pacific Tsunami Warning Center has updated their animation of the simulation of the 1700 “Orphan Tsunami.”
Source: Nathan C. Becker, Ph.D. nathan.becker at noaa.gov

Below are some links and embedded videos.

  • Here is the yt link for the embedded video below.
  • Here is the mp4 link for the embedded video below. (2160p 145 mb mp4)
  • Here is the mp4 link for the embedded video below. (1080p 145 mb mp4)

  • Here is the text associated with this animation:

    Just before midnight on January 27, 1700 a tsunami struck the coasts of Japan without warning since no one in Japan felt the earthquake that must have caused it. Nearly 300 years later scientists and historians in Japan and the United States solved the mystery of what caused this “orphan tsunami” through careful analysis of historical records in Japan as well as oral histories of Native Americans, sediment deposits, and ghost forests of drowned trees in the Pacific Northwest of North America, a region also known as Cascadia. They learned that this geologically active region, the Cascadia Subduction Zone, not only hosts erupting volcanoes but also produces megathrust earthquakes capable of generating devastating, ocean-crossing tsunamis. By comparing the tree rings of dead trees with those still living they could tell when the last of these great earthquakes struck the region. The trees all died in the winter of 1699-1700 when the coasts of northern California, Oregon, and Washington suddenly dropped 1-2 m (3-6 ft.), flooding them with seawater. That much motion over such a large area requires a very large earthquake to explain it—perhaps as large as 9.2 magnitude, comparable to the Great Alaska Earthquake of 1964. Such an earthquake would have ruptured the earth along the entire length of the 1000 km (600 mi) -long fault of the Cascadia Subduction Zone and severe shaking could have lasted for 5 minutes or longer. Its tsunami would cross the Pacific Ocean and reach Japan in about 9 hours, so the earthquake must have occurred around 9 o’clock at night in Cascadia on January 26, 1700 (05:00 January 27 UTC).

    The Pacific Tsunami Warning Center (PTWC) can create an animation of a historical tsunami like this one using the same too that they use for determining tsunami hazard in real time for any tsunami today: the Real-Time Forecasting of Tsunamis (RIFT) forecast model. The RIFT model takes earthquake information as input and calculates how the waves move through the world’s oceans, predicting their speed, wavelength, and amplitude. This animation shows these values through the simulated motion of the waves and as they race around the globe one can also see the distance between successive wave crests (wavelength) as well as their height (half-amplitude) indicated by their color. More importantly, the model also shows what happens when these tsunami waves strike land, the very information that PTWC needs to issue tsunami hazard guidance for impacted coastlines. From the beginning the animation shows all coastlines covered by colored points. These are initially a blue color like the undisturbed ocean to indicate normal sea level, but as the tsunami waves reach them they will change color to represent the height of the waves coming ashore, and often these values are higher than they were in the deeper waters offshore. The color scheme is based on PTWC’s warning criteria, with blue-to-green representing no hazard (less than 30 cm or ~1 ft.), yellow-to-orange indicating low hazard with a stay-off-the-beach recommendation (30 to 100 cm or ~1 to 3 ft.), light red-to-bright red indicating significant hazard requiring evacuation (1 to 3 m or ~3 to 10 ft.), and dark red indicating a severe hazard possibly requiring a second-tier evacuation (greater than 3 m or ~10 ft.).

    Toward the end of this simulated 24-hours of activity the wave animation will transition to the “energy map” of a mathematical surface representing the maximum rise in sea-level on the open ocean caused by the tsunami, a pattern that indicates that the kinetic energy of the tsunami was not distributed evenly across the oceans but instead forms a highly directional “beam” such that the tsunami was far more severe in the middle of the “beam” of energy than on its sides. This pattern also generally correlates to the coastal impacts; note how those coastlines directly in the “beam” have a much higher impact than those to either side of it.

    Offshore, Goldfinger and others (from the 1960’s into the 21st Century, see references in Goldfinger et al., 2012) collected cores in the deep sea. These cores contain submarine landslide deposits (called turbidites). These turbidites are thought to have been deposited as a result of strong ground shaking from large magnitude earthquakes. Goldfinger et al. (2012) compile their research in the USGS professional paper. This map shows where the cores are located.


    Here is an example of how these “seismoturbidites” have been correlated. The correlations are the basis for the interpretation that these submarine landslides were triggered by Cascadia subduction zone earthquakes. This correlation figure demonstrates how well these turbidites have been correlated. Goldfinger et al., 2012.


    This map shows the various possible prehistoric earthquake rupture regions (patches) for the past 10,000 years. Goldfinger et al., 2012. These rupture scenarios have been adopted by the USGS hazards team that determines the seismic hazards for the USA.


    Here is an update of this plot given new correlations from recent work (Goldfinger et al., 2016).


    Here is a plot showing the earthquakes in a linear timescale.


    I combined the plot above into another figure that includes all the recurrence intervals and segment lengths in a single figure. This is modified from Goldfinger et al. (2012).

    http://earthquake.usgs.gov/earthquakes/shakemap/global/shake/casc9.0_expanded_peak_se/

Earthquake Report: 2016 Summary Cascadia

Here I summarize the seismicity for Cascadia in 2016. I limit this summary to earthquakes with magnitude greater than or equal to M 4.0. I reported on all but five of these earthquakes. I put this together a couple weeks ago, but wanted to wait to post until the new year (just in case that there was another earthquake to include).
I prepared a 2016 annual summary for Earth here.

    I include summaries of my earthquake reports in sorted into three categories. One may also search for earthquakes that may not have made it into these summary pages (use the search tool).

  • Magnitude
  • Region
  • Year

Earthquake Summary Poster (2016)

  • Here is the map where I show the epicenters as circles with colors designating the age. I also plot the USGS moment tensors for each earthquake, with arrows showing the sense of motion for each earthquake.
  • I placed a moment tensor / focal mechanism legend in the lower left corner of the map. There is more material from the USGS web sites about moment tensors and focal mechanisms (the beach ball symbols). Both moment tensors and focal mechanisms are solutions to seismologic data that reveal two possible interpretations for fault orientation and sense of motion. One must use other information, like the regional tectonics, to interpret which of the two possibilities is more likely.
  • In some cases, I am able to interpret the sense of motion for strike-slip earthquakes. In other cases, I do not know enough to be able to make this interpretation (so I plot both solutions).

    I include some inset figures in the poster.

  • In the upper left corner is a map of the Cascadia subduction zone (CSZ) and regional tectonic plate boundary faults. This is modified from several sources (Chaytor et al., 2004; Nelson et al., 2004)
  • Below the CSZ map is an illustration modified from Plafker (1972). This figure shows how a subduction zone deforms between (interseismic) and during (coseismic) earthquakes. Today’s earthquake did not occur along the CSZ, so did not produce crustal deformation like this. However, it is useful to know this when studying the CSZ.
  • To the lower right of the Cascadia map and cross section is a map showing the latest version of the Uniform California Earthquake Rupture Forecast (UCERF). Let it be known that this is not really a forecast, and this name was poorly chosen. People cannot forecast earthquakes. However, it is still useful. The faults are colored vs. their likelihood of rupturing. More can be found about UCERF here. Note that the San Andreas fault, and her two sister faults (Maacama and Bartlett Springs), are orange-red.
  • To the upper right of the Cascadia map and cross section is a map showing the shaking intensities based upon the USGS Shakemap model. Earthquake Scenarios describe the expected ground motions and effects of specific hypothetical large earthquakes. The color scale is the same as found on many of my #EarthquakeReport interpretive posters, the Modified Mercalli Intensity Scale (MMI). The latest version of this map is here.
  • In the upper right corner I include generalized fault map of northern California from Wallace (1990).
  • To the left of the Wallace (1990) map is a figure that shows the evolution of the San Andreas fault system since 30 million years ago (Ma). This is a figure from the USGS here.
  • In the lower right corner I include the Earthquake Shaking Potential map from the state of California. This is a probabilistic seismic hazard map, basically a map that shows the likelihood that there will be shaking of a given amount over a period of time. More can be found from the California Geological Survey here. I place a yellow star in the approximate location of today’s earthquake.


    Cascadia subduction zone: General Overview

  • Cascadia’s 315th Anniversary 2015.01.26
  • Cascadia’s 316th Anniversary 2016.01.26
  • Earthquake Information about the CSZ 2015.10.08

The big player this year was an M 6.5 along the Mendocino fault on 2016.12.08. Here I present an inventory of 8 earthquakes with M ≥ 5.0. There are a few additional earthquakes with smaller magnitudes that are of particular interest.

Please visit the #EarthquakeReport pages for more information about the figures that I include in the Earthquake Report interpretive posters below.


    References

  • Atwater, B.F., Musumi-Rokkaku, S., Satake, K., Tsuju, Y., Eueda, K., and Yamaguchi, D.K., 2005. The Orphan Tsunami of 1700—Japanese Clues to a Parent Earthquake in North America, USGS Professional Paper 1707, USGS, Reston, VA, 144 pp.
  • Chaytor, J.D., Goldfinger, C., Dziak, R.P., and Fox, C.G., 2004. Active deformation of the Gorda plate: Constraining deformation models with new geophysical data: Geology v. 32, p. 353-356.
  • Dengler, L.A., Moley, K.M., McPherson, R.C., Pasyanos, M., Dewey, J.W., and Murray, M., 1995. The September 1, 1994 Mendocino Fault Earthquake, California Geology, Marc/April 1995, p. 43-53.
  • Geist, E.L. and Andrews D.J., 2000. Slip rates on San Francisco Bay area faults from anelastic deformation of the continental lithosphere, Journal of Geophysical Research, v. 105, no. B11, p. 25,543-25,552.
  • Irwin, W.P., 1990. Quaternary deformation, in Wallace, R.E. (ed.), 1990, The San Andreas Fault system, California: U.S. Geological Survey Professional Paper 1515, online at: http://pubs.usgs.gov/pp/1990/1515/
  • McLaughlin, R.J., Sarna-Wojcicki, A.M., Wagner, D.L., Fleck, R.J., Langenheim, V.E., Jachens, R.C., Clahan, K., and Allen, J.R., 2012. Evolution of the Rodgers Creek–Maacama right-lateral fault system and associated basins east of the northward-migrating Mendocino Triple Junction, northern California in Geosphere, v. 8, no. 2., p. 342-373.
  • Nelson, A.R., Asquith, A.C., and Grant, W.C., 2004. Great Earthquakes and Tsunamis of the Past 2000 Years at the Salmon River Estuary, Central Oregon Coast, USA: Bulletin of the Seismological Society of America, Vol. 94, No. 4, pp. 1276–1292
  • Rollins, J.C. and Stein, R.S., 2010. Coulomb stress interactions among M ≥ 5.9 earthquakes in the Gorda deformation zone and on the Mendocino Fault Zone, Cascadia subduction zone, and northern San Andreas Fault: Journal of Geophysical Research, v. 115, B12306, doi:10.1029/2009JB007117, 2010.
  • Stoffer, P.W., 2006, Where’s the San Andreas Fault? A guidebook to tracing the fault on public lands in the San Francisco Bay region: U.S. Geological Survey General Interest Publication 16, 123 p., online at http://pubs.usgs.gov/gip/2006/16/
  • Wallace, Robert E., ed., 1990, The San Andreas fault system, California: U.S. Geological Survey Professional Paper 1515, 283 p. [http://pubs.usgs.gov/pp/1988/1434/].

Earthquake Report: Mendocino fault!

I was awake and just logging into my laptop, still in bed, when I first felt some movement. The movement was slight and not impulsive, so I thought it was a small earthquake. Then the shaking reappeared. This is when I started counting. one one-thousand, two one-thousand…. twenty one-thousand. The S-Wave lasted about 20 seconds. I thought back to the 2010 earthquake that lasted about that long and it was a M 6.5 earthquake. SO, I immediately thought this was probably a mid M 6 earthquake. However, the shaking was subdued. So, it could be a larger earthquake further away. I logged into social media and people were already contacting me. A friend felt it shake for 2 minutes in southern Oregon (so I thought it might be a large earthquake on the Blanco fracture zone, especially since there were a couple up there recently).
UPDATE: Here is my Earthquake Report Update #1
I checked the USGS website here and saw that it was closer to me (Manila, CA), along the Mendocino fault. At first it was a M 6.8, but the location and magnitude changed to an M 6.5.
This earthquake appears to have occurred along the Mendocino fault, a right-lateral (dextral) transform plate boundary. This plate boundary connects the Gorda ridge and Juan de Fuca rise spreading centers with their counterparts in the Gulf of California, with the San Andreas strike-slip fault system. Transform plate boundaries are defined that they are strike-slip and that they connect spreading ridges. In this sense of the definition, the Mendocino fault and the San Andreas fault are part of the same system. This earthquake appears to have occurred in a region of the Mendocino fault that ruptured in 1994. See the figures from Rollins and Stein below. More on earthquakes in this region can be found in Earthquake Reports listed at the bottom of this page above the appendices.
The San Andreas fault is a right-lateral strike-slip transform plate boundary between the Pacific and North America plates. The plate boundary is composed of faults that are parallel to sub-parallel to the SAF and extend from the west coast of CA to the Wasatch fault (WF) system in central Utah (the WF runs through Salt Lake City and is expressed by the mountain range on the east side of the basin that Salt Lake City is built within).
The three main faults in the region north of San Francisco are the SAF, the MF, and the Bartlett Springs fault (BSF). I also place a graphical depiction of the USGS moment tensor for this earthquake. The SAF, MF, and BSF are all right lateral strike-slip fault systems. There are no active faults mapped in the region of Sunday’s epicenter, but I interpret this earthquake to have right-lateral slip. Without more seismicity or mapped faults to suggest otherwise, this is a reasonable interpretation.
The Cascadia subduction zone is a convergent plate boundary where the Juan de Fuca and Gorda plates subduct norteastwardly beneath the North America plate at rates ranging from 29- to 45-mm/yr. The Juan de Fuca and Gorda plates are formed at the Juan de Fuca Ridge and Gorda Rise spreading centers respectively. More about the CSZ can be found here.
Below I plot the seismicity from the past month, with color representing depth and diameter representing magnitude (see legend). I use the USGS Quaternary fault and fold database for the faults.
I also include the shaking intensity contours on the map. These use the Modified Mercalli Intensity Scale (MMI; see the legend on the map). This is based upon a computer model estimate of ground motions, different from the “Did You Feel It?” estimate of ground motions that is actually based on real observations. The MMI is a qualitative measure of shaking intensity. More on the MMI scale can be found here and here. This is based upon a computer model estimate of ground motions, different from the “Did You Feel It?” estimate of ground motions that is actually based on real observations.
I placed a moment tensor / focal mechanism legend on the poster. There is more material from the USGS web sites about moment tensors and focal mechanisms (the beach ball symbols). Both moment tensors and focal mechanisms are solutions to seismologic data that reveal two possible interpretations for fault orientation and sense of motion. One must use other information, like the regional tectonics, to interpret which of the two possibilities is more likely.
This is a preliminary report and I hope to prepare some updates as I collect more information.

    I have placed several inset figures.

  • In the upper right corner is a map of the Cascadia subduction zone (CSZ) and regional tectonic plate boundary faults. This is modified from several sources (Chaytor et al., 2004; Nelson et al., 2004)
  • Below the CSZ map is an illustration modified from Plafker (1972). This figure shows how a subduction zone deforms between (interseismic) and during (coseismic) earthquakes. Today’s earthquake did not occur along the CSZ, so did not produce crustal deformation like this. However, it is useful to know this when studying the CSZ.
  • To the left of the CSZ map is the USGS Did You Feel It felt report map. This map is based upon reports submitted by real people. Note how the felt reports extend beyond the modeled estimates of MMI shaking as represented by the MMI contours on the map.
  • In the lower left corner is a figure from Dengler et al. (1995) that shows focal mechanisms from earthquakes in this region, along the Mendocino fault. Today’s earthquake is near the 1994 earthquake.
  • To the right of the Dengler et al. (1995) figure, I present a photo I took of the seismograph observed in Van Matre Hall on the Humboldt State University campus. This seismograph is operated by the HSU Department of Geology.
  • In the upper left corner is a figure from Rollins and Stein (2010). In their paper they discuss how static coulomb stress changes from earthquakes may impart (or remove) stress from adjacent crust/faults.


  • Here is a map from Rollins and Stein, showing their interpretations of different historic earthquakes in the region. This was published in response to the January 2010 Gorda plate earthquake. The faults are from Chaytor et al. (2004). The 1980, 1992, 1994, 2005, and 2010 earthquakes are plotted and labeled. I did not mention the 2010 earthquake, but it most likely was just like 1980 and 2005, a left-lateral strike-slip earthquake on a northeast striking fault.

  • Here is a large scale map of the 1994 earthquake swarm. The mainshock epicenter is a black star and epicenters are denoted as white circles.

  • Here is a plot of focal mechanisms from the Dengler et al. (1995) paper in California Geology.

  • In this map below, I label a number of other significant earthquakes in this Mendocino triple junction region. Another historic right-lateral earthquake on the Mendocino fault system was in 1994. There was a series of earthquakes possibly along the easternmost section of the Mendocino fault system in late January 2015, here is my post about that earthquake series.


    References

  • Atwater, B.F., Musumi-Rokkaku, S., Satake, K., Tsuju, Y., Eueda, K., and Yamaguchi, D.K., 2005. The Orphan Tsunami of 1700—Japanese Clues to a Parent Earthquake in North America, USGS Professional Paper 1707, USGS, Reston, VA, 144 pp.
  • Chaytor, J.D., Goldfinger, C., Dziak, R.P., and Fox, C.G., 2004. Active deformation of the Gorda plate: Constraining deformation models with new geophysical data: Geology v. 32, p. 353-356.
  • Dengler, L.A., Moley, K.M., McPherson, R.C., Pasyanos, M., Dewey, J.W., and Murray, M., 1995. The September 1, 1994 Mendocino Fault Earthquake, California Geology, Marc/April 1995, p. 43-53.
  • Geist, E.L. and Andrews D.J., 2000. Slip rates on San Francisco Bay area faults from anelastic deformation of the continental lithosphere, Journal of Geophysical Research, v. 105, no. B11, p. 25,543-25,552.
  • Irwin, W.P., 1990. Quaternary deformation, in Wallace, R.E. (ed.), 1990, The San Andreas Fault system, California: U.S. Geological Survey Professional Paper 1515, online at: http://pubs.usgs.gov/pp/1990/1515/
  • McLaughlin, R.J., Sarna-Wojcicki, A.M., Wagner, D.L., Fleck, R.J., Langenheim, V.E., Jachens, R.C., Clahan, K., and Allen, J.R., 2012. Evolution of the Rodgers Creek–Maacama right-lateral fault system and associated basins east of the northward-migrating Mendocino Triple Junction, northern California in Geosphere, v. 8, no. 2., p. 342-373.
  • Nelson, A.R., Asquith, A.C., and Grant, W.C., 2004. Great Earthquakes and Tsunamis of the Past 2000 Years at the Salmon River Estuary, Central Oregon Coast, USA: Bulletin of the Seismological Society of America, Vol. 94, No. 4, pp. 1276–1292
  • Rollins, J.C. and Stein, R.S., 2010. Coulomb stress interactions among M ≥ 5.9 earthquakes in the Gorda deformation zone and on the Mendocino Fault Zone, Cascadia subduction zone, and northern San Andreas Fault: Journal of Geophysical Research, v. 115, B12306, doi:10.1029/2009JB007117, 2010.
  • Stoffer, P.W., 2006, Where’s the San Andreas Fault? A guidebook to tracing the fault on public lands in the San Francisco Bay region: U.S. Geological Survey General Interest Publication 16, 123 p., online at http://pubs.usgs.gov/gip/2006/16/
  • Wallace, Robert E., ed., 1990, The San Andreas fault system, California: U.S. Geological Survey Professional Paper 1515, 283 p. [http://pubs.usgs.gov/pp/1988/1434/].

Earthquake Report: Petrolia (CA)

This morning there was a good shaker that was widely felt across the region. I did not feel it. I was probably driving at the time, or grading papers, which can have the same sense-deadening effect. Here is the USGS website for this M 4.3 earthquake. The earthquake occurred in an interesting part of the world, in the region of the Mendocino triple junction (MTJ) where the Cascadia subduction zone (CSZ), the San Andreas fault (SAF), and the Mendocino fault (MF) congregate. I was going to write the word “meet,” but I am not convinced that these plate boundary faults actually meet.
This earthquake appears to have occurred along the Mendocino fault, a right-lateral (dextral) transform plate boundary. This plate boundary connects the Gorda ridge and Juan de Fuca rise spreading centers with their counterparts in the Gulf of California, with the San Andreas strike-slip fault system. Transform plate boundaries are defined that they are strike-slip and that they connect spreading ridges. In this sense of the definition, the Mendocino fault and the San Andreas fault are part of the same system. This earthquake appears to have occurred in a region of the Mendocino fault that ruptured in 1994. See the figures from Rollins and Stein below. More on earthquakes in this region can be found in Earthquake Reports listed at the bottom of this page above the appendices.
The San Andreas fault is a right-lateral strike-slip transform plate boundary between the Pacific and North America plates. The plate boundary is composed of faults that are parallel to sub-parallel to the SAF and extend from the west coast of CA to the Wasatch fault (WF) system in central Utah (the WF runs through Salt Lake City and is expressed by the mountain range on the east side of the basin that Salt Lake City is built within).
The three main faults in the region north of San Francisco are the SAF, the MF, and the Bartlett Springs fault (BSF). I also place a graphical depiction of the USGS moment tensor for this earthquake. The SAF, MF, and BSF are all right lateral strike-slip fault systems. There are no active faults mapped in the region of Sunday’s epicenter, but I interpret this earthquake to have right-lateral slip. Without more seismicity or mapped faults to suggest otherwise, this is a reasonable interpretation.
The Cascadia subduction zone is a convergent plate boundary where the Juan de Fuca and Gorda plates subduct norteastwardly beneath the North America plate at rates ranging from 29- to 45-mm/yr. The Juan de Fuca and Gorda plates are formed at the Juan de Fuca Ridge and Gorda Rise spreading centers respectively. More about the CSZ can be found here.
Below I plot the seismicity from the past month, with color representing depth and diameter representing magnitude (see legend). I use the USGS Quaternary fault and fold database for the faults.
I also include the shaking intensity contours on the map. These use the Modified Mercalli Intensity Scale (MMI; see the legend on the map). This is based upon a computer model estimate of ground motions, different from the “Did You Feel It?” estimate of ground motions that is actually based on real observations. The MMI is a qualitative measure of shaking intensity. More on the MMI scale can be found here and here. This is based upon a computer model estimate of ground motions, different from the “Did You Feel It?” estimate of ground motions that is actually based on real observations.
I placed a moment tensor / focal mechanism legend on the poster. There is more material from the USGS web sites about moment tensors and focal mechanisms (the beach ball symbols). Both moment tensors and focal mechanisms are solutions to seismologic data that reveal two possible interpretations for fault orientation and sense of motion. One must use other information, like the regional tectonics, to interpret which of the two possibilities is more likely. There are two focal mechanisms for this earthquake and I include both of them on the interpretive poster below. Based on the moment tensor and my knowledge of the tectonics of this region and using the v. 2 focal mechanism, I interpret this earthquake to have had a right lateral strike slip motion along an east-west fault. However, it is equally likely that this was a northeast striking thrust fault earthquake as suggested by the v. 1 focal mechanism.

    I have placed several inset figures.

  • In the upper right corner is a map of the Cascadia subduction zone (CSZ) and regional tectonic plate boundary faults. This is modified from several sources (Chaytor et al., 2004; Nelson et al., 2004)
  • Below the CSZ map is an illustration modified from Plafker (1972). This figure shows how a subduction zone deforms between (interseismic) and during (coseismic) earthquakes. Today’s earthquake did not occur along the CSZ, so did not produce crustal deformation like this. However, it is useful to know this when studying the CSZ.
  • To the left of the CSZ map is the USGS Did You Feel It felt report map. This map is based upon reports submitted by real people. Note how the felt reports extend beyond the modeled estimates of MMI shaking as represented by the MMI contours on the map.
  • In the lower left corner is a USGS figure that shows the evolution of these plate boundary systems.
  • Above the USGS figure is a map that shows more details about the evolution of the MTJ region for the last 12 Ma (million years). This is from a paper by McLaughlin et al. (2012).


  • Here is a map from Rollins and Stein, showing their interpretations of different historic earthquakes in the region. This was published in response to the January 2010 Gorda plate earthquake. The faults are from Chaytor et al. (2004). The 1980, 1992, 1994, 2005, and 2010 earthquakes are plotted and labeled. I did not mention the 2010 earthquake, but it most likely was just like 1980 and 2005, a left-lateral strike-slip earthquake on a northeast striking fault.

  • Here is a large scale map of the 1983 earthquake swarm. The mainshock epicenter is a black star and epicenters are denoted as white circles. Note how the aftershocks trend slightly southeast in this region. Today’s swarm does the same (and the moment tensor also shows a slightly southeast strike). Note how the interpreted fault dips slightly to the north, which is the result of north-south compression from the relative northward motion of the Pacific plate.

  • Here is a large scale map of the 1994 earthquake swarm. The mainshock epicenter is a black star and epicenters are denoted as white circles.

  • Here is a plot of focal mechanisms from the Dengler et al. (1995) paper in California Geology.

  • In this map below, I label a number of other significant earthquakes in this Mendocino triple junction region. Another historic right-lateral earthquake on the Mendocino fault system was in 1994. There was a series of earthquakes possibly along the easternmost section of the Mendocino fault system in late January 2015, here is my post about that earthquake series.

  • The Gorda and Juan de Fuca plates subduct beneath the North America plate to form the Cascadia subduction zone fault system. In 1992 there was a swarm of earthquakes with the magnitude Mw 7.2 Mainshock on 4/25. Initially this earthquake was interpreted to have been on the Cascadia subduction zone (CSZ). The moment tensor shows a compressional mechanism. However the two largest aftershocks on 4/26/1992 (Mw 6.5 and Mw 6.7), had strike-slip moment tensors. These two aftershocks align on what may be the eastern extension of the Mendocino fault.
  • There have been several series of intra-plate earthquakes in the Gorda plate. Two main shocks that I plot of this type of earthquake are the 1980 (Mw 7.2) and 2005 (Mw 7.2) earthquakes. I place orange lines approximately where the faults are that ruptured in 1980 and 2005. These are also plotted in the Rollins and Stein (2010) figure above. The Gorda plate is being deformed due to compression between the Pacific plate to the south and the Juan de Fuca plate to the north. Due to this north-south compression, the plate is deforming internally so that normal faults that formed at the spreading center (the Gorda Rise) are reactivated as left-lateral strike-slip faults. In 2014, there was another swarm of left-lateral earthquakes in the Gorda plate. I posted some material about the Gorda plate setting on this page.
  • There are three types of earthquakes, strike-slip, compressional (reverse or thrust, depending upon the dip of the fault), and extensional (normal). Here is are some animations of these three types of earthquake faults. Many of the earthquakes people are familiar with in the Mendocino triple junction region are either compressional or strike slip. The following three animations are from IRIS.
  • Strike Slip:

    Compressional:

    Extensional:

  • This figure shows what a transform plate boundary fault is. Looking down from outer space, the crust on either side of the fault moves side-by-side. When one is standing on the ground, on one side of the fault, looking across the fault as it moves… If the crust on the other side of the fault moves to the right, the fault is a “right lateral” strike slip fault. The Mendocino and San Andreas faults are right-lateral (dextral) strike-slip faults. I believe this is from Pearson Higher Ed.

  • Here is a map from McLaughlin et al. (2012) that shows the regional faulting. I include the figure caption as a blockquote below.

  • Maps showing the regional setting of the Rodgers Creek–Maacama fault system and the San Andreas fault in northern California. (A) The Maacama (MAFZ) and Rodgers Creek (RCFZ) fault zones and related faults (dark red) are compared to the San Andreas fault, former and present positions of the Mendocino Fracture Zone (MFZ; light red, offshore), and other structural features of northern California. Other faults east of the San Andreas fault that are part of the wide transform margin are collectively referred to as the East Bay fault system and include the Hayward and proto-Hayward fault zones (green) and the Calaveras (CF), Bartlett Springs, and several other faults (teal). Fold axes (dark blue) delineate features associated with compression along the northern and eastern sides of the Coast Ranges. Dashed brown line marks inferred location of the buried tip of an east-directed tectonic wedge system along the boundary between the Coast Ranges and Great Valley (Wentworth et al., 1984; Wentworth and Zoback, 1990). Dotted purple line shows the underthrust south edge of the Gorda–Juan de Fuca plate, based on gravity and aeromagnetic data (Jachens and Griscom, 1983). Late Cenozoic volcanic rocks are shown in pink; structural basins associated with strike-slip faulting and Sacramento Valley are shown in yellow. Motions of major fault blocks and plates relative to fi xed North America, from global positioning system and paleomagnetic studies (Argus and Gordon, 2001; Wells and Simpson, 2001; U.S. Geological Survey, 2010), shown with thick black arrows; circled numbers denote rate (in mm/yr). Restraining bend segment of the northern San Andreas fault is shown in orange; releasing bend segment is in light blue. Additional abbreviations: BMV—Burdell Mountain Volcanics; QSV—Quien Sabe Volcanics. (B) Simplifi ed map of color-coded faults in A, delineating the principal fault systems and zones referred to in this paper.

  • Here is the figure showing the evolution of the SAF since its inception about 29 Ma. I include the USGS figure caption below as a blockquote.

  • EVOLUTION OF THE SAN ANDREAS FAULT.
    This series of block diagrams shows how the subduction zone along the west coast of North America transformed into the San Andreas Fault from 30 million years ago to the present. Starting at 30 million years ago, the westward- moving North American Plate began to override the spreading ridge between the Farallon Plate and the Pacific Plate. This action divided the Farallon Plate into two smaller plates, the northern Juan de Fuca Plate (JdFP) and the southern Cocos Plate (CP). By 20 million years ago, two triple junctions began to migrate north and south along the western margin of the West Coast. (Triple junctions are intersections between three tectonic plates; shown as red triangles in the diagrams.) The change in plate configuration as the North American Plate began to encounter the Pacific Plate resulted in the formation of the San Andreas Fault. The northern Mendicino Triple Junction (M) migrated through the San Francisco Bay region roughly 12 to 5 million years ago and is presently located off the coast of northern California, roughly midway between San Francisco (SF) and Seattle (S). The Mendicino Triple Junction represents the intersection of the North American, Pacific, and Juan de Fuca Plates. The southern Rivera Triple Junction (R) is presently located in the Pacific Ocean between Baja California (BC) and Manzanillo, Mexico (MZ). Evidence of the migration of the Mendicino Triple Junction northward through the San Francisco Bay region is preserved as a series of volcanic centers that grow progressively younger toward the north. Volcanic rocks in the Hollister region are roughly 12 million years old whereas the volcanic rocks in the Sonoma-Clear Lake region north of San Francisco Bay range from only few million to as little as 10,000 years old. Both of these volcanic areas and older volcanic rocks in the region are offset by the modern regional fault system. (Image modified after original illustration by Irwin, 1990 and Stoffer, 2006.)

    • Here is a map that shows the shaking potential for earthquakes in CA. This comes from the state of California here.
    • Earthquake shaking hazards are calculated by projecting earthquake rates based on earthquake history and fault slip rates, the same data used for calculating earthquake probabilities. New fault parameters have been developed for these calculations and are included in the report of the Working Group on California Earthquake Probabilities. Calculations of earthquake shaking hazard for California are part of a cooperative project between USGS and CGS, and are part of the National Seismic Hazard Maps. CGS Map Sheet 48 (revised 2008) shows potential seismic shaking based on National Seismic Hazard Map calculations plus amplification of seismic shaking due to the near surface soils.


      References

    • Geist, E.L. and Andrews D.J., 2000. Slip rates on San Francisco Bay area faults from anelastic deformation of the continental lithosphere, Journal of Geophysical Research, v. 105, no. B11, p. 25,543-25,552.
    • Irwin, W.P., 1990. Quaternary deformation, in Wallace, R.E. (ed.), 1990, The San Andreas Fault system, California: U.S. Geological Survey Professional Paper 1515, online at: http://pubs.usgs.gov/pp/1990/1515/
    • McLaughlin, R.J., Sarna-Wojcicki, A.M., Wagner, D.L., Fleck, R.J., Langenheim, V.E., Jachens, R.C., Clahan, K., and Allen, J.R., 2012. Evolution of the Rodgers Creek–Maacama right-lateral fault system and associated basins east of the northward-migrating Mendocino Triple Junction, northern California in Geosphere, v. 8, no. 2., p. 342-373.
    • Stoffer, P.W., 2006, Where’s the San Andreas Fault? A guidebook to tracing the fault on public lands in the San Francisco Bay region: U.S. Geological Survey General Interest Publication 16, 123 p., online at http://pubs.usgs.gov/gip/2006/16/
    • Wallace, Robert E., ed., 1990, The San Andreas fault system, California: U.S. Geological Survey Professional Paper 1515, 283 p. [http://pubs.usgs.gov/pp/1988/1434/].

Earthquake Report: Mendocino fault!

Yesterday there was an earthquake along the eastern extension of the Mendocino fault system. This magnitude M = 4.1 earthquake (here is the USGS website for this earthquake) is a small magnitude, but it was widely felt. I was in Manila (CA) at the time, so I am surprised that I did not feel it. I was in the bath at the time, so maybe my shampooing was too energetic?
This earthquake appears to have occurred along the Mendocino fault, a right-lateral (dextral) transform plate boundary. This plate boundary connects the Gorda ridge and Juan de Fuca rise spreading centers with their counterparts in the Gulf of California, with the San Andreas strike-slip fault system. Transform plate boundaries are defined that they are strike-slip and that they connect spreading ridges. In this sense of the definition, the Mendocino fault and the San Andreas fault are part of the same system. This earthquake appears to have occurred in a region of the Mendocino fault that ruptured in 1994. See the figures from Rollins and Stein below.
Below is my interpretive map that shows the epicenter, along with the shaking intensity contours. These contours use the Modified Mercalli Intensity (MMI) scale. The MMI is a qualitative measure of shaking intensity. More on the MMI scale can be found here and here. This is based upon a computer model estimate of ground motions, different from the “Did You Feel It?” estimate of ground motions that is actually based on real observations.
I placed a moment tensor / focal mechanism legend on the poster. There is more material from the USGS web sites about moment tensors and focal mechanisms (the beach ball symbols). Both moment tensors and focal mechanisms are solutions to seismologic data that reveal two possible interpretations for fault orientation and sense of motion. One must use other information, like the regional tectonics, to interpret which of the two possibilities is more likely. Based on the moment tensor and my knowledge of the tectonics of this region, I interpret this earthquake to have had a right lateral strike slip motion along an east-west fault.

    I have placed several inset figures.

  • In the upper right corner is a map of the Cascadia subduction zone (CSZ) and regional tectonic plate boundary faults. This is modified from several sources (Chaytor et al., 2004; Nelson et al., 2004)
  • Below the CSZ map is an illustration modified from Plafker (1972). This figure shows how a subduction zone deforms between (interseismic) and during (coseismic) earthquakes. Today’s earthquake did not occur along the CSZ, so did not produce crustal deformation like this. However, it is useful to know this when studying the CSZ.
  • In the lower left corner is a map from Rollins and Stein (2010), showing their interpretations of different historic earthquakes in the region. This was published in response to the January 2010 Gorda plate earthquake. Today’s earthquake is near the 1983 earthquake.
  • Above the Rollins and Stein figure are two USGS plots. The upper plot shows a map displaying the “Did You Feel It?” felt reports. The color scale is the same as for the MMI legend in the upper left corner. The lower plot shows how the shaking intensity attenuates (diminishes) with distance from the epicenter.


  • Here is a map from Rollins and Stein, showing their interpretations of different historic earthquakes in the region. This was published in response to the January 2010 Gorda plate earthquake. The faults are from Chaytor et al. (2004). The 1980, 1992, 1994, 2005, and 2010 earthquakes are plotted and labeled. I did not mention the 2010 earthquake, but it most likely was just like 1980 and 2005, a left-lateral strike-slip earthquake on a northeast striking fault.

  • Here is a large scale map of the 1983 earthquake swarm. The mainshock epicenter is a black star and epicenters are denoted as white circles. Note how the aftershocks trend slightly southeast in this region. Today’s swarm does the same (and the moment tensor also shows a slightly southeast strike). Note how the interpreted fault dips slightly to the north, which is the result of north-south compression from the relative northward motion of the Pacific plate.

  • Here is a large scale map of the 1994 earthquake swarm. The mainshock epicenter is a black star and epicenters are denoted as white circles.

  • Here is a plot of focal mechanisms from the Dengler et al. (1995) paper in California Geology.

  • In this map below, I label a number of other significant earthquakes in this Mendocino triple junction region. Another historic right-lateral earthquake on the Mendocino fault system was in 1994. There was a series of earthquakes possibly along the easternmost section of the Mendocino fault system in late January 2015, here is my post about that earthquake series.

  • The Gorda and Juan de Fuca plates subduct beneath the North America plate to form the Cascadia subduction zone fault system. In 1992 there was a swarm of earthquakes with the magnitude Mw 7.2 Mainshock on 4/25. Initially this earthquake was interpreted to have been on the Cascadia subduction zone (CSZ). The moment tensor shows a compressional mechanism. However the two largest aftershocks on 4/26/1992 (Mw 6.5 and Mw 6.7), had strike-slip moment tensors. These two aftershocks align on what may be the eastern extension of the Mendocino fault.
  • There have been several series of intra-plate earthquakes in the Gorda plate. Two main shocks that I plot of this type of earthquake are the 1980 (Mw 7.2) and 2005 (Mw 7.2) earthquakes. I place orange lines approximately where the faults are that ruptured in 1980 and 2005. These are also plotted in the Rollins and Stein (2010) figure above. The Gorda plate is being deformed due to compression between the Pacific plate to the south and the Juan de Fuca plate to the north. Due to this north-south compression, the plate is deforming internally so that normal faults that formed at the spreading center (the Gorda Rise) are reactivated as left-lateral strike-slip faults. In 2014, there was another swarm of left-lateral earthquakes in the Gorda plate. I posted some material about the Gorda plate setting on this page.
  • There are three types of earthquakes, strike-slip, compressional (reverse or thrust, depending upon the dip of the fault), and extensional (normal). Here is are some animations of these three types of earthquake faults. Many of the earthquakes people are familiar with in the Mendocino triple junction region are either compressional or strike slip. The following three animations are from IRIS.
  • Strike Slip:

    Compressional:

    Extensional:

  • This figure shows what a transform plate boundary fault is. Looking down from outer space, the crust on either side of the fault moves side-by-side. When one is standing on the ground, on one side of the fault, looking across the fault as it moves… If the crust on the other side of the fault moves to the right, the fault is a “right lateral” strike slip fault. The Mendocino and San Andreas faults are right-lateral (dextral) strike-slip faults. I believe this is from Pearson Higher Ed.


    References:

  • Atwater, B.F., Musumi-Rokkaku, S., Satake, K., Tsuju, Y., Eueda, K., and Yamaguchi, D.K., 2005. The Orphan Tsunami of 1700—Japanese Clues to a Parent Earthquake in North America, USGS Professional Paper 1707, USGS, Reston, VA, 144 pp.
  • Chaytor, J.D., Goldfinger, C., Dziak, R.P., and Fox, C.G., 2004. Active deformation of the Gorda plate: Constraining deformation models with new geophysical data: Geology v. 32, p. 353-356.
  • Dengler, L.A., Moley, K.M., McPherson, R.C., Pasyanos, M., Dewey, J.W., and Murray, M., 1995. The September 1, 1994 Mendocino Fault Earthquake, California Geology, Marc/April 1995, p. 43-53.
  • Nelson, A.R., Asquith, A.C., and Grant, W.C., 2004. Great Earthquakes and Tsunamis of the Past 2000 Years at the Salmon River Estuary, Central Oregon Coast, USA: Bulletin of the Seismological Society of America, Vol. 94, No. 4, pp. 1276–1292
  • Rollins, J.C. and Stein, R.S., 2010. Coulomb stress interactions among M ≥ 5.9 earthquakes in the Gorda deformation zone and on the Mendocino Fault Zone, Cascadia subduction zone, and northern San Andreas Fault: Journal of Geophysical Research, v. 115, B12306, doi:10.1029/2009JB007117, 2010.

Earthquake Report: Gorda Plate!

Last night, while I was preparing an online exam for my students to take while I am at the Geological Society of America Annual Meeting in Denver Colorado, there were a couple earthquakes in the Gorda plate offshore of northern California.

    Here are the USGS web pages for the earthquakes plotted in my interpretive poster below. The two from last night are in the Gorda plate and there is also a recent earthquake associated with the Mendocino fault. Here is my report for the M 5.6 Mendocino fault earthquake.

  • 2019.09.25 M 5.0 Gorda plate
  • 2019.09.25 M 4.6 Gorda plate
  • 2016.09.03 M 5.6 Mendocino fault

Below is my interpretive poster for this earthquake. I include faults from the USGS quaternary fault and fold database. The two earthquakes do not appear to be along the same fault plane, if my interpretation is correct. This leads me to think that perhaps these earthquakes are possibly on faults antithetic to the regional structural grain.
I placed a moment tensor / focal mechanism legend on the poster. There is more material from the USGS web sites about moment tensors and focal mechanisms (the beach ball symbols). Both moment tensors and focal mechanisms are solutions to seismologic data that reveal two possible interpretations for fault orientation and sense of motion. One must use other information, like the regional tectonics, to interpret which of the two possibilities is more likely. Given our knowledge of the tectonics of this region, I interpret this earthquake to be a left-lateral strike-slip earthquake in the Gorda plate. I include some figures below that show evidence that supports this interpretation.


Here is a map of the Cascadia subduction zone, modified from Nelson et al. (2006). The Juan de Fuca and Gorda plates subduct norteastwardly beneath the North America plate at rates ranging from 29- to 45-mm/yr. Sites where evidence of past earthquakes (paleoseismology) are denoted by white dots. Where there is also evidence for past CSZ tsunami, there are black dots. These paleoseismology sites are labeled (e.g. Humboldt Bay). Some submarine paleoseismology core sites are also shown as grey dots. The two main spreading ridges are not labeled, but the northern one is the Juan de Fuca ridge (where oceanic crust is formed for the Juan de Fuca plate) and the southern one is the Gorda rise (where the oceanic crust is formed for the Gorda plate).


Here is a version of the CSZ cross section alone (Plafker, 1972). This shows two parts of the earthquake cycle: the interseismic part (between earthquakes) and the coseismic part (during earthquakes). Regions that experience uplift during the interseismic period tend to experience subsidence during the coseismic period.


Here is a map from Chaytor et al. (2004) that shows some details of the faulting in the region. The moment tensor (at the moment i write this) shows a north-south striking fault with a reverse or thrust faulting mechanism. While this region of faulting is dominated by strike slip faults (and most all prior earthquake moment tensors showed strike slip earthquakes), when strike slip faults bend, they can create compression (transpression) and extension (transtension). This transpressive or transtentional deformation may produce thrust/reverse earthquakes or normal fault earthquakes, respectively. The transverse ranges north of Los Angeles are an example of uplift/transpression due to the bend in the San Andreas fault in that region.


These are the models for tectonic deformation within the Gorda plate as presented by Jason Chaytor in 2004.
Mw = 5 Trinidad Chaytor
Here is a map from Rollins and Stein, showing their interpretations of different historic earthquakes in the region. This was published in response to the Januray 2010 Gorda plate earthquake. The faults are from Chaytor et al. (2004).


In this map below, I label a number of other significant earthquakes in this Mendocino triple junction region. Another historic right-lateral earthquake on the Mendocino fault system was in 1994. There was a series of earthquakes possibly along the easternmost section of the Mendocino fault system in late January 2015, here is my post about that earthquake series.


The Gorda and Juan de Fuca plates subduct beneath the North America plate to form the Cascadia subduction zone fault system. In 1992 there was a swarm of earthquakes with the magnitude Mw 7.2 Mainshock on 4/25. Initially this earthquake was interpreted to have been on the Cascadia subduction zone (CSZ). The moment tensor shows a compressional mechanism. However the two largest aftershocks on 4/26/1992 (Mw 6.5 and Mw 6.7), had strike-slip moment tensors. These two aftershocks align on what may be the eastern extension of the Mendocino fault.
There have been several series of intra-plate earthquakes in the Gorda plate. Two main shocks that I plot of this type of earthquake are the 1980 (Mw 7.2) and 2005 (Mw 7.2) earthquakes. I place orange lines approximately where the faults are that ruptured in 1980 and 2005. These are also plotted in the Rollins and Stein (2010) figure above. The Gorda plate is being deformed due to compression between the Pacific plate to the south and the Juan de Fuca plate to the north. Due to this north-south compression, the plate is deforming internally so that normal faults that formed at the spreading center (the Gorda Rise) are reactivated as left-lateral strike-slip faults. In 2014, there was another swarm of left-lateral earthquakes in the Gorda plate. I posted some material about the Gorda plate setting on this page.
There are three types of earthquakes, strike-slip, compressional (reverse or thrust, depending upon the dip of the fault), and extensional (normal). Here is are some animations of these three types of earthquake faults. Many of the earthquakes people are familiar with in the Mendocino triple junction region are either compressional or strike slip. The following three animations are from IRIS.
Strike Slip:

Compressional:

Extensional:


    References:

  • Atwater, B.F., Musumi-Rokkaku, S., Satake, K., Tsuju, Y., Eueda, K., and Yamaguchi, D.K., 2005. The Orphan Tsunami of 1700—Japanese Clues to a Parent Earthquake in North America, USGS Professional Paper 1707, USGS, Reston, VA, 144 pp.
  • Burgette, R. et al., 2009. Interseismic uplift rates for western Oregon and along-strike variation in locking on the Cascadia subduction zone in Journal of Geophysical Research, v. 114, B01408, doi:10.1029/2008JB005679
  • Chaytor, J.D., Goldfinger, C., Dziak, R.P., and Fox, C.G., 2004. Active deformation of the Gorda plate: Constraining deformation models with new geophysical data: Geology v. 32, p. 353-356
  • Goldfinger, C., Nelson, C.H., Morey, A., Johnson, J.E., Gutierrez-Pastor, J., Eriksson, A.T., Karabanov, E., Patton, J., Gràcia, E., Enkin, R., Dallimore, A., Dunhill, G., and Vallier, T., 2012. Turbidite Event History: Methods and Implications for Holocene Paleoseismicity of the Cascadia Subduction Zone, USGS Professional Paper # 1661F. U.S. Geological Survey, Reston, VA, 184 pp.
  • McCrory, P. A., Blair, J. L., Oppenheimer, D. H., and Walter, S. R., 2006. Depth to the Juan de Fuca slab beneath the Cascadia subduction margin; a 3-D model for sorting earthquakes U. S. Geological Survey
  • Nelson, A.R., Kelsey, H.M., and Witter, R.C., 2006. Great earthquakes of variable magnitude at the Cascadia subduction zone: Quaternary Research, doi:10.1016/j.yqres.2006.02.009, p. 354-365.
  • Plafker, G., 1972. Alaskan earthquake of 1964 and Chilean earthquake of 1960: Implications for arc tectonics in Journal of Geophysical Research, v. 77, p. 901-925.
  • Rollins, J.C., Stein, R.S., 2010. Coulomb Stress Interactions Among M ≥ 5.9 Earthquakes in the Gorda Deformation Zone and on the Mendocino Fault Zone, Cascadia Subduction Zone, and Northern San Andreas Fault. Journal of Geophysical Research 115, 19 pp.
  • USGS Quaternary Fault Database: http://earthquake.usgs.gov/hazards/qfaults/
  • Wang, K., Wells, R., Mazzotti, S., Hyndman, R. D., and Sagiya, T., 2003. A revised dislocation model of interseismic deformation of the Cascadia subduction zone Journal of Geophysical Research, B, Solid Earth and Planets v. 108, no. 1.

Earthquake Report: Bayside (northern California): Update #1

So, I put together another map with today’s earthquake in context with the historic seismicity and some other factors. Now the USGS magnitude is M = 4.7 and there is a moment tensor for this earthquake (that looks very similar to the focal mechanism, which is not always the case.). Here is my initial earthquake report here.
Below is a map showing the Northern California Earthquake Data Center (NCEDC) seismicity plotted. Today’s M 4.7 earthquake is plotted as a yellow star. This earthquake is similar to other earthquakes plotted in this region.

    Here are the data plotted on the map.

  • Northern California Earthquake Data Center Double Differenced earthquake epicenters, using the Northern California Earthquake Catalog (1984-2014). These epicenters are located by using the double difference method. Basically, earthquakes from a similar region are processed in such a way that, because they are in a similar region it is assumed that the seismic waves/rays travel through the same material (i.e. with the same seismic velocity). With this assumption, their positions can be better determined. These better positions are better relative to each other, but not in an absolute way. Here is an overview of the double difference method from Lamont Doherty. There is a software program that people use to process seismic data for this method (HypoDD).
  • These earthquake epicenters are plotted vs depth with color and magnitude with circle diameter.
  • I plot the depth to the slab in purple. These lines represent an estimate of the depth of the Cascadia subduction zone fault (McCrory et al., 2006).
  • I also plot the current USGS active fault and fold database. The offshore fault map is incomplete, but has been remapped by Dr. Chris Goldfinger and will be released by the USGS in the coming months. I cannot plot the new faults until it is officially released. These faults are in red and then I also plot the faults used by the USGS national seismic hazard map team in black.
  • On the eastern part of the map one may observe the non-volcanic tremor interpreted by the Pacific Northwest Seismic Network. These data can be downloaded by anyone. There is also a great online interface that lets one create animations. These tremor are basically small earthquakes that are not as resolvable on seismographs, so they cannot be located like regular earthquakes. Because of this, these tremor locations are only epicenters (no depth information).
  • The background data are topographic data and bathmetric data compiled by Dr. Jason Chaytor when he was working at the Active Tectonics Lab at Oregon State University.


    I also include some inset figures.

  • In the upper left corner I place a map of the Cascadia subduction zone. This map shows the Cascadia subduction zone, along with other major plate boundary faults in the region (Gorda Rise, Mendocino fault, San Andreas fault). The Juan de Fuca and Gorda plates subduct norteastwardly beneath the North America plate at rates ranging from 29- to 45-mm/yr. Sites where evidence of past earthquakes (paleoseismology) are denoted by white dots. Where there is also evidence for past CSZ tsunami, there are black dots. These paleoseismology sites are labeled (e.g. Humboldt Bay). Some submarine paleoseismology core sites are also shown as grey dots. The two main spreading ridges are not labeled, but the northern one is the Juan de Fuca ridge (where oceanic crust is formed for the Juan de Fuca plate) and the southern one is the Gorda rise (where the oceanic crust is formed for the Gorda plate). The map also shows the interpretation of faults that are part of the internally deforming Gorda plate. These faults within the Gorda plate are responsible for the large damaging earthquakes in 1980, 2005, and 2010 (others also in 2014, and 2015).
  • In the upper right corner I place a figure from Rollins and Stein (2010) that shows their interpretations for some earthquakes in this region. This was published in response to the January 2010 Gorda plate earthquake. The faults are from Chaytor et al. (2004). The 1980, 1992, 1994, 2005, and 2010 earthquakes are plotted and labeled.
  • In the lower left corner I place a figure from Chaytor et al. (2004) that shows their interpretation of the tectonics of the Gorda plate based upon high resolution bathymetric data (showing the shape of the seafloor).
  • I also include the moment tensor and a moment tensor legend. There is more material from the USGS web sites about moment tensors and focal mechanisms (the beach ball symbols). Both moment tensors and focal mechanisms are solutions to seismologic data that reveal two possible interpretations for fault orientation and sense of motion. One must use other information, like the regional tectonics, to interpret which of the two possibilities is more likely.

Here is my initial earthquake report map as presented in the first earthquake report here.


Here is the seismic record from Jaime Wayne’s Netquake Seismometer. Here is a link to the netquake page. The seismometer is located near Orick.


In this map below (from a Mendocino fault earthquake on 2016/01/01), I label a number of other significant earthquakes in this Mendocino triple junction region. Another historic right-lateral earthquake on the Mendocino fault system was in 1994. There was a series of earthquakes possibly along the easternmost section of the Mendocino fault system in late January 2015, here is my post about that earthquake series.

References:

  • Chaytor, J.D., Goldfinger, C., Dziak, R.P., Fox, C.G., 2004. Active deformation of the Gorda plate: Constraining deformation models with new geophysical data. Geology 32, 353-356.
  • McCrory, P. A., Blair, J. L., Oppenheimer, D. H., and Walter, S. R., 2006. Depth to the Juan de Fuca slab beneath the Cascadia subduction margin; a 3-D model for sorting earthquakes U. S. Geological Survey
  • Nelson, A.R., Kelsey, H.M., Witter, R.C., 2006. Great earthquakes of variable magnitude at the Cascadia subduction zone. Quaternary Research 65, 354-365.
  • Rollins, J.C., Stein, R.S., 2010. Coulomb Stress Interactions Among M ≥ 5.9 Earthquakes in the Gorda Deformation Zone and on the Mendocino Fault Zone, Cascadia Subduction Zone, and Northern San Andreas Fault. Journal of Geophysical Research 115, 19 pp.

Earthquake Report: Bayside (northern California)

Well, after installing a stilling basin for our new tide gage installation at Trinidad, CA, I was napping in my upstairs bedroom in Manila, CA. I was awakened by a short (2-3 second) short shaking earthquake. Turns out it was a M 4.8 earthquake east-southeast of my residence. Here is the USGS website for this earthquake. The depth is currently set at about 23 km, so it is near the megathrust, but is probably in the Gorda plate. There was an earthquake in this region last October, which had a different focal mechanism and was to the north a few kms.
#Update 1. I looked at the map at the bottom of this report. Today’s earthquake plots close to where the megathrust is estimated to be between 15 and 20 km (McCrory et al., 2006). So, I was correct that this earthquake is in the downgoing Gorda plate.
#Update 2. The map now has a moment tensor (blue) instead of a focal mechanism (orange). Now I am thinking that this could possibly be on an east-west fault since it is more aligned with the Mendocino fault. However, I am sticking with my initial interpretation as most of the earthquakes that we know about in the Gorda plate are northeast striking left-lateral strike slip faults.

    I put together this quick earthquake poster for this earthquake and have a few brief inset figures.

  • In the upper left corner I place a map of the Cascadia subduction zone. I discuss this figure below.
  • In the upper right corner I place three figures. These three maps each show a different measure of the ground shaking using the Modified Mercalli Intensity Scale. The MMI is a qualitative measure of shaking intensity. More on the MMI scale can be found here and here.
      From left to right:

    1. The “Did You Feel It?” map. This is a map that shows the ground shaking based upon peoples’ online reporting.
    2. The Shake Map. This map shows a computer modeled estimate of the ground shaking.
    3. The MMI contour map.
    4. In the lower right corner I show the attenuation with distance plot. This is a plot showing how the ground motions attenuate (lessen) with distance from the earthquake. The orange line is an estimate of the intensity of ground motions based on a numerical model. This numerical model is based on a regression of hundreds of earthquakes (distance vs. magnitude/intensity). These regressions form the basis for Ground Motion Prediction Equations (GMPEs). The blue dots are the actual observations made by real people (using the DYFI form that I posted above). These model based estimates of ground shaking intensity are used, especially for larger earthquakes, to determine what damage might be expected.
    5. I placed a moment tensor / focal mechanism legend in the upper right corner of the map. There is more material from the USGS web sites about moment tensors and focal mechanisms (the beach ball symbols). Both moment tensors and focal mechanisms are solutions to seismologic data that reveal two possible interpretations for fault orientation and sense of motion. One must use other information, like the regional tectonics, to interpret which of the two possibilities is more likely. I suspect that this is probably a left lateral strike slip earthquake based upon the focal mechanism and our knowledge of the tectonics of the Gorda plate.


      Here is the record from the seismometer located across the hallway from the HSU Dept of Geology Office. The seismograph is located in Van Matre Hall. Photo Credit Dr. Mark Hemphill-Haley.


      Here I have a summary of earthquakes for this region (including an earthquake in the Explorer plate to the north).


      I present material about the Cascadia subduction zone for the Friends of the Arcata Marsh (FOAM) held on 7/22/16 at the Arcata Marsh Interpretive Center. This page has some supporting material from this presentation, including the digital presentation file. The material in this post is also found on this page here.


      Here is a map of the Cascadia subduction zone, modified from Nelson et al. (2004). The Juan de Fuca and Gorda plates subduct norteastwardly beneath the North America plate at rates ranging from 29- to 45-mm/yr. Sites where evidence of past earthquakes (paleoseismology) are denoted by white dots. Where there is also evidence for past CSZ tsunami, there are black dots. These paleoseismology sites are labeled (e.g. Humboldt Bay). Some submarine paleoseismology core sites are also shown as grey dots. The two main spreading ridges are not labeled, but the northern one is the Juan de Fuca ridge (where oceanic crust is formed for the Juan de Fuca plate) and the southern one is the Gorda rise (where the oceanic crust is formed for the Gorda plate).


      Here is a version of the CSZ cross section alone (Plafker, 1972). This shows two parts of the earthquake cycle: the interseismic part (between earthquakes) and the coseismic part (during earthquakes). Regions that experience uplift during the interseismic period tend to experience subsidence during the coseismic period.


      This figure shows how a subduction zone deforms between (interseismic) and during (coseismic) earthquakes. We also can see how a subduction zone generates a tsunami. Atwater et al., 2005.


      Here is an animation produced by the folks at Cal Tech following the 2004 Sumatra-Andaman subduction zone earthquake. I have several posts about that earthquake here and here. One may learn more about this animation, as well as download this animation here.

      This figure shows the regions that participate in this interseismic and coseismic deformation at Cascadia. Atwater et al., 2005. Black dots on the map show sites where evidence for coseismic subsidence has been found in coastal marshes, lakes, and estuaries.


      Here is a map showing a number of data sets. Seismicity is plotted versus depth (NCEDC). Tremor is plotted (Pacific Northwest Seismic Network). Vertical Deformation rates are plotted (unpublished). Slab depth contours (km) are plotted (McCrory et al., 2006). Fault locking zones are plotted (Wang et al., 2003; Burgette et al., 2009). Bob McPherson (Humboldt State University, Department of Geology) is currently working on a research paper where he will discuss how the seismicity reveals the location of the seismogenically locked fault zone.


      This map shows the various possible prehistoric earthquake rupture regions (patches) for the past 10,000 years. Goldfinger et al., 2012. These rupture scenarios have been adopted by the USGS hazards team that determines the seismic hazards for the USA.

        References:

      • Atwater, B.F., Musumi-Rokkaku, S., Satake, K., Tsuju, Y., Eueda, K., and Yamaguchi, D.K., 2005. The Orphan Tsunami of 1700—Japanese Clues to a Parent Earthquake in North America, USGS Professional Paper 1707, USGS, Reston, VA, 144 pp.
      • Burgette, R. et al., 2009. Interseismic uplift rates for western Oregon and along-strike variation in locking on the Cascadia subduction zone in Journal of Geophysical Research, v. 114, B01408, doi:10.1029/2008JB005679
      • Chaytor, J.D., Goldfinger, C., Dziak, R.P., and Fox, C.G., 2004. Active deformation of the Gorda plate: Constraining deformation models with new geophysical data: Geology v. 32, p. 353-356
      • Goldfinger, C., Nelson, C.H., Morey, A., Johnson, J.E., Gutierrez-Pastor, J., Eriksson, A.T., Karabanov, E., Patton, J., Gràcia, E., Enkin, R., Dallimore, A., Dunhill, G., and Vallier, T., 2012. Turbidite Event History: Methods and Implications for Holocene Paleoseismicity of the Cascadia Subduction Zone, USGS Professional Paper # 1661F. U.S. Geological Survey, Reston, VA, 184 pp.
      • McCrory, P. A., Blair, J. L., Oppenheimer, D. H., and Walter, S. R., 2006. Depth to the Juan de Fuca slab beneath the Cascadia subduction margin; a 3-D model for sorting earthquakes U. S. Geological Survey
      • Nelson, A.R., Kelsey, H.M., and Witter, R.C., 2006. Great earthquakes of variable magnitude at the Cascadia subduction zone: Quaternary Research, doi:10.1016/j.yqres.2006.02.009, p. 354-365.
      • Plafker, G., 1972. Alaskan earthquake of 1964 and Chilean earthquake of 1960: Implications for arc tectonics in Journal of Geophysical Research, v. 77, p. 901-925.
      • USGS Quaternary Fault Database: http://earthquake.usgs.gov/hazards/qfaults/
      • Wang, K., Wells, R., Mazzotti, S., Hyndman, R. D., and Sagiya, T., 2003. A revised dislocation model of interseismic deformation of the Cascadia subduction zone Journal of Geophysical Research, B, Solid Earth and Planets v. 108, no. 1.