Earthquake Report: Gorda Rise

It was a busy week (usual, right?). The previous week I was working on getting a house remodel done so someone could move in (they have been sleeping on couches for 6 months, so want to get them in asap). This week I spent lots of time putting final touches on a USGS National Earthquake Hazards Reduction Program external grant proposal together, proposing to conduct a paleoseismic investigation for a fault I discovered in late 2018 (see AGU poster here). So, I am catching up on my earthquake reporting for this earthquake offshore northern California.
On 18 May 2020 there was a magnitude M 5.5 extensional earthquake located near the Gorda Rise, an oceanic spreading ridge where oceanic crust is formed to create (love using the word create in science) the Gorda and Pacific plates.
https://earthquake.usgs.gov/earthquakes/eventpage/us70009jgy/executive
There are three types of plate boundaries and three types of earthquake faults (this is not a coincidence because plate boundaries are generally in the form of earthquake faults).

  1. Some plates move side-by-side to form transform plate boundaries (in the form of strike-slip faults, like the San Andreas fault).
  2. Some plates move towards each other to form convergent plate boundaries (in the form of subduction zone megathrust faults (like the Cascadia subduction zone), or collision zones(like the fault system that forms the uplift that created the Himalayas).
  3. Some plates move away from each other to form divergent plate boundaries (in the form of oceanic spreading ridges, or spreading centers, like the Mid Atlantic Ridge or the Gorda Rise; in these locations “normal” faults are formed).

More about different types of faults can be found here.
The northeast Pacific (aka Pacific Northwest as viewed by land lubbers) is dominated by the plate boundary formed between the Pacific (PP) and North America plates (NAP). In much of California, this plate boundary is realized in the form of the San Andreas fault (SAF), where the PP moves north relative to the NAP. Both plates are moving to the northwest, but the PP is moving faster, so it appears that the NAP is moving south. This southerly motion is relative not absolute. I present a background of the SAF in my review of the 1906 San Francisco earthquake here.
Near Cape Mendocino, in Humboldt County, California, the plate boundary gets more complicated and involves all three types of fault systems.
It appears that the San Andreas fault terminates in the King Range, causing some of the highest tectonic uplift rates in North America. There are sibling faults to the east of the San Andreas that continue further north (e.g. the Maacama fault turns into the Garberville fault and the Bartlett Springs fault (eventually) turns into the Bald Mountain/Big Lagoon fault. So, it looks like these San Andreas related faults extend offshore, possibly to at least the Oregon border. Geodetic evidence supports this, as first published by Williams et al. (2002).
The San Andreas ends near the beginning of the Cascadia subduction zone (CSZ), formed where the Gorda/Juan de Fuca/Explorer plates dive eastwards beneath the North America plate. More about the CSZ can be found here, where I describe the basis of our knowledge about prehistoric earthquakes and tsunami along the CSZ.
Far offshore of the CSZ are oceanic spreading ridges, the Gorda Rise and the Juan de Fuca Ridge. Because the plates are moving away from each other here (we think this is due to processes called slab pull and ridge push; slab pull describes the process that in the subduction zone, the downgoing oceanic plate is going deep into the mantle and pulling down the crust; ridge push is not really pushing from the ridge, but that there is additional mass added to the crust and this pushes down and then out, pushing the plate away from the ridge, towards the subduction zone). As these plates diverge, there is lowered pressure beneath this divergent zone. These lowered pressures cause the mantle to melt, leading to eruptions of mafic lava. When the lava cools, it becomes new oceanic crust.
Connecting the CSZ with these spreading ridges, and spreading ridges with other spreading ridges, are transform plate boundaries in the form of strike-slip faults. For example, the Mendocino fault and the Blanco fault. Here is a report that includes background information about the Mendocino fault. Here is a report with some background information about the Blamco fault.
The 18 May 2020 M 5.5 earthquake happened near the Gorda Rise and was an extensional earthquake. As the Gorda plate moves away from the spreading ridge, the normal faults formed at the ridge don’t disappear. The Gorda plate is a strange plate as it gets internally deformed, so as the plate moves towards the subduction zone, these normal faults get reactivated as strike-slip faults. These strike-slip faults have been responsible for some of the most damaging earthquakes to impact coastal northern California. More about these left-lateral strike-slip Gorda plate earthquakes can be found in a report here.
The M 5.5 earthquake happened along one of these normal faults, before that fault turns into a strike-slip fault. There is a good history of earthquakes just like this one. Here is a report for a similar event further to the north, also slightly east of the Gorda Rise.
One of the most common questions people have is, “does this earthquake change our chances for a CSZ earthquake?” The answer is no. The reason is because the stress changes from earthquakes extends for a limited distance from those earthquakes. I spend more time discussing this limitation for the Blanco fault here. Basically, this M 5.5 event was too small and too far away from the CSZ to change the chance that the CSZ will slip. Today is not different from a couple weeks ago: we always need to be ready for an earthquake when we live in earthquake country.

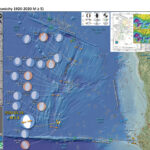
Below is my interpretive poster for this earthquake

  • I plot the seismicity from the past month, with diameter representing magnitude (see legend). I include earthquake epicenters from 1920-2020 with magnitudes M ≥ 5.0 in one version.
  • I plot the USGS fault plane solutions (moment tensors in blue and focal mechanisms in orange), possibly in addition to some relevant historic earthquakes.
  • A review of the basic base map variations and data that I use for the interpretive posters can be found on the Earthquake Reports page.
  • Some basic fundamentals of earthquake geology and plate tectonics can be found on the Earthquake Plate Tectonic Fundamentals page.

    I include some inset figures. Some of the same figures are located in different places on the larger scale map below.

  • In the upper right corner is a map and cross section for the Cascadia subduction zone. I spend more time describing these figures below.
  • In the upper left corner is a map showing this entire region with historic seismicity plotted. I also include the plate boundaries (USGS) and include the magnetic anomalies too. Read more about magnetic anomalies here. Notice how the magnetic anomaly bands are parallel to the spreading ridges. Why do you think this might be?
  • Yes, you are correct! The magnetic anomalies are parallel to the spreading ridges because they are formed when the crust cools along these spreading ridges.
  • The Gorda plate is being crushed between all the other plates in the area. This causes the plate to deform internally. The figure in the lower right corner (Chaytor et al., 2004) shows some different models to explain the faults formed from this internal deformation. The map in the upper right center, also from Chaytor et al. (2004) shows how they interpret some of these normal faults to be reactivated as strike-slip faults.
  • Here is the map with a month’s seismicity plotted.

  • Here are two posters from the 2018 Gorda Rise earthquakes.

  • This version includes earthquakes M ≥ 5.0 from the USGS. Note how the region where today’s earthquakes happened is a region of higher levels of seismicity. Perhaps this is because this region is the locus of the deformation within the Mendocino deformation zone?

Other Report Pages

Some Relevant Discussion and Figures

  • Here is a map of the Cascadia subduction zone, modified from Nelson et al. (2006). The Juan de Fuca and Gorda plates subduct norteastwardly beneath the North America plate at rates ranging from 29- to 45-mm/yr. Sites where evidence of past earthquakes (paleoseismology) are denoted by white dots. Where there is also evidence for past CSZ tsunami, there are black dots. These paleoseismology sites are labeled (e.g. Humboldt Bay). Some submarine paleoseismology core sites are also shown as grey dots. The two main spreading ridges are not labeled, but the northern one is the Juan de Fuca ridge (where oceanic crust is formed for the Juan de Fuca plate) and the southern one is the Gorda rise (where the oceanic crust is formed for the Gorda plate).

  • Here is a version of the CSZ cross section alone (Plafker, 1972). This shows two parts of the earthquake cycle: the interseismic part (between earthquakes) and the coseismic part (during earthquakes). Regions that experience uplift during the interseismic period tend to experience subsidence during the coseismic period.

  • This figure shows how a subduction zone deforms between (interseismic) and during (coseismic) earthquakes. We also can see how a subduction zone generates a tsunami. Atwater et al., 2005.

  • Here is an animation produced by the folks at Cal Tech following the 2004 Sumatra-Andaman subduction zone earthquake. I have several posts about that earthquake here and here. One may learn more about this animation, as well as download this animation here.
  • Here is a map from Chaytor et al. (2004) that shows some details of the faulting in the region. The moment tensor (at the moment i write this) shows a north-south striking fault with a reverse or thrust faulting mechanism. While this region of faulting is dominated by strike slip faults (and most all prior earthquake moment tensors showed strike slip earthquakes), when strike slip faults bend, they can create compression (transpression) and extension (transtension). This transpressive or transtentional deformation may produce thrust/reverse earthquakes or normal fault earthquakes, respectively. The transverse ranges north of Los Angeles are an example of uplift/transpression due to the bend in the San Andreas fault in that region.

  • A: Mapped faults and fault-related ridges within Gorda plate based on basement structure and surface morphology, overlain on bathymetric contours (gray lines—250 m interval). Approximate boundaries of three structural segments are also shown. Black arrows indicated approximate location of possible northwest- trending large-scale folds. B, C: uninterpreted and interpreted enlargements of center of plate showing location of interpreted second-generation strike-slip faults and features that they appear to offset. OSC—overlapping spreading center.

  • These are the models for tectonic deformation within the Gorda plate as presented by Jason Chaytor in 2004.
  • Mw = 5 Trinidad Chaytor

    Models of brittle deformation for Gorda plate overlain on magnetic anomalies modified from Raff and Mason (1961). Models A–F were proposed prior to collection and analysis of full-plate multibeam data. Deformation model of Gulick et al. (2001) is included in model A. Model G represents modification of Stoddard’s (1987) flexural-slip model proposed in this paper.

  • Here is a map from Rollins and Stein, showing their interpretations of different historic earthquakes in the region. This was published in response to the Januray 2010 Gorda plate earthquake. The faults are from Chaytor et al. (2004).

  • Tectonic configuration of the Gorda deformation zone and locations and source models for 1976–2010 M ≥ 5.9 earthquakes. Letters designate chronological order of earthquakes (Table 1 and Appendix A). Plate motion vectors relative to the Pacific Plate (gray arrows in main diagram) are from Wilson [1989], with Cande and Kent’s [1995] timescale correction.

  • In this map below, I label a number of other significant earthquakes in this Mendocino triple junction region. Another historic right-lateral earthquake on the Mendocino fault system was in 1994. There was a series of earthquakes possibly along the easternmost section of the Mendocino fault system in late January 2015, here is my post about that earthquake series.

The Gorda and Juan de Fuca plates subduct beneath the North America plate to form the Cascadia subduction zone fault system. In 1992 there was a swarm of earthquakes with the magnitude Mw 7.2 Mainshock on 4/25. Initially this earthquake was interpreted to have been on the Cascadia subduction zone (CSZ). The moment tensor shows a compressional mechanism. However the two largest aftershocks on 4/26/1992 (Mw 6.5 and Mw 6.7), had strike-slip moment tensors. These two aftershocks align on what may be the eastern extension of the Mendocino fault.
There have been several series of intra-plate earthquakes in the Gorda plate. Two main shocks that I plot of this type of earthquake are the 1980 (Mw 7.2) and 2005 (Mw 7.2) earthquakes. I place orange lines approximately where the faults are that ruptured in 1980 and 2005. These are also plotted in the Rollins and Stein (2010) figure above. The Gorda plate is being deformed due to compression between the Pacific plate to the south and the Juan de Fuca plate to the north. Due to this north-south compression, the plate is deforming internally so that normal faults that formed at the spreading center (the Gorda Rise) are reactivated as left-lateral strike-slip faults. In 2014, there was another swarm of left-lateral earthquakes in the Gorda plate. I posted some material about the Gorda plate setting on this page.

  • This is the map used in the animation below. Earthquake epicenters are plotted (some with USGS moment tensors) for this region from 1917-2017 with M ≥ 6.5. I labeled the plates and shaded their general location in different colors.
  • I include some inset maps.
    • In the upper right corner is a map of the Cascadia subduction zone (Chaytor et al., 2004; Nelson et al., 2004).
    • In the upper left corner is a map from Rollins and Stein (2010). They plot epicenters and fault lines involved in earthquakes between 1976 and 2010.


    Social Media

    References:

    Basic & General References

  • Frisch, W., Meschede, M., Blakey, R., 2011. Plate Tectonics, Springer-Verlag, London, 213 pp.
  • Hayes, G., 2018, Slab2 – A Comprehensive Subduction Zone Geometry Model: U.S. Geological Survey data release, https://doi.org/10.5066/F7PV6JNV.
  • Holt, W. E., C. Kreemer, A. J. Haines, L. Estey, C. Meertens, G. Blewitt, and D. Lavallee (2005), Project helps constrain continental dynamics and seismic hazards, Eos Trans. AGU, 86(41), 383–387, , https://doi.org/10.1029/2005EO410002. /li>
  • Jessee, M.A.N., Hamburger, M. W., Allstadt, K., Wald, D. J., Robeson, S. M., Tanyas, H., et al. (2018). A global empirical model for near-real-time assessment of seismically induced landslides. Journal of Geophysical Research: Earth Surface, 123, 1835–1859. https://doi.org/10.1029/2017JF004494
  • Kreemer, C., J. Haines, W. Holt, G. Blewitt, and D. Lavallee (2000), On the determination of a global strain rate model, Geophys. J. Int., 52(10), 765–770.
  • Kreemer, C., W. E. Holt, and A. J. Haines (2003), An integrated global model of present-day plate motions and plate boundary deformation, Geophys. J. Int., 154(1), 8–34, , https://doi.org/10.1046/j.1365-246X.2003.01917.x.
  • Kreemer, C., G. Blewitt, E.C. Klein, 2014. A geodetic plate motion and Global Strain Rate Model in Geochemistry, Geophysics, Geosystems, v. 15, p. 3849-3889, https://doi.org/10.1002/2014GC005407.
  • Meyer, B., Saltus, R., Chulliat, a., 2017. EMAG2: Earth Magnetic Anomaly Grid (2-arc-minute resolution) Version 3. National Centers for Environmental Information, NOAA. Model. https://doi.org/10.7289/V5H70CVX
  • Müller, R.D., Sdrolias, M., Gaina, C. and Roest, W.R., 2008, Age spreading rates and spreading asymmetry of the world’s ocean crust in Geochemistry, Geophysics, Geosystems, 9, Q04006, https://doi.org/10.1029/2007GC001743
  • Pagani,M. , J. Garcia-Pelaez, R. Gee, K. Johnson, V. Poggi, R. Styron, G. Weatherill, M. Simionato, D. Viganò, L. Danciu, D. Monelli (2018). Global Earthquake Model (GEM) Seismic Hazard Map (version 2018.1 – December 2018), DOI: 10.13117/GEM-GLOBAL-SEISMIC-HAZARD-MAP-2018.1
  • Silva, V ., D Amo-Oduro, A Calderon, J Dabbeek, V Despotaki, L Martins, A Rao, M Simionato, D Viganò, C Yepes, A Acevedo, N Horspool, H Crowley, K Jaiswal, M Journeay, M Pittore, 2018. Global Earthquake Model (GEM) Seismic Risk Map (version 2018.1). https://doi.org/10.13117/GEM-GLOBAL-SEISMIC-RISK-MAP-2018.1
  • Zhu, J., Baise, L. G., Thompson, E. M., 2017, An Updated Geospatial Liquefaction Model for Global Application, Bulletin of the Seismological Society of America, 107, p 1365-1385, https://doi.org/0.1785/0120160198
  • Specific References

Return to the Earthquake Reports page.


Earthquake Report: Mina Deflection in Nevada

I was slowly waking up while looking at my social media feed. moments before (maybe minutes) Anthony Lomax had posted his first motion earthquake mechanism for a M 6.4 near the CA/NV border. I leaped out of bed and got off a map before i had the time to put any clothes on (one benefit of teleworking that i won’t go into too many details).
https://earthquake.usgs.gov/earthquakes/eventpage/nn00725272/executive
There was a swarm of earthquakes east of Mono Lake in April along the Huntoon Valley fault zone. These events are aligned with faults that trend east-northeast. The plate boundary relative plate motion is generally aligned with the San Andreas fault system (north-northwest trending right-lateral strike-slip faulting). To the east, tectonics are dominated by ~east-west extension in the Basin and Range geomorphic province.
As the plate boundary organizes itself along the east side of the Sierra Nevada, it has some disruptions, with blocks that are rotating in ways (within this right-lateral shear) that lead to these northeast trending faults.
As the blocks rotate, the faults that bound these blocks (the east-northeast faults) are left-lateral strike-slip faults. More on this below.
In April these earthquakes were along some of these east-northeast left-lateral faults, with the largest magnitude = M 5.2. Today’s ongoing sequence is to the east along the same trend of faulting, along faults mapped by Tom Sawyer of Piedmont Geosciences called “unnamed faults of the Candelaria Hills.”
It seems hard to believe that these earthquakes are unrelated. They are within about a month of each other. They are along the same fault system.
Taking this thought experiment through, it seems that an earthquake could happen between these earthquakes along this fault system.
Using Wells and Coppersmith (1994) empirical relations between surface rupture length (the length of the fault that would break through the ground surface) and earthquake magnitude can help us estimate what magnitude of an earthquake may be given a rupture length.
If we use these relations, and the distance between these earthquakes, we measure a distance of 50 km and can calculate a magnitude of M 7.0. Thus, it would be prudent for people in the region to stay safe and ensure that they are prepared for a potentially larger earthquake.
There is an alternate explanation for today’s sequence. The M 6.4 was on a north-south oriented fault and was right-lateral strike-slip, while many of the aftershocks are actually instead triggered earthquakes on the east-west trending left-lateral strike-slip earthquake fault system. Which recent earthquake sequence had two almost perpendicularly relative orientations? Yes, the Ridgecrest Earthquake Sequence. Now, this is a more complicated explanation, but it is possible (tho at this point, i deem it unlikely).
UPDATE 16 MAY
Reports from the field are that the surface rupture is north-south just east of Rock Hill (feature shown on USGS earthquake event page web map). Rock Hill is west of the M 6.5 epicenter, and just east of HWY 95 38.149 N 117.941 W. Observations from Jamie Shutmut.
perhaps the alternate hypothesis mentioned last night was the correct hypothesis?
UPDATE later
There have been many different observations in the field to suggest that the surface deformation from this event sequence is broadly distributed and the offsets at the surface are on the order of centimeters, maybe a half a decimeter.
It appears that the main fault was ~east-west, but that there may be some north-south structure involved too.

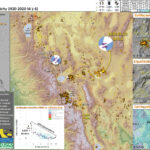
Below is my interpretive poster for this earthquake

  • I plot the seismicity from the past 3 months, with diameter representing magnitude (see legend). I include earthquake epicenters from 1920-2020 with magnitudes M ≥ 6.0 in one version.
  • I plot the USGS fault plane solutions (moment tensors in blue and focal mechanisms in orange), possibly in addition to some relevant historic earthquakes.
  • A review of the basic base map variations and data that I use for the interpretive posters can be found on the Earthquake Reports page.
  • Some basic fundamentals of earthquake geology and plate tectonics can be found on the Earthquake Plate Tectonic Fundamentals page.

    I include some inset figures. Some of the same figures are located in different places on the larger scale map below.

  • In the upper left corner is a small scale (zoomed out) view of the western USA showing the major tectonic faults (from the Global Earthquake Model). I show USGS seismicity from the past century.
  • In the lower right corner is a map showing the earthquake intensity using the Modified Mercalli Intensity Scale (MMI) as modeled by the USGS.
  • In the upper right corner is a map that shows the earthquakes from the past month. Note how the April sequence is related to today’s ongoing sequence.
  • In the center right is a map that shows the liquefaction susceptibility model from the USGS. This is a model and not based on direct observation, however, it could be used to help direct field teams to search for this type of effect.
  • In the lower center is a plot showing how shaking intensity lowers with distance from the earthquake. The models that were used to produce the Earthquake Intensity map to the right are the same model results represented by the orange and green lines. However, on this plot, there are also observations from real people! The USGS Did You Feel It? questionnaire lets people report their observations from the earthquake and these data are plotted here. We can then compare the model with the observations.
  • Here is the map with 3 month’s seismicity plotted.

  • An update from this evening (some changes in intensities). I moved the map to include aftershocks from the Ridgecrest Earthquake Sequence.
  • I also had forgotten to label Tonopah, so needed to add a label for Tehachapi too.

  • Here are some photos from Jamie Shutmutt which are in the social media section below.
  • These two images show evidence of ground disruption. This is likely the result of liquefaction in the subsurface. There are varying hypotheses about how this specifically happens, but it is basically the result of water pressure pushing against the sediment particles so that they move like fluid.
  • Sediment or soil strength is based upon the ability for sediment particles to push against each other without moving. This is a combination of friction and the forces exerted between these particles. This is loosely what we call the “angle of internal friction.” Liquefaction is a process by which pore pressure increases cause water to push out against the sediment particles so that they are no longer touching.
  • An analogy that some may be familiar with relates to a visit to the beach. When one is walking on the wet sand near the shoreline, the sand may hold the weight of our body generally pretty well. However, if we stop and vibrate our feet back and forth, this causes pore pressure to increase and we sink into the sand as the sand liquefies. Or, at least our feet sink into the sand.
  • Below is a diagram showing how an increase in pore pressure can push against the sediment particles so that they are not touching any more. This allows the particles to move around and this is why our feet sink in the sand in the analogy above. This is also what changes the strength of earth materials such that a landslide can be triggered.

  • During our post earthquake response to the Ridgecrest Earthquake Sequence in July of 2019, we observed similar features in places like in the Salt Wells Valley playa.
  • Take a look at the earthquake report interpretive poster above for today’s M 6.5 earthquake. Look at the liquefaciton susceptibility map. Can you tell where these photos may have been taken?

  • Yes, that’s right! These photos were taken in the area to the west of the epicenter. Note the north-south highway west of the M 6.5 epicenter. This is HWY 95 and the playa to the west shows a high chance of liquefaction, right where these photos were taken.
  • Here is the poster for the earthquakes in April 2020.

USGS Shaking Intensity

  • UPDATE:evening of 15 May
  • Here is a figure that shows a more detailed comparison between the modeled intensity and the reported intensity. Both data use the same color scale, the Modified Mercalli Intensity Scale (MMI). More about this can be found here. The colors and contours on the map are results from the USGS modeled intensity. The DYFI data are plotted as colored dots (color = MMI, diameter = number of reports).
  • In the upper panel is a plot showing MMI intensity (vertical axis) relative to distance from the earthquake (horizontal axis). The models are represented by the green and orange lines. The DYFI data are plotted as light blue dots. The mean and median (different types of “average”) are plotted as orange and purple dots. Note how well the reports fit the green line (the model that represents how MMI works based on quakes in California).
  • Below the upper panel plot is the USGS MMI Intensity scale, which lists the level of damage for each level of intensity, along with approximate measures of how strongly the ground shakes at these intensities, showing levels in acceleration (Peak Ground Acceleration, PGA) and velocity (Peak Ground Velocity, PGV).
  • In the center panel is the USGS Did You Feel It reports map, showing reports as colored dots using the MMI color scale.
  • In the lower panel is the map that shows the modeled intensity using the same model that is plotted in the upper panel.

Other Report Pages

Some Relevant Discussion and Figures

  • Here are the two figures from Rinke et al. (2012) that show the global and regional tectonics here. I include the figure captions below as blockquotes. The first map shows the plate boundary scale tectonic regions. This is a generalized map (e.g. don’t pay attention to where the San Andreas and Cascadia faults are located). The second map shows the regional fault systems.

  • Simplified tectonic map of the western U.S. Cordillera showing the modern plate boundaries and tectonic provinces. Basin and Range Province is in medium gray; Central Nevada seismic belt (CNSB), eastern California shear zone (ECSZ), Intermountain seismic belt (ISB), and Walker Lane belt (WLB) are in light gray; Mina deflection (MD) is in dark gray.


    Shaded relief map of the WLB and northern part of the ECSZ showing the major Quaternary faults. Solid ball is located on the hanging wall of normal faults; arrow pairs indicate relative motion across strike-slip faults; white dashed box outlines location of Figure 2; light gray shaded areas show the Mina deflection and the Carson domain. BSF—Benton Springs fault; CF—Coaldale fault; DSF—Deep Springs fault; DVFCFLVFZ—Death Valley–Furnace Creek–Fish Lake Valley fault zone; GHF—Gumdrop Hills fault; HLF—Honey Lake fault; HMF—Hunter Mountain fault; MVF—Mohawk Valley fault; OVF— Owens Valley fault; PLF—Pyramid Lake fault; PSF—Petrified Springs fault; QVF—Queen Valley fault; SLF—Stateline fault; SNFFZ—Sierra Nevada frontal fault zone; WMFZ—White Mountains fault zone; WRF—Wassuk Range fault; WSFZ—Warm Springs fault zone.

  • Here is a figure from Wesnousky et al. (2012) where a wax block model is used to illustrate their interpretations of the tectonic deformation along the Walker Lane region. Today’s earthquakes occurred in the basin to the west of the circled number “7.”

  • (Left) Model to visualize accommodation of strain and development of basins in northern Walker lane. The upper is a block of wax has been heated to become ductile and subjected to transtensional right-lateral shear. Ice has been applied to the surface of lower wax block to create brittle upon ductile layer, and then subjected to same shear. The transtensional shear results in a zone of deformation displaying rotation of ‘crustal blocks’, an en echelon arrangement of asymmetric ‘basins,’ observable extension along the axis of shear, and the ability to locally traverse the entire zone of shear without encountering a major fault structure. (Right) Oblique view of study area illustrates the en echelon arrangement and triangular shape of basins nested along the east edge of the Sierra Nevada. Black and colored lines are portions of Walker Lane faults shown in Fig. 1 (Wesnousky et al., 2012)

  • Here are the geodetic observations for each of these blocks along the Walker Lane (Wesnousky et al., 2012). GPS rates are plotted as red vectors. Geologic rates are in the white boxes and are plotted as vectors in black, purple, and blue. Today’s earthquake series happened in the basin where the label “LUCK” is. Note how the GPS site on the northeast side of the basin is moving slightly faster than the GPS site on the western side of the basin. A northwesterly striking right-lateral strike-slip fault could produce this if it ran between these two GPS sites.

  • Physiographic and fault map of area of interest in northern Walker Lane shows major structural basins (numbered), active basin-bounding faults (thick black lines), and geodetic displacement field (red arrows). Shown in white boxes are geologically determined values of fault-normal extension (black-upper text), geodetic estimates of fault-normal extension (magenta-middle text) and geodetic estimates of fault-parallel strike-slip (blue-lower text) rates along each of the basin bounding faults. Two-headed arrows schematically show ranges of same values and correspond in arrangement and color to the values in boxes. The geologically determined extension rate arrows are placed adjacent to the sites of studies except for Lake Tahoe where the estimate is an average value across several submarine faults. Dotted (yellow) lines define paths AB, CD, and EF.

  • This is the tectonic domain figure from Bormann et al. (2016). Some faults have arrows that show their relative sense of motion and blocks have arrows that show their relative sense of rotation. Note the east-west sinistral strike-slip faults that bound the northern and southern boundaries of the blocks in the Mina deflection. Today’s earthquakes happened along the eastern boundary of the Bodie Hills tectonic domain (BH). The BH domain has clockwise rotation like in the Mina deflection. This would place sinistral strain along the southern boundary of the BH domain, creating left-lateral strike-slip faults oriented northeast striking. This is consistent with the sense of motion along the “unnamed faults near Alkali Valley.” If these 2016 earthquakes are associated with these faults, then they are along northeast striking structures and would be left-lateral.

  • Regional map showing the block model boundaries (yellow lines) in relation to the topography and faults of the Central Walker Lane. The Central Walker Lane (region within the dashed black lines) lies between the northeast striking normal faults of the Basin and Range and the Sierra Nevada microplate. Black lines delin-eate major normal faults of the Central Walker Lane, and red lines mark the location of strike slip faults (arrows indicate slip direction). Paleomagnetic observations in-dicate that crustal blocks in the Carson Domain, Bodie Hills, and Mina Deflection accommodate dextral shear through clockwise vertical axis rotations (Cashman and Fontaine, 2000; Petronis et al., 2009; Rood et al., 2011b; Carlson et al., 2013). Orange lines mark the locations of surface rupture that resulted from historic earthquakes in the Central Nevada Seismic Belt. Faults traces are modified from the USGS Qua-ternary Fault and Fold database (U.S. Geological Survey, California Geological Survey, Nevada Bureau of Mines and Geology, 2006). Inset map shows the location of the study area in relation to other elements of the Pacific/North America Plate boundary zone.

  • Here Bormann et al. (2016) present their estimates of rotation and fault slip rates for this region. The caption is below the figure. I place a red star where today’s earthquakes happened. This map helps us visualize an alternate interpretation of these earthquakes. The 2016 swarm is along the eastern boundary of the BH domain, which would suggest a northwest striking dextral (right-lateral) strike slip fault would be involved. Given that the currently mapped faults in this region are northeast striking, I interpret these to be along structures that are also northeast striking. Note how the BH domain is rotating clockwise about 1.75 °/Ma, while the MD is rotating clockwise about 2.75 °/Ma.

  • Block motions, slip rates, and velocity residuals for the best fitting GPS model. (A) Rigid block rotation and translation exaggerated by a factor of 107(representing 10 million years of deformation). Color of block indicates vertical axis rotation rate. (B) Predicted fault slip rates represented by the thickness of black (red) line for dextral (sinistral) strike-slip motion and the length of blue (cyan) bar for fault normal extension (compression).

  • Here is the illustrative model presented by Lee et al. (2009) to explain the faulting in the MD (which may also partially explain the seismicity in this region northeast of the Bodie Hills).

  • Schematic block diagrams illustrating two fault-slip transfer mechanisms between subparallel strike-slip faults proposed for the eastern California shear zone and Walker Lane belt. (A) Displacement transfer model whereby the magnitude of extension along the connecting normal faults is proportional to the amount of strike-slip motion transferred (modified from Oldow et al., 1994). (B) Block rotation model in which clockwise rotation of blocks, bounded by dextral faults, is accommodated by sinistral faults (model of McKenzie and Jackson, 1983, 1986).

  • Here is an updated figure to show how these fault systems may have evolved through time (Nagorsen-Rinke et al., 2012).

  • Block diagrams illustrating models proposed to explain fault slip transfer across the Mina deflection. (A) Displacement transfer model in which normal slip along connecting faults transfers fault slip (modified from Oldow, 1992; Oldow et al., 1994). (B) Transtensional model showing a combination of sinistral and normal slip along connecting faults. (C) Clockwise block rotation model in which sinistral slip along connecting faults, combined with vertical axis rotation of intervening fault blocks, transfers fault slip (modified from McKenzie and Jackson, 1983, 1986). Single-barbed arrows show dextral fault motion across faults of the Eastern California shear zone (ECSZ) and Walker Lane belt (WLB) and sinistral motion along faults in the Mina deflection; half-circle double-barbed arrows indicate clockwise rotating fault blocks; solid ball is located on the hanging wall of normal slip faults; thin short lines indicate slip direction on fault surfaces.

  • Here is the map from the UNR Seismological Laboratory website. This shows the earthquakes recorded during the 2011 swarm along the “unnamed faults along Alakali Valley.” Here is the UNRSL website for this earthquake. I include the UNRSL description of the 2011 Hawthorne Sequence below.

    • Over the past nine weeks 42 earthquakes of Magnitude 3.0 and larger earthquakes (listed below) have been located in a sequence about 12 miles southwest of Hawthorne, Nevada. The first of these occurred on March 15th at 11:14 AM PDT and the latest at 10:23 AM PDT on May 19th. The preliminary magnitude for the largest event is M 4.6.
    • In all, there have been several hundred events of Magnitude 1 and larger; only a small fraction of the entire sequence has been reviewed. There have been 1000’s of smaller magnitude events.
    • The Nevada Seismological Laboratory deployed 3 temporary telemetered instruments in the source area on April 17-19 including a NetQuakes instrument at the Court House in Hawthorne. These temporary telemetered instruments deliver real-time data to the data center in Reno and are configured with 3-channel broadband sensors and 3-channel accelerometers.
  • Here is a map from Nagorsen-Rinke et al. (2012) with regional faults mapped. Note how the sinistral faults that bound blocks in the Mina deflection are each slightly more counterclockwise rotated with the fault at the base of the southeastern Excelsior Mountains being the most northerly striking of these faults. If this configuration of faulting were in the basin to the NE of the Bodie Hills, it would explain the northeast striking sinistral interpretation for the 2016 series.

  • Shaded relief map of the southern part of the Mina deflection and northern part of the eastern California shear zone showing the major Quaternary faults. Solid black ball is located on the hanging wall of normal faults; arrow pairs indicate relative motion across strike-slip faults. Heavy arrow in northwest corner of map shows the present-day motion of the Sierra Nevada (SN) with respect to North America (NA) (Dixon et al., 2000). Location of the Adobe Hills geologic map shown in Figure 4A is outlined with a dashed line and location of this map is shown in Figure 1. PS—Pizona Springs; CF—Coaldale fault; CSF— Coyote Springs fault; DSF—Deep Springs fault; FLVFZ—Fish Lake Valley fault zone; HCF—Hilton Creek fault; OVF—Owens Valley fault; QVF—Queen Valley fault; RVF— Round Valley fault; WMFZ—White Mountains fault zone.

Earthquake Report: M 6.5 in Crete, Greece

Well, last weekend I was working on a house, so did not have the time to write this up until now. (2023 update: the magnitude is now M 6.5)

https://earthquake.usgs.gov/earthquakes/eventpage/us700098qd/executive

The eastern Mediterranean Sea region is dominated by plate tectonics (no surprise, right?). The plate boundary fault system that is responsible for this earthquake near Crete is a convergent plate boundary called a subduction zone.

Convergent means that one plate is moving towards another plate. One of the largest plate boundary systems in the world is a convergent plate boundary that extends from between the north side of Australia and Indonesia, through southern Asia forming the Himalayan Mountains, through the Middle East, into Europe and west past the Mediterranean.

Near Crete the Africa plate is diving (northwards) beneath the Anatolia plate (a sliver of the Eurasia plate). The 2 May magnitude M 6.6 earthquake appears to have been an earthquake on the subduction zone megathrust fault interface (a subduction zone earthquake).
The earthquake was felt across the region with intensity as high as MMI 6 in Crete, to around MMI 4 in Cairo, Egypt.

The earthquake even caused a tsunami that was recorded at teh Lerapetra tide gage in Crete, Greece. The wave was small at about 40 cm peak to trough (measured vertically from the highest part of the wave, the peak, to the lowest part of the wave, the trough).
Here are the tide gage data downloaded from the IOC website here. The tsunami starts at around 13:00 hours.


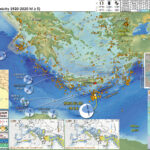
Below is my interpretive poster for this earthquake

  • I plot the seismicity from the past 6 months, with diameter representing magnitude (see legend). I include earthquake epicenters from 1920-2020 with magnitudes M ≥ 6.0 in one version.
  • I plot the USGS fault plane solutions (moment tensors in blue and focal mechanisms in orange), possibly in addition to some relevant historic earthquakes.
  • A review of the basic base map variations and data that I use for the interpretive posters can be found on the Earthquake Reports page.
  • Some basic fundamentals of earthquake geology and plate tectonics can be found on the Earthquake Plate Tectonic Fundamentals page.

    I include some inset figures. Some of the same figures are located in different places on the larger scale map below.

  • In the center left is an inset map from Dilek and Sandovol (2009) that shows the tectonic plates and the plate boundary faults in the region. There is a blue star in the general location of the M 6.6 earthquake.
  • In the upper right corner is a smaller scale view of the region with 6 months of seismicity plotted.
  • In the lower right corner is a map that shows a model estimate of the shaking intensity from this M 6.6 earthquake.
  • Above the intensity map is a map that shows earthquake mechanisms for historic earthquakes in the region.
  • In the bottom center are seismic hazard and seismic risk maps for the European area. There is more about hazard and risk later in this report.
  • Here is the map with 6 month’s seismicity plotted.

Other Report Pages

Some Relevant Discussion and Figures

  • Here is the tectonic map from Dilek and Sandvol (2009).

  • Tectonic map of the Aegean and eastern Mediterranean region showing the main plate boundaries, major suture zones, fault systems and tectonic units. Thick, white arrows depict the direction and magnitude (mm a21) of plate convergence; grey arrows mark the direction of extension (Miocene–Recent). Orange and purple delineate Eurasian and African plate affinities, respectively. Key to lettering: BF, Burdur fault; CACC, Central Anatolian Crystalline Complex; DKF, Datc¸a–Kale fault (part of the SW Anatolian Shear Zone); EAFZ, East Anatolian fault zone; EF, Ecemis fault; EKP, Erzurum–Kars Plateau; IASZ, Izmir–Ankara suture zone; IPS, Intra–Pontide suture zone; ITS, Inner–Tauride suture; KF, Kefalonia fault; KOTJ, Karliova triple junction; MM, Menderes massif; MS, Marmara Sea; MTR, Maras triple junction; NAFZ, North Anatolian fault zone; OF, Ovacik fault; PSF, Pampak–Sevan fault; TF, Tutak fault; TGF, Tuzgo¨lu¨ fault; TIP, Turkish–Iranian plateau (modified from Dilek 2006).

  • Here is the large scale tectonic setting map (Taymaz et al., 2007) with their figure below.

  • Summary sketch map of the faulting and bathymetry in the Eastern Mediterranean region, compiled from our observations and those of Le Pichon & Angelier (1981), Taymaz (1990), Taymaz et al. (1990, 1991a, b); S¸arogˇlu et al. (1992), Papazachos et al. (1998), McClusky et al. (2000) and Tan & Taymaz (2006). Large black arrows show relative motions of plates with respect to Eurasia (McClusky et al. 2003). Bathymetry data are derived from GEBCO/97–BODC, provided by GEBCO (1997) and Smith & Sandwell (1997a, b). Shaded relief map derived from the GTOPO-30 Global Topography Data taken after USGS. NAF, North Anatolian Fault; EAF, East Anatolian Fault; DSF, Dead Sea Fault; NEAF, North East Anatolian Fault; EPF, Ezinepazarı Fault; PTF, Paphos Transform Fault; CTF, Cephalonia Transform Fault; PSF, Pampak–Sevan Fault; AS, Apsheron Sill; GF, Garni Fault; OF, Ovacık Fault; MT, Mus¸ Thrust Zone; TuF, Tutak Fault; TF, Tebriz Fault; KBF, Kavakbas¸ı Fault; MRF, Main Recent Fault; KF, Kagˇızman Fault; IF, Igˇdır Fault; BF, Bozova Fault; EF, Elbistan Fault; SaF, Salmas Fault; SuF, Su¨rgu¨ Fault; G, Go¨kova; BMG, Bu¨yu¨k Menderes Graben; Ge, Gediz Graben; Si, Simav Graben; BuF, Burdur Fault; BGF, Beys¸ehir Go¨lu¨ Fault; TF, Tatarlı Fault; SuF, Sultandagˇ Fault; TGF, Tuz Go¨lu¨ Fault; EcF, Ecemis¸ Fau; ErF, Erciyes Fault; DF, Deliler Fault; MF, Malatya Fault; KFZ, Karatas¸–Osmaniye Fault Zone.

  • This figure shows GPS velocities in the region (Taymaz et al., 2007).

  • GPS horizontal velocities and their 95% confidence ellipses in a Eurasia-fixed reference frame for the period 1988–1997 superimposed on a shaded relief map derived from the GTOPO-30 Global Topography Data taken after USGS. Bathymetry data are derived from GEBCO/97–BODC, provided by GEBCO (1997) and Smith & Sandwell (1997a, b). Large arrows designate generalized relative motions of plates with respect to Eurasia (in mm a21) (recompiled after McClusky et al. 2000). NAF, North Anatolian Fault; EAF, East Anatolian Fault; DSF, Dead Sea Fault; NEAF, North East Anatolian Fault; EPF, Ezinepazarı Fault; CTF, Cephalonia Transform Fault; PTF, Paphos Transform Fault; CMT, Caucasus Main Thrust; MRF, Main Recent Fault.

  • Finally their summary figure showing the tectonic regimes (Taymaz et al., 2007).

  • Schematic map of the principal tectonic settings in the Eastern Mediterranean. Hatching shows areas of coherent motion and zones of distributed deformation. Large arrows designate generalized regional motion (in mm a21) and errors (recompiled after McClusky et al. (2000, 2003). NAF, North Anatolian Fault; EAF, East Anatolian Fault; DSF, Dead Sea Fault; NEAF, North East Anatolian Fault; EPF, Ezinepazarı Fault; CTF, Cephalonia Transform Fault; PTF, Paphos Transform Fault.

  • This is a tectonic summary figure from Kokkalas et al. (2006).

  • Simplified map showing the main structural features along the Hellenic arc and trench system, as well as the main active structures in the Aegean area. The mean GPS horizontal velocities in the Aegean plate, with respect to a Eurasia-fixed reference frame, are shown (after Kahle et al., 1998; McClusky et al., 2000). The lengths of vectors are
    proportional to the amount of movement. The thick black arrows indicate the mean motion vectors of the plates. The polygonal areas on the map (dashed lines) define the approximate borders of the five different structural regions discussed in the text. The borders between structural regions are not straightforward, and wide transitional zones probably exist between them. The inset shows a schematic map with the geodynamic framework in the eastern Mediterranean area (modified from McClusky et al., 2000). DSF—Dead Sea fault; EAF—East Anatolia fault; HT—Hellenic trench; KFZ— Kefallonia fault zone; MRAC—Mediterranean Ridge accretionary complex; NAF—North Anatolia fault; NAT—North Aegean trough.

  • The following three figures are from Dilek and Sandvol, 2006. The locations of the cross sections are shown on the map as orange lines. Cross section G-G’ is located in the region of today’s earthquake.
  • Here is the map (Dilek and Sandvol, 2006). I include the figure caption below in blockquote.

  • Simplified tectonic map of the Mediterranean region showing the plate boundaries, collisional zones, and directions of extension and tectonic transport. Red lines A through G show the approximate profile lines for the geological traverses depicted in Figure 2. MHSZ—mid-Hungarian shear zone; MP—Moesian platform; RM—Rhodope massif; IAESZ— Izmir-Ankara-Erzincan suture zone; IPS—Intra-Pontide suture zone; ITS—inner Tauride suture zone; NAFZ—north Anatolian fault zone; KB—Kirsehir block; EKP—Erzurum-Kars plateau; TIP—Turkish-Iranian plateau.

  • Here are cross sections A-D (Dilek and Sandvol, 2006). I include the figure caption below in blockquote.


  • Simplified tectonic cross-sections across various segments of the broader Alpine orogenic belt.

  • (A) Eastern Alps. The collision of Adria with Europe produced a bidivergent crustal architecture with both NNW- and SSE-directed nappe structures that involved Tertiary molasse deposits, with deep-seated thrust faults that exhumed lower crustal rocks. The Austro-Alpine units north of the Peri-Adriatic lineament represent the allochthonous outliers of the Adriatic upper crust tectonically resting on the underplating European crust. The Penninic ophiolites mark the remnants of the Mesozoic ocean basin (Meliata). The Oligocene granitoids between the Tauern window and the Peri-Adriatic lineament represent the postcollisional intrusions in the eastern Alps. Modified from Castellarin et al. (2006), with additional data from Coward and Dietrich (1989); Lüschen et al. (2006); Ortner et al. (2006).
  • (B) Northern Apennines. Following the collision of Adria with the Apenninic platform and Europe in the late Miocene, the westward subduction of the Adriatic lithosphere and the slab roll-back (eastward) produced a broad extensional regime in the west (Apenninic back-arc extension) affecting the Alpine orogenic crust, and also a frontal thrust belt to the east. Lithospheric-scale extension in this broad back-arc environment above the west-dipping Adria lithosphere resulted in the development of a large boudinage structure in the European (Alpine) lithosphere. Modified from Doglioni et al. (1999), with data from Spakman and Wortel (2004); Zeck (1999).
  • (C) Western Mediterranean–Southern Apennines–Calabria. The westward subduction of the Ionian seafloor as part of Adria since ca. 23 Ma and the associated slab roll-back have induced eastward-progressing extension and lithospheric necking through time, producing a series of basins. Rifting of Sardinia from continental Europe developed the Gulf of Lion passive margin and the Algero-Provencal basin (ca. 15–10 Ma), then the Vavilov and Marsili sub-basins in the broader Tyrrhenian basin to the east (ca. 5 Ma to present). Eastward-migrating lithospheric-scale extension and
    necking and asthenospheric upwelling have produced locally well-developed alkaline volcanism (e.g., Sardinia). Slab tear or detachment in the Calabria segment of Adria, as imaged through seismic tomography (Spakman and Wortel, 2004), is probably responsible for asthenospheric upwelling and alkaline volcanism in southern Calabria and eastern Sicily (e.g., Mount Etna). Modified from Séranne (1999), with additional data from Spakman et al. (1993); Doglioni et al. (1999); Spakman and Wortel (2004); Lentini et al. (this volume).
  • (D) Southern Apennines–Albanides–Hellenides. Note the break where the Adriatic Sea is located between the western and eastern sections along this traverse. The Adria plate and the remnant Ionian oceanic lithosphere underlie the Apenninic-Maghrebian orogenic belt. The Alpine-Tethyan and Apulian platform units are telescoped along ENE-vergent thrust faults. The Tyrrhenian Sea opened up in the latest Miocene as a back-arc basin behind the Apenninic-Maghrebian mountain belt. The Aeolian volcanoes in the Tyrrhenian Sea represent the volcanic arc system in this subduction-collision zone environment. Modified from Lentini et al. (this volume). The eastern section of this traverse across the Albanides-Hellenides in the northern Balkan Peninsula shows a bidivergent crustal architecture, with the Jurassic Tethyan ophiolites (Mirdita ophiolites in Albania and Western Hellenic ophiolites in Greece) forming the highest tectonic nappe, resting on the Cretaceous and younger flysch deposits of the Adria affinity to the west and the Pelagonia affinity to the east. Following the emplacement of the Mirdita- Hellenic ophiolites onto the Pelagonian ribbon continent in the Early Cretaceous, the Adria plate collided with Pelagonia-Europe obliquely starting around ca. 55 Ma. WSW-directed thrusting, developed as a result of this oblique collision, has been migrating westward into the peri-Adriatic depression. Modified from Dilek et al. (2005).
  • (E) Dinarides–Pannonian basin–Carpathians. The Carpathians developed as a result of the diachronous collision of the Alcapa and Tsia lithospheric blocks, respectively, with the southern edge of the East European platform during the early to middle Miocene (Nemcok et al., 1998; Seghedi et al., 2004). The Pannonian basin evolved as a back-arc basin above the eastward retreating European platform slab (Royden, 1988). Lithospheric-scale necking and boudinage development occurred synchronously with this extension and resulted in the isolation of continental fragments (e.g., the Apuseni mountains) within a broadly extensional Pannonian basin separating the Great Hungarian Plain and the Transylvanian subbasin. Steepening and tearing of the west-dipping slab may have caused asthenospheric flow and upwelling, decompressional melting, and alkaline volcanism (with an ocean island basalt–like mantle source) in the Eastern Carpathians. Modified from Royden (1988), with additional data from Linzer (1996); Nemcok et al. (1998); Doglioni et al. (1999); Seghedi et al. (2004).
  • (F) Arabia-Eurasia collision zone and the Turkish-Iranian plateau. The collision of Arabia with Eurasia around 13 Ma resulted in (1) development of a thick orogenic crust via intracontinental convergence and shortening and a high plateau and (2) westward escape of a lithospheric block (the Anatolian microplate) away from the collision front. The Arabia plate and the Bitlis-Pütürge ribbon continent were probably amalgamated earlier (ca. the Eocene) via a separate collision event within the Neo-Tethyan realm. BSZ—Bitlis suture zone; EKP—Erzurum-Kars plateau. A slab break-off and the subsequent removal of the lithospheric mantle (lithospheric delamination) beneath the eastern Anatolian accretionary complex caused asthenospheric upwelling and extensive melting, leading to continental volcanism and regional uplift, which has contributed to the high mean elevation of the Turkish-Iranian plateau. The Eastern Turkey Seismic Experiment results have shown that the crustal thickness here is ~ 45–48 km and that the Turkish-Iranian plateau is devoid of mantle lithosphere. The collision-induced convergence has been accommodated by active diffuse north-south shortening and oblique-slip faults dispersing crustal blocks both to the west and the east. The late Miocene through Plio-Quaternary volcanism appears to have become more alkaline toward the south in time. The Pleistocene Karacadag shield volcano in the Arabian foreland represents a local fissure eruption associated with intraplate extension. Data from Pearce et al. (1990); Keskin (2003); Sandvol et al. (2003); S¸engör et al. (2003).
  • (G) Africa-Eurasia collision zone and the Aegean extensional province. The African lithosphere is subducting beneath Eurasia at the Hellenic trench. The Mediterranean Ridge represents a lithospheric block between the Africa and Eurasian plate (Hsü, 1995). The Aegean extensional province straddles the Anatolide-Tauride and Sakarya continental blocks, which collided in the Eocene. NAF—North Anatolian fault. South-transported Tethyan ophiolite nappes were derived from the suture zone between these two continental blocks. Postcollisional granitic intrusions (Eocone and Oligo-Miocene, shown in red) occur mainly north of the suture zone and at the southern edge of the Sakarya continent. Postcollisional volcanism during the Eocene–Quaternary appears to have migrated southward and to have changed from calc-alkaline to alkaline in composition through time. Lithospheric-scale necking, reminiscent of the Europe-Apennine-Adria collision system, and associated extension are also important processes beneath the Aegean and have resulted in the exhumation of core complexes, widespread upper crustal attenuation, and alkaline and mid-ocean ridge basalt volcanism. Slab steepening and slab roll-back appear to have been at work resulting in subduction zone magmatism along the Hellenic arc.
  • Here is another cross section that shows the temporal evolution of the tectonics of this region in the area of cross section G-G’ above (Dilek and Sandvol, 2009).

  • Late Mesozoic–Cenozoic geodynamic evolution of the western Anatolian orogenic belt as a result of collisional
    and extensional processes in the upper plate of north-dipping subduction zone(s) within the Tethyan realm. See text
    for discussion.

  • Here is the map showing the historic earthquake mechanisms from Jolivet et al. (2013).

  • Focal mechanisms of earthquakes over the Aegean Anatolian region.

Seismic Hazard and Seismic Risk

  • These are the two maps shown in the map above, the GEM Seismic Hazard and the GEM Seismic Risk maps from Pagani et al. (2018) and Silva et al. (2018).
    • The GEM Seismic Hazard Map:


    • The Global Earthquake Model (GEM) Global Seismic Hazard Map (version 2018.1) depicts the geographic distribution of the Peak Ground Acceleration (PGA) with a 10% probability of being exceeded in 50 years, computed for reference rock conditions (shear wave velocity, VS30, of 760-800 m/s). The map was created by collating maps computed using national and regional probabilistic seismic hazard models developed by various institutions and projects, and by GEM Foundation scientists. The OpenQuake engine, an open-source seismic hazard and risk calculation software developed principally by the GEM Foundation, was used to calculate the hazard values. A smoothing methodology was applied to homogenise hazard values along the model borders. The map is based on a database of hazard models described using the OpenQuake engine data format (NRML). Due to possible model limitations, regions portrayed with low hazard may still experience potentially damaging earthquakes.
    • Here is a view of the GEM seismic hazard map for Europe, the western Middle East, and Northern Africa.

    • The GEM Seismic Risk Map:


    • The Global Seismic Risk Map (v2018.1) presents the geographic distribution of average annual loss (USD) normalised by the average construction costs of the respective country (USD/m2) due to ground shaking in the residential, commercial and industrial building stock, considering contents, structural and non-structural components. The normalised metric allows a direct comparison of the risk between countries with widely different construction costs. It does not consider the effects of tsunamis, liquefaction, landslides, and fires following earthquakes. The loss estimates are from direct physical damage to buildings due to shaking, and thus damage to infrastructure or indirect losses due to business interruption are not included. The average annual losses are presented on a hexagonal grid, with a spacing of 0.30 x 0.34 decimal degrees (approximately 1,000 km2 at the equator). The average annual losses were computed using the event-based calculator of the OpenQuake engine, an open-source software for seismic hazard and risk analysis developed by the GEM Foundation. The seismic hazard, exposure and vulnerability models employed in these calculations were provided by national institutions, or developed within the scope of regional programs or bilateral collaborations.
  • Here is a view of the GEM seismic risk map for Europe, the western Middle East, and Northern Africa.

    Social Media

    References:

    Basic & General References

  • Frisch, W., Meschede, M., Blakey, R., 2011. Plate Tectonics, Springer-Verlag, London, 213 pp.
  • Hayes, G., 2018, Slab2 – A Comprehensive Subduction Zone Geometry Model: U.S. Geological Survey data release, https://doi.org/10.5066/F7PV6JNV.
  • Holt, W. E., C. Kreemer, A. J. Haines, L. Estey, C. Meertens, G. Blewitt, and D. Lavallee (2005), Project helps constrain continental dynamics and seismic hazards, Eos Trans. AGU, 86(41), 383–387, , https://doi.org/10.1029/2005EO410002. /li>
  • Jessee, M.A.N., Hamburger, M. W., Allstadt, K., Wald, D. J., Robeson, S. M., Tanyas, H., et al. (2018). A global empirical model for near-real-time assessment of seismically induced landslides. Journal of Geophysical Research: Earth Surface, 123, 1835–1859. https://doi.org/10.1029/2017JF004494
  • Kreemer, C., J. Haines, W. Holt, G. Blewitt, and D. Lavallee (2000), On the determination of a global strain rate model, Geophys. J. Int., 52(10), 765–770.
  • Kreemer, C., W. E. Holt, and A. J. Haines (2003), An integrated global model of present-day plate motions and plate boundary deformation, Geophys. J. Int., 154(1), 8–34, , https://doi.org/10.1046/j.1365-246X.2003.01917.x.
  • Kreemer, C., G. Blewitt, E.C. Klein, 2014. A geodetic plate motion and Global Strain Rate Model in Geochemistry, Geophysics, Geosystems, v. 15, p. 3849-3889, https://doi.org/10.1002/2014GC005407.
  • Meyer, B., Saltus, R., Chulliat, a., 2017. EMAG2: Earth Magnetic Anomaly Grid (2-arc-minute resolution) Version 3. National Centers for Environmental Information, NOAA. Model. https://doi.org/10.7289/V5H70CVX
  • Müller, R.D., Sdrolias, M., Gaina, C. and Roest, W.R., 2008, Age spreading rates and spreading asymmetry of the world’s ocean crust in Geochemistry, Geophysics, Geosystems, 9, Q04006, https://doi.org/10.1029/2007GC001743
  • Pagani,M. , J. Garcia-Pelaez, R. Gee, K. Johnson, V. Poggi, R. Styron, G. Weatherill, M. Simionato, D. Viganò, L. Danciu, D. Monelli (2018). Global Earthquake Model (GEM) Seismic Hazard Map (version 2018.1 – December 2018), DOI: 10.13117/GEM-GLOBAL-SEISMIC-HAZARD-MAP-2018.1
  • Silva, V ., D Amo-Oduro, A Calderon, J Dabbeek, V Despotaki, L Martins, A Rao, M Simionato, D Viganò, C Yepes, A Acevedo, N Horspool, H Crowley, K Jaiswal, M Journeay, M Pittore, 2018. Global Earthquake Model (GEM) Seismic Risk Map (version 2018.1). https://doi.org/10.13117/GEM-GLOBAL-SEISMIC-RISK-MAP-2018.1
  • Zhu, J., Baise, L. G., Thompson, E. M., 2017, An Updated Geospatial Liquefaction Model for Global Application, Bulletin of the Seismological Society of America, 107, p 1365-1385, https://doi.org/0.1785/0120160198
  • Specific References

  • Basili R., G. Valensise, P. Vannoli, P. Burrato, U. Fracassi, S. Mariano, M.M. Tiberti, E. Boschi (2008), The Database of Individual Seismogenic Sources (DISS), version 3: summarizing 20 years of research on Italy’s earthquake geology, Tectonophysics, doi:10.1016/j.tecto.2007.04.014
  • Brun, J.-P., Sokoutis, D., 2012. 45 m.y. of Aegean crust and mantle flow driven by trench retreat. Geol. Soc. Am., v. 38, p. 815–818.
  • Caputo, R., Chatzipetros, A., Pavlides, S., and Sboras, S., 2012. The Greek Database of Seismogenic Sources (GreDaSS): state-of-the-art for northern Greece in Annals of Geophysics, v. 55, no. 5, doi: 10.4401/ag-5168
  • Dilek, Y. and Sandvol, E., 2006. Collision tectonics of the Mediterranean region: Causes and consequences in Dilek, Y., and Pavlides, S., eds., Postcollisional tectonics and magmatism in the Mediterranean region and Asia: Geological Society of America Special Paper 409, p. 1–13
  • DISS Working Group (2015). Database of Individual Seismogenic Sources (DISS), Version 3.2.0: A compilation of potential sources for earthquakes larger than M 5.5 in Italy and surrounding areas. http://diss.rm.ingv.it/diss/, Istituto Nazionale di Geofisica e Vulcanologia; DOI:10.6092/INGV.IT-DISS3.2.0.
  • Ersoy, E.Y., Cemen, I., Helvaci, C., and Billor, Z., 2014. Tectono-stratigraphy of the Neogene basins in Western Turkey: Implications for tectonic evolution of the Aegean Extended Region in Tectonophysics v. 635, p. 33-58.
  • Ganas, A., and T. Parsons (2009), Three-dimensional model of Hellenic Arc deformation and origin of the Cretan uplift, J. Geophys. Res., 114, B06404, doi:10.1029/2008JB005599
  • Ganas, A., Oikonomou, I.A., and Tsimi, C., 2013. NOAFAULTS: A Digital Database for Active Faults in Greece in Bulletin of the Geological Society of Greece, v. XLVII, Proceedings fo the 13th International Cogfress, Chania, Sept, 2013
  • Kokkalas, S., Xypolias, P., Koukouvelas, I., and Doutsos, T., 2006, Postcollisional contractional and extensional deformation in the Aegean region, in Dilek, Y., and Pavlides, S., eds., Postcollisional tectonics and magmatism in the Mediterranean region and Asia: Geological Society of America Special Paper 409, p. 97–123, doi: 10.1130/2006.2409(06)
  • Papazachos, B.C., Papadimitrious, E.E., Kiratzi, A.A., Papazachos, C.B., and Louvari, E.k., 1998. Fault Plane Solutions in the Aegean Sea and the Surrounding Area and their Tectonic Implication, in Bollettino Di Geofisica Terorica Ed Applicata, v. 39, no. 3, p. 199-218.
  • Taymaz, T. , Yilmaz, Y., and Dilek, Y., 2007. The geodynamics of the Aegean and Anatolia: introduction in TAYMAZ, T., YILMAZ, Y. & DILEK, Y. (eds) The Geodynamics of the Aegean and Anatolia. Geological Society, London, Special Publications, 291, 1–16. DOI: 10.1144/SP291.1 0305-8719/07
  • Wouldloper, 2009. Tectonic map of southern Europe and the Middle East, showing tectonic structures of the western Alpide mountain belt. Only Alpine (tertiary) structures are shown.

Return to the Earthquake Reports page.


Earthquake Report: Banda Sea

Early morning (my time) there was an intermediate depth earthquake in the Banda Sea.
https://earthquake.usgs.gov/earthquakes/eventpage/us70009b14/executive
This earthquake was a strike-slip earthquake in the Australia plate. There are analogical earthquakes in the same area in 1963, 1987, 2005, and 2012 that appear to have occurred on the same fault.
In June 2019 there was an earthquake nearby with a similar mechanism.

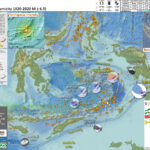
Below is my interpretive poster for this earthquake

  • I plot the seismicity from the past 3 months, with diameter representing magnitude (see legend). I include earthquake epicenters from 1920-2020 with magnitudes M ≥ 6.5.
  • I plot the USGS fault plane solutions (moment tensors in blue and focal mechanisms in orange), possibly in addition to some relevant historic earthquakes.
  • A review of the basic base map variations and data that I use for the interpretive posters can be found on the Earthquake Reports page.
  • Some basic fundamentals of earthquake geology and plate tectonics can be found on the Earthquake Plate Tectonic Fundamentals page.

    Global Strain

  • In a map below, I include a transparent overlay of the Global Strain Rate Map (Kreemer et al., 2014).
  • The mission of the Global Strain Rate Map (GSRM) project is to determine a globally self-consistent strain rate and velocity field model, consistent with geodetic and geologic field observations. The overall mission also includes:
    1. contributions of global, regional, and local models by individual researchers
    2. archive existing data sets of geologic, geodetic, and seismic information that can contribute toward a greater understanding of strain phenomena
    3. archive existing methods for modeling strain rates and strain transients
  • The completed global strain rate map will provide a large amount of information that is vital for our understanding of continental dynamics and for the quantification of seismic hazards.
  • The version used in the poster(s) below is an update to the original 2004 map (Kreemer et al., 2000, 2003; Holt et al., 2005).

    I include some inset figures. Some of the same figures are located in different places on the larger scale map below.

  • In the upper right corner is a map showing historic seismicity, fault lines, and the global strain rate map (red shows area of higher tectonic strain).
  • In the lower right corner is a low angle oblique view of the tectonic plate configuration (Pownall et al., 2014).
  • In the upper left corner are maps that show the seismic hazard and seismic risk for Indonesia. I spend more time explaining this below.
  • In the center top-left is a map that shows earthquake intensity using the Modified Mercalli Intensity (MMI) Scale.
  • Here is the map with a month’s seismicity plotted.

  • Here is the poster from the nearby earthquake in June of 2019.

Other Report Pages

Some Relevant Discussion and Figures

  • Here is a tectonic map for this part of the world from Zahirovic et al., 2014. They show a fracture zone where the M 7.3 earthquake happened. I left out all the acronym definitions (you’re welcome), but they are listed in the paper.

  • Regional tectonic setting with plate boundaries (MORs/transforms = black, subduction zones = teethed red) from Bird (2003) and ophiolite belts representing sutures modified from Hutchison (1975) and Baldwin et al. (2012). West Sulawesi basalts are from Polvé et al. (1997), fracture zones are from Matthews et al. (2011) and basin outlines are from Hearn et al. (2003).

  • This is a great visualization showing the Australia plate and how it formed the largest forearc basin on Earth (Pownall et al., 2014).
  • The maps on the left show a time history of the tectonics. The low angle oblique view on the right shows the dipping crust (north is not always up, as in this figure).
  • In the lower right, they show how there is strike-slip faulting along the Seram trough also (I left out the figure caption for E).

  • Reconstructions of eastern Indonesia, adapted from Hall (2012), depict collision of Australia with Southeast Asia and slab rollback into Banda Embayment. Yellow star indicates Seram. Oceanic crust is shown in purple (older than 120 Ma) and blue (younger than 120 Ma); submarine arcs and oceanic plateaus are shown in cyan; volcanic island arcs, ophiolites, and material accreted along plate margins are shown in green. A: Reconstruction at 15 Ma. B: Reconstruction at 7 Ma. C: Reconstruction at 2 Ma. D: Visualization of present-day slab morphology of proto–Banda Sea based on earthquake hypocenter distribution and tomographic models

  • Here is a map and some cross sections showing seismic tomography (like C-T scans into the Earth using seismic waves instead of X-Rays). The map shows the location of the cross sections (Spakman et al., 2010).

  • The Banda arc and surrounding region. 200 m and 4,000 m bathymetric contours are indicated. The numbered black lines are Benioff zone contours in kilometres. The red triangles are Holocene volcanoes (http://www.volcano.si.edu/world/). Ar=Aru, Ar Tr=Aru trough, Ba=Banggai Islands, Bu=Buru, SBS=South Banda Sea, Se=Seram, Sm=Sumba, Su=Sula Islands, Ta=Tanimbar, Ta Tr=Tanimbar trough, Ti=Timor, W=Weber Deep.


    Tomographic images of the Banda slab. Vertical sections through the tomography model along the lines shown in Fig. 1. Colours: P-wave anomalies with reference to velocity model ak135 (ref. 30). Dots: earthquake hypocentres within 12 km of the section. The dashed lines are phase changes at ~410 km and ~660 km. The sections are plotted without vertical exaggeration; the horizontal axis is in degrees. The labelled positive anomalies are the Sunda (Su) and Banda (Ba) slabs: BuDdetached slab under Buru, FlDslab under Flores, SDslab under Seram, TDslab under Timor. a, The Sunda slab enters the lower mantle whereas the Banda embayment slab is entirely in the upper mantle with the change under Sulawesi. b–e, Banda slab morphology in sections parallel to Australia plate motion shows a transition from a steep slab with a flat section (fs) (b) to a spoon shape shallowing eastward (c–e).

  • Here is the tectonic map from Hengesh and Whitney (2016)

  • Illustration of major tectonic elements in triple junction geometry: tectonic features labeled per Figure 1; seismicity from ISC-GEM catalog [Storchak et al., 2013]; faults in Savu basin from Rigg and Hall [2011] and Harris et al. [2009]. Purple line is edge of Australian continental basement and fore arc [Rigg and Hall, 2011]. Abbreviations: AR = Ashmore Reef; SR = Scott Reef; RS = Rowley Shoals; TCZ = Timor Collision Zone; ST = Savu thrust; SB = Savu Basin; TT = Timor thrust; WT =Wetar thrust; WASZ = Western Australia Shear Zone. Open arrows indicate relative direction of motion; solid arrows direction of vergence.

  • Here is the Audley (2011) cross section showing how the backthrust relates to the subduction zone beneath Timor. I include their figure caption in blockquote below.

  • Cartoon cross section of Timor today, (cf. Richardson & Blundell 1996, their BIRPS figs 3b, 4b & 7; and their fig. 6 gravity model 2 after Woodside et al. 1989; and Snyder et al. 1996 their fig. 6a). Dimensions of the filled 40 km deep present-day Timor Tectonic Collision Zone are based on BIRPS seismic, earthquake seismicity and gravity data all re-interpreted here from Richardson & Blundell (1996) and from Snyder et al. (1996). NB. The Bobonaro Melange, its broken formation and other facies are not indicated, but they are included with the Gondwana mega-sequence. Note defunct Banda Trench, now the Timor TCZ, filled with Australian continental crust and Asian nappes that occupy all space between Wetar Suture and the 2–3 km deep deformation front north of the axis of the Timor Trough. Note the much younger decollement D5 used exactly the same part of the Jurassic lithology of the Gondwana mega-sequence in the older D1 decollement that produced what appears to be much stronger deformation.

  • Here is a figure showing the regional geodetic motions (Bock et al., 2003). I include their figure caption below as a blockquote.

  • Topographic and tectonic map of the Indonesian archipelago and surrounding region. Labeled, shaded arrows show motion (NUVEL-1A model) of the first-named tectonic plate relative to the second. Solid arrows are velocity vectors derived from GPS surveys from 1991 through 2001, in ITRF2000. For clarity, only a few of the vectors for Sumatra are included. The detailed velocity field for Sumatra is shown in Figure 5. Velocity vector ellipses indicate 2-D 95% confidence levels based on the formal (white noise only) uncertainty estimates. NGT, New Guinea Trench; NST, North Sulawesi Trench; SF, Sumatran Fault; TAF, Tarera-Aiduna Fault. Bathymetry [Smith and Sandwell, 1997] in this and all subsequent figures contoured at 2 km intervals.

  • Whitney and Hengesh (2015) used GPS modeling to suggest a model of plate blocks. Below are their model results.

  • Plate boundary segments in the Banda Arc region from Nugroho et al (2009). Numbers inside rectangles show possible micro-plate blocks near the Sumba Triple Junction (colored) based on GPS velocities (black arrows) with in a stable Eurasian reference frame.

  • Here is the conceptual model from Whitney and Hengesh (2015) that shows how left-lateral strike-slip faulting can come into the region.

  • Schematic map views of kinematic relations between major crustal elements in the Sumba Triple Junction region. CTZ= collisional tectonic zone. Red arrow size designates schematic plate motion relations based on geological data relative to a fixed Sunda shelf reference frame (pin).

Seismic Hazard and Seismic Risk

  • These are the two maps shown in the map above, the GEM Seismic Hazard and the GEM Seismic Risk maps from Pagani et al. (2018) and Silva et al. (2018).
    • The GEM Seismic Hazard Map:


    • The Global Earthquake Model (GEM) Global Seismic Hazard Map (version 2018.1) depicts the geographic distribution of the Peak Ground Acceleration (PGA) with a 10% probability of being exceeded in 50 years, computed for reference rock conditions (shear wave velocity, VS30, of 760-800 m/s). The map was created by collating maps computed using national and regional probabilistic seismic hazard models developed by various institutions and projects, and by GEM Foundation scientists. The OpenQuake engine, an open-source seismic hazard and risk calculation software developed principally by the GEM Foundation, was used to calculate the hazard values. A smoothing methodology was applied to homogenise hazard values along the model borders. The map is based on a database of hazard models described using the OpenQuake engine data format (NRML). Due to possible model limitations, regions portrayed with low hazard may still experience potentially damaging earthquakes.
    • Here is a view of the GEM seismic hazard map for Indonesia.

    • The GEM Seismic Risk Map:


    • The Global Seismic Risk Map (v2018.1) presents the geographic distribution of average annual loss (USD) normalised by the average construction costs of the respective country (USD/m2) due to ground shaking in the residential, commercial and industrial building stock, considering contents, structural and non-structural components. The normalised metric allows a direct comparison of the risk between countries with widely different construction costs. It does not consider the effects of tsunamis, liquefaction, landslides, and fires following earthquakes. The loss estimates are from direct physical damage to buildings due to shaking, and thus damage to infrastructure or indirect losses due to business interruption are not included. The average annual losses are presented on a hexagonal grid, with a spacing of 0.30 x 0.34 decimal degrees (approximately 1,000 km2 at the equator). The average annual losses were computed using the event-based calculator of the OpenQuake engine, an open-source software for seismic hazard and risk analysis developed by the GEM Foundation. The seismic hazard, exposure and vulnerability models employed in these calculations were provided by national institutions, or developed within the scope of regional programs or bilateral collaborations.
  • Here is a view of the GEM seismic risk map for Indonesia.

    Social Media

    References:

    Basic & General References

  • Frisch, W., Meschede, M., Blakey, R., 2011. Plate Tectonics, Springer-Verlag, London, 213 pp.
  • Hayes, G., 2018, Slab2 – A Comprehensive Subduction Zone Geometry Model: U.S. Geological Survey data release, https://doi.org/10.5066/F7PV6JNV.
  • Holt, W. E., C. Kreemer, A. J. Haines, L. Estey, C. Meertens, G. Blewitt, and D. Lavallee (2005), Project helps constrain continental dynamics and seismic hazards, Eos Trans. AGU, 86(41), 383–387, , https://doi.org/10.1029/2005EO410002. /li>
  • Jessee, M.A.N., Hamburger, M. W., Allstadt, K., Wald, D. J., Robeson, S. M., Tanyas, H., et al. (2018). A global empirical model for near-real-time assessment of seismically induced landslides. Journal of Geophysical Research: Earth Surface, 123, 1835–1859. https://doi.org/10.1029/2017JF004494
  • Kreemer, C., J. Haines, W. Holt, G. Blewitt, and D. Lavallee (2000), On the determination of a global strain rate model, Geophys. J. Int., 52(10), 765–770.
  • Kreemer, C., W. E. Holt, and A. J. Haines (2003), An integrated global model of present-day plate motions and plate boundary deformation, Geophys. J. Int., 154(1), 8–34, , https://doi.org/10.1046/j.1365-246X.2003.01917.x.
  • Kreemer, C., G. Blewitt, E.C. Klein, 2014. A geodetic plate motion and Global Strain Rate Model in Geochemistry, Geophysics, Geosystems, v. 15, p. 3849-3889, https://doi.org/10.1002/2014GC005407.
  • Meyer, B., Saltus, R., Chulliat, a., 2017. EMAG2: Earth Magnetic Anomaly Grid (2-arc-minute resolution) Version 3. National Centers for Environmental Information, NOAA. Model. https://doi.org/10.7289/V5H70CVX
  • Müller, R.D., Sdrolias, M., Gaina, C. and Roest, W.R., 2008, Age spreading rates and spreading asymmetry of the world’s ocean crust in Geochemistry, Geophysics, Geosystems, 9, Q04006, https://doi.org/10.1029/2007GC001743
  • Pagani,M. , J. Garcia-Pelaez, R. Gee, K. Johnson, V. Poggi, R. Styron, G. Weatherill, M. Simionato, D. Viganò, L. Danciu, D. Monelli (2018). Global Earthquake Model (GEM) Seismic Hazard Map (version 2018.1 – December 2018), DOI: 10.13117/GEM-GLOBAL-SEISMIC-HAZARD-MAP-2018.1
  • Silva, V ., D Amo-Oduro, A Calderon, J Dabbeek, V Despotaki, L Martins, A Rao, M Simionato, D Viganò, C Yepes, A Acevedo, N Horspool, H Crowley, K Jaiswal, M Journeay, M Pittore, 2018. Global Earthquake Model (GEM) Seismic Risk Map (version 2018.1). https://doi.org/10.13117/GEM-GLOBAL-SEISMIC-RISK-MAP-2018.1
  • Zhu, J., Baise, L. G., Thompson, E. M., 2017, An Updated Geospatial Liquefaction Model for Global Application, Bulletin of the Seismological Society of America, 107, p 1365-1385, https://doi.org/0.1785/0120160198
  • Specific References

  • Audley-Charles, M.G., 1986. Rates of Neogene and Quaternary tectonic movements in the Southern Banda Arc based on micropalaeontology in: Journal of fhe Geological Society, London, Vol. 143, 1986, pp. 161-175.
  • Audley-Charles, M.G., 2011. Tectonic post-collision processes in Timor, Hall, R., Cottam, M. A. &Wilson, M. E. J. (eds) The SE Asian Gateway: History and Tectonics of the Australia–Asia Collision. Geological Society, London, Special Publications, 355, 241–266.
  • Baldwin, S.L., Fitzgerald, P.G., and Webb, L.E., 2012. Tectonics of the New Guinea Region in Annu. Rev. Earth Planet. Sci., v. 41, p. 485-520.
  • Benz, H.M., Herman, Matthew, Tarr, A.C., Hayes, G.P., Furlong, K.P., Villaseñor, Antonio, Dart, R.L., and Rhea, Susan, 2011. Seismicity of the Earth 1900–2010 New Guinea and vicinity: U.S. Geological Survey Open-File Report 2010–1083-H, scale 1:8,000,000.
  • Given, J. W., and H. Kanamori (1980). The depth extent of the 1977 Sumbawa, Indonesia, earthquake, in EOS Trans. AGU., v. 61, p. 1044.
  • Gusnman, A.R., Tanioka, Y., Matsumoto, H., and Iwasakai, S.-I., 2009. Analysis of the Tsunami Generated by the Great 1977 Sumba Earthquake that Occurred in Indonesia in BSSA, v. 99, no. 4, p. 2169-2179, https://doi.org/10.1785/0120080324
  • Hall, R., 2011. Australia-SE Asia collision: plate tectonics and crustal flow in Geological Society, London, Special Publications 2011; v. 355; p. 75-109 doi: 10.1144/SP355.5
  • Hangesh, J. and Whitney, B., 2014. Quaternary Reactivation of Australia’s Western Passive Margin: Inception of a New Plate Boundary? in: 5th International INQUA Meeting on Paleoseismology, Active Tectonics and Archeoseismology (PATA), 21-27 September 2014, Busan, Korea, 4 pp.
  • Okal, E. A., & Reymond, D., 2003. The mechanism of great Banda Sea earthquake of 1 February 1938: applying the method of preliminary determination of focal mechanism to a historical event in EPSL, v. 216, p. 1-15.
  • Osada, M. and Abe, K., 1981. Mechanism and tectonic implications of the great Banda Sea earthquake of November 4, 1963 in Physics of the Earth and Plentary Interiors, v. 25, p. 129-139
  • Pownall, J.M., Hall, R., Armstrong,, R.A., and Forster, M.A., 2014. Earth’s youngest known ultrahigh-temperature granulites discovered on Seram, eastern Indonesia in Geology, v. 42, no. 4, p. 379-282, https://doi.org/10.1130/G35230.1
  • Spakman, W. and Hall, R., 2010. Surface deformation and slab–mantle interaction during Banda arc subduction rollback in Nature Geosceince, v. 3, p. 562-566, https://doi.org/10.1038/NGEO917
  • Whitney, B.B. and Hengesh, J.V., 2015. A new model for active intraplate tectonics in western Australia in Proceedings of the Tenth Pacific Conference on Earthquake Engineering Building an Earthquake-Resilient Pacific 6-8 November 2015, Sydney, Australia, paper number 82
  • Zahirovic, S., Seton, M., and Müller, R.D., 2014. The Cretaceous and Cenozoic tectonic evolution of Southeast Asia in Solid Earth, v. 5, p. 227-273, doi:10.5194/se-5-227-2014

Return to the Earthquake Reports page.