Earthquake Report: New Britain

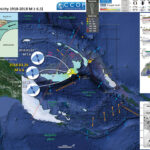
Well, those earthquakes from earlier, one a foreshock to a later one, were foreshocks to an earthquake today! Here is my report from a couple days ago. The M 6.6 and M 6.3 straddle today’s earthquake and all have similar hypocentral depths.
There are no major updates in this report compared to the earthquake report from a few days ago. I did add a couple figures from Dr. Stephen Hicks that they posted on their twitter feed. Dr. Hicks is currently working on a paper that uses seismicity to characterize the subduction zone here.
The New Britain region is one of the more active regions in the world. See a list of earthquake reports for this region at the bottom of this page, above the reference list.
In the poster below, the recent seismicity in Papua New Guinea and New Britain is evident.

Below is my interpretive poster for this earthquake

I plot the seismicity from the past month, with color representing depth and diameter representing magnitude (see legend).
I plot the USGS fault plane solutions (moment tensors in blue and focal mechanisms in orange) for these earthquakes. I also include moment tensors from earthquakes on the Island of New Guinea (2018.02.25) and near New Ireland (2018.03.08).

  • I placed a moment tensor / focal mechanism legend on the poster. There is more material from the USGS web sites about moment tensors and focal mechanisms (the beach ball symbols). Both moment tensors and focal mechanisms are solutions to seismologic data that reveal two possible interpretations for fault orientation and sense of motion. One must use other information, like the regional tectonics, to interpret which of the two possibilities is more likely.
  • I also include the shaking intensity contours on the map. These use the Modified Mercalli Intensity Scale (MMI; see the legend on the map). This is based upon a computer model estimate of ground motions, different from the “Did You Feel It?” estimate of ground motions that is actually based on real observations. The MMI is a qualitative measure of shaking intensity. More on the MMI scale can be found here and here. This is based upon a computer model estimate of ground motions, different from the “Did You Feel It?” estimate of ground motions that is actually based on real observations.
  • I include the slab contours plotted (Hayes et al., 2012), which are contours that represent the depth to the subduction zone fault. These are mostly based upon seismicity. The depths of the earthquakes have considerable error and do not all occur along the subduction zone faults, so these slab contours are simply the best estimate for the location of the fault.
  • I include some inset figures.

  • In the upper left corner are two figures from Oregon State University, which are based upon Hamilton (1979). “Tectonic microplates of the Melanesian region. Arrows show net plate motion relative to the Australian Plate.” To the right of the map is a cross section showing how the Solomon Sea plate is subducting beneath New Britain. This is from Johnson, 1976. I place a blue star in the general location of today’s earthquake (as also for other inset figures).
  • In the lower right corner is another generalized tectonic map of the region from Holm et al., 2015.
  • In the upper right corner are figures from Dr. Stephen Hicks. On the left is a map that shows seismicity in this region. There is a blue star in the location of the M 6.9 earthquake and a yellow star (and focal mechanism) for the M 6.6 earthquake. Dr. Hicks plots seismicity as a cross section on the right (with the spatial extent oulined in a dashed rectangle on the map).


USGS Earthquake Pages

    Here are some recent reports for other seismicity in the region.

  • On 2018.02.25 there was a M 7.5 earthquake on the island of New Guinea. Here is my report update on that sequence. Below are my original poster and an aftershock update poster.


  • On 2018.03.08 there was an > 6.8 earthquake in New Ireland that also shows up on the map today. Here is my report on this earthquake. Below is my interpretive poster (with and without magnetic anomaly data).


Some Relevant Discussion and Figures

  • This is a map showing the seismicity of this region since 2000 A.D.

  • Earlier, I discussed seismicity from 2000-2015 here. The seismicity on the west of this region appears aligned with north-south shortening along the New Britain trench, while seismicity on the east of this region appears aligned with more east-west shortening. Here is a map that I put together where I show these two tectonic domains with the seismicity from this time period (today’s earthquakes are not plotted on this map, but one may see where they might plot).

  • Here is the generalized tectonic map of the region from Holm et al., 2015. I include the figure caption below as a blockquote.

  • Tectonic setting and mineral deposits of eastern Papua New Guinea and Solomon Islands. The modern arc setting related to formation of the mineral deposits comprises, from west to east, the West Bismarck arc, the New Britain arc, the Tabar-Lihir-Tanga-Feni Chain and the Solomon arc, associated with north-dipping subduction/underthrusting at the Ramu-Markham fault zone, New Britain trench and San Cristobal trench respectively. Arrows denote plate motion direction of the Australian and Pacific plates. Filled triangles denote active subduction. Outlined triangles denote slow or extinct subduction. NBP: North Bismarck plate; SBP: South Bismarck plate; AT: Adelbert Terrane; FT: Finisterre Terrane; RMF: Ramu-Markham fault zone; NBT: New Britain trench.

  • Here is the slab interpretation for the New Britain region from Holm and Richards, 2013. I include the figure caption below as a blockquote.

  • 3-D model of the Solomon slab comprising the subducted Solomon Sea plate, and associated crust of the Woodlark Basin and Australian plate subducted at the New Britain and San Cristobal trenches. Depth is in kilometres; the top surface of the slab is contoured at 20 km intervals from the Earth’s surface (black) to termination of slabrelated seismicity at approximately 550 km depth (light brown). Red line indicates the locations of the Ramu-Markham Fault (RMF)–New Britain trench (NBT)–San Cristobal trench (SCT); other major structures are removed for clarity; NB, New Britain; NI, New Ireland; SI, Solomon Islands; SS, Solomon Sea; TLTF, Tabar–Lihir–Tanga–Feni arc. See text for details.

  • Here are the forward models for the slab in the New Britain region from Holm and Richards, 2013. I include the figure caption below as a blockquote.

  • Forward tectonic reconstruction of progressive arc collision and accretion of New Britain to the Papua New Guinea margin. (a) Schematic forward reconstruction of New Britain relative to Papua New Guinea assuming continued northward motion of the Australian plate and clockwise rotation of the South Bismarck plate. (b) Cross-sections illustrate a conceptual interpretation of collision between New Britain and Papua New Guinea.

  • This map shows plate velocities and euler poles for different blocks. Note the counterclockwise motion of the plate that underlies the Solomon Sea (Baldwin et al., 2012). I include the figure caption below as a blockquote.

  • Tectonic maps of the New Guinea region. (a) Seismicity, volcanoes, and plate motion vectors. Plate motion vectors relative to the Australian plate are surface velocity models based on GPS data, fault slip rates, and earthquake focal mechanisms (UNAVCO, http://jules.unavco.org/Voyager/Earth). Earthquake data are sourced from the International Seismological Center EHB Bulletin (http://www.isc.ac.uk); data represent events from January 1994 through January 2009 with constrained focal depths. Background image is generated from http://www.geomapapp.org. Abbreviations: AB, Arafura Basin; AT, Aure Trough; AyT, Ayu Trough; BA, Banda arc; BSSL, Bismarck Sea seismic lineation; BH, Bird’s Head; BT, Banda Trench; BTFZ, Bewani-Torricelli fault zone; DD, Dayman Dome; DEI, D’Entrecasteaux Islands; FP, Fly Platform; GOP, Gulf of Papua; HP, Huon peninsula; LA, Louisiade Archipelago; LFZ, Lowlands fault zone; MaT, Manus Trench; ML, Mt. Lamington; MT, Mt. Trafalgar; MuT, Mussau Trough; MV, Mt. Victory; MTB, Mamberamo thrust belt; MVF, Managalase Plateau volcanic field; NBT, New Britain Trench; NBA, New Britain arc; NF, Nubara fault; NGT, New Guinea Trench; OJP, Ontong Java Plateau; OSF, Owen Stanley fault zone; PFTB, Papuan fold-and-thrust belt; PP, Papuan peninsula; PRi, Pocklington Rise; PT, Pocklington Trough; RMF, Ramu-Markham fault; SST, South Solomons Trench; SA, Solomon arc; SFZ, Sorong fault zone; ST, Seram Trench; TFZ, Tarera-Aiduna fault zone; TJ, AUS-WDKPAC triple junction; TL, Tasman line; TT, Trobriand Trough;WD, Weber Deep;WB, Woodlark Basin;WFTB, Western (Irian) fold-and-thrust belt; WR,Woodlark Rift; WRi, Woodlark Rise; WTB, Weyland thrust; YFZ, Yapen fault zone.White box indicates the location shown in Figure 3. (b) Map of plates, microplates, and tectonic blocks and elements of the New Guinea region. Tectonic elements modified after Hill & Hall (2003). Abbreviations: ADB, Adelbert block; AOB, April ultramafics; AUS, Australian plate; BHB, Bird’s Head block; CM, Cyclops Mountains; CWB, Cendrawasih block; CAR, Caroline microplate; EMD, Ertsberg Mining District; FA, Finisterre arc; IOB, Irian ophiolite belt; KBB, Kubor & Bena blocks (including Bena Bena terrane); LFTB, Lengguru fold-and-thrust belt; MA, Mapenduma anticline; MB, Mamberamo Basin block; MO, Marum ophiolite belt; MHS, Manus hotspot; NBS, North Bismarck plate; NGH, New Guinea highlands block; NNG, Northern New Guinea block; OKT, Ok Tedi mining district; PAC, Pacific plate; PIC, Porgera intrusive complex; PSP, Philippine Sea plate; PUB, Papuan Ultramafic Belt ophiolite; SB, Sepik Basin block; SDB, Sunda block; SBS, South Bismarck plate; SIB, Solomon Islands block; WP, Wandamen peninsula; WDK, Woodlark microplate; YQ, Yeleme quarries.

  • This figure incorporates cross sections and map views of various parts of the regional tectonics (Baldwin et al., 2012). The New Britain region is in the map near the A and B sections. I include the figure caption below as a blockquote.

  • Oblique block diagram of New Guinea from the northeast with schematic cross sections showing the present-day plate tectonic setting. Digital elevation model was generated from http://www.geomapapp.org. Oceanic crust in tectonic cross sections is shown by thick black-and-white hatched lines, with arrows indicating active subduction; thick gray-and-white hatched lines indicate uncertain former subduction. Continental crust, transitional continental crust, and arc-related crust are shown without pattern. Representative geologic cross sections across parts of slices C and D are marked with transparent red ovals and within slices B and E are shown by dotted lines. (i ) Cross section of the Papuan peninsula and D’Entrecasteaux Islands modified from Little et al. (2011), showing the obducted ophiolite belt due to collision of the Australian (AUS) plate with an arc in the Paleogene, with later Pliocene extension and exhumation to form the D’Entrecasteaux Islands. (ii ) Cross section of the Papuan peninsula after Davies & Jaques (1984) shows the Papuan ophiolite thrust over metamorphic rocks of AUS margin affinity. (iii ) Across the Papuan mainland, the cross section after Crowhurst et al. (1996) shows the obducted Marum ophiolite and complex folding and thrusting due to collision of the Melanesian arc (the Adelbert, Finisterre, and Huon blocks) in the Late Miocene to recent. (iv) Across the Bird’s Head, the cross section after Bailly et al. (2009) illustrates deformation in the Lengguru fold-and-thrust belt as a result of Late Miocene–Early Pliocene northeast-southwest shortening, followed by Late Pliocene–Quaternary extension. Abbreviations as in Figure 2, in addition to NI, New Ireland; SI, Solomon Islands; SS, Solomon Sea; (U)HP, (ultra)high-pressure.

Social Media

Geologic Fundamentals

  • For more on the graphical representation of moment tensors and focal mechnisms, check this IRIS video out:
  • Here is a fantastic infographic from Frisch et al. (2011). This figure shows some examples of earthquakes in different plate tectonic settings, and what their fault plane solutions are. There is a cross section showing these focal mechanisms for a thrust or reverse earthquake. The upper right corner includes my favorite figure of all time. This shows the first motion (up or down) for each of the four quadrants. This figure also shows how the amplitude of the seismic waves are greatest (generally) in the middle of the quadrant and decrease to zero at the nodal planes (the boundary of each quadrant).

  • There are three types of earthquakes, strike-slip, compressional (reverse or thrust, depending upon the dip of the fault), and extensional (normal). Here is are some animations of these three types of earthquake faults. The following three animations are from IRIS.
  • Strike Slip:

    Compressional:

    Extensional:

Earthquake Report: New Britain

The New Britain region is one of the more active regions in the world. See a list of earthquake reports for this region at the bottom of this page, above the reference list.
Today’s M 6.6 earthquake happened close in proximity to a M 6.3 from 2 days ago and a M 5.6 from a couple weeks ago. The M 5.6 may be related (may have triggered these other earthquakes), but this region is so active, it might be difficult to distinguish the effects from different earthquakes. The M 5.6 is much deeper and looks like it was in the downgoing Solomon Sea plate. It is much more likely that the M 6.3 and M 6.6 are related (I interpret that the M 6.3 probably triggered the M 6.6, or that M 6.3 was a foreshock to the M 6.6, given they are close in depth). Both M 6.3 and M 6.6 are at depths close to the depth of the subducting slab (the megathrust fault depth) at this location. So, I interpret these to be subduction zone earthquakes.
In the poster below, the recent seismicity in Papua New Guinea is evident.

Below is my interpretive poster for this earthquake

I plot the seismicity from the past month, with color representing depth and diameter representing magnitude (see legend).
I plot the USGS fault plane solutions (moment tensors in blue and focal mechanisms in orange) for these earthquakes.

  • I placed a moment tensor / focal mechanism legend on the poster. There is more material from the USGS web sites about moment tensors and focal mechanisms (the beach ball symbols). Both moment tensors and focal mechanisms are solutions to seismologic data that reveal two possible interpretations for fault orientation and sense of motion. One must use other information, like the regional tectonics, to interpret which of the two possibilities is more likely.
  • I also include the shaking intensity contours on the map. These use the Modified Mercalli Intensity Scale (MMI; see the legend on the map). This is based upon a computer model estimate of ground motions, different from the “Did You Feel It?” estimate of ground motions that is actually based on real observations. The MMI is a qualitative measure of shaking intensity. More on the MMI scale can be found here and here. This is based upon a computer model estimate of ground motions, different from the “Did You Feel It?” estimate of ground motions that is actually based on real observations.
  • I include the slab contours plotted (Hayes et al., 2012), which are contours that represent the depth to the subduction zone fault. These are mostly based upon seismicity. The depths of the earthquakes have considerable error and do not all occur along the subduction zone faults, so these slab contours are simply the best estimate for the location of the fault.
  • I include some inset figures.

  • In the upper left corner are two figures from Oregon State University, which are based upon Hamilton (1979). “Tectonic microplates of the Melanesian region. Arrows show net plate motion relative to the Australian Plate.” To the right of the map is a cross section showing how the Solomon Sea plate is subducting beneath New Britain. This is from Johnson, 1976. I place a blue star in the general location of today’s earthquake (as also for other inset figures).
  • In the lower right corner is another generalized tectonic map of the region from Holm et al., 2015.
  • In the upper right corner is a figure from Baldwin et al. (2012). This figure shows a series of cross sections along this convergent plate boundary from the Solomon Islands in the east to Papua New Guinea in the west. Cross section ‘C’ is the most representative for the earthquake today. I place the general location of the C-C’ section on the main map as an orange dashed line. I present the map and this figure again below, with their original captions.


USGS Earthquake Pages

    Here are some recent reports for other seismicity in the region.

  • On 2018.02.25 there was a M 7.5 earthquake on the island of New Guinea. Here is my report update on that sequence. Below are my original poster and an aftershock update poster.


  • On 2018.03.08 there was an > 6.8 earthquake in New Ireland that also shows up on the map today. Here is my report on this earthquake. Below is my interpretive poster (with and without magnetic anomaly data).


Some Relevant Discussion and Figures

  • This is a map showing the seismicity of this region since 2000 A.D.

  • Earlier, I discussed seismicity from 2000-2015 here. The seismicity on the west of this region appears aligned with north-south shortening along the New Britain trench, while seismicity on the east of this region appears aligned with more east-west shortening. Here is a map that I put together where I show these two tectonic domains with the seismicity from this time period (today’s earthquakes are not plotted on this map, but one may see where they might plot).

  • Here is the generalized tectonic map of the region from Holm et al., 2015. I include the figure caption below as a blockquote.

  • Tectonic setting and mineral deposits of eastern Papua New Guinea and Solomon Islands. The modern arc setting related to formation of the mineral deposits comprises, from west to east, the West Bismarck arc, the New Britain arc, the Tabar-Lihir-Tanga-Feni Chain and the Solomon arc, associated with north-dipping subduction/underthrusting at the Ramu-Markham fault zone, New Britain trench and San Cristobal trench respectively. Arrows denote plate motion direction of the Australian and Pacific plates. Filled triangles denote active subduction. Outlined triangles denote slow or extinct subduction. NBP: North Bismarck plate; SBP: South Bismarck plate; AT: Adelbert Terrane; FT: Finisterre Terrane; RMF: Ramu-Markham fault zone; NBT: New Britain trench.

  • Here is the slab interpretation for the New Britain region from Holm and Richards, 2013. I include the figure caption below as a blockquote.

  • 3-D model of the Solomon slab comprising the subducted Solomon Sea plate, and associated crust of the Woodlark Basin and Australian plate subducted at the New Britain and San Cristobal trenches. Depth is in kilometres; the top surface of the slab is contoured at 20 km intervals from the Earth’s surface (black) to termination of slabrelated seismicity at approximately 550 km depth (light brown). Red line indicates the locations of the Ramu-Markham Fault (RMF)–New Britain trench (NBT)–San Cristobal trench (SCT); other major structures are removed for clarity; NB, New Britain; NI, New Ireland; SI, Solomon Islands; SS, Solomon Sea; TLTF, Tabar–Lihir–Tanga–Feni arc. See text for details.

  • Here are the forward models for the slab in the New Britain region from Holm and Richards, 2013. I include the figure caption below as a blockquote.

  • Forward tectonic reconstruction of progressive arc collision and accretion of New Britain to the Papua New Guinea margin. (a) Schematic forward reconstruction of New Britain relative to Papua New Guinea assuming continued northward motion of the Australian plate and clockwise rotation of the South Bismarck plate. (b) Cross-sections illustrate a conceptual interpretation of collision between New Britain and Papua New Guinea.

  • This map shows plate velocities and euler poles for different blocks. Note the counterclockwise motion of the plate that underlies the Solomon Sea (Baldwin et al., 2012). I include the figure caption below as a blockquote.

  • Tectonic maps of the New Guinea region. (a) Seismicity, volcanoes, and plate motion vectors. Plate motion vectors relative to the Australian plate are surface velocity models based on GPS data, fault slip rates, and earthquake focal mechanisms (UNAVCO, http://jules.unavco.org/Voyager/Earth). Earthquake data are sourced from the International Seismological Center EHB Bulletin (http://www.isc.ac.uk); data represent events from January 1994 through January 2009 with constrained focal depths. Background image is generated from http://www.geomapapp.org. Abbreviations: AB, Arafura Basin; AT, Aure Trough; AyT, Ayu Trough; BA, Banda arc; BSSL, Bismarck Sea seismic lineation; BH, Bird’s Head; BT, Banda Trench; BTFZ, Bewani-Torricelli fault zone; DD, Dayman Dome; DEI, D’Entrecasteaux Islands; FP, Fly Platform; GOP, Gulf of Papua; HP, Huon peninsula; LA, Louisiade Archipelago; LFZ, Lowlands fault zone; MaT, Manus Trench; ML, Mt. Lamington; MT, Mt. Trafalgar; MuT, Mussau Trough; MV, Mt. Victory; MTB, Mamberamo thrust belt; MVF, Managalase Plateau volcanic field; NBT, New Britain Trench; NBA, New Britain arc; NF, Nubara fault; NGT, New Guinea Trench; OJP, Ontong Java Plateau; OSF, Owen Stanley fault zone; PFTB, Papuan fold-and-thrust belt; PP, Papuan peninsula; PRi, Pocklington Rise; PT, Pocklington Trough; RMF, Ramu-Markham fault; SST, South Solomons Trench; SA, Solomon arc; SFZ, Sorong fault zone; ST, Seram Trench; TFZ, Tarera-Aiduna fault zone; TJ, AUS-WDKPAC triple junction; TL, Tasman line; TT, Trobriand Trough;WD, Weber Deep;WB, Woodlark Basin;WFTB, Western (Irian) fold-and-thrust belt; WR,Woodlark Rift; WRi, Woodlark Rise; WTB, Weyland thrust; YFZ, Yapen fault zone.White box indicates the location shown in Figure 3. (b) Map of plates, microplates, and tectonic blocks and elements of the New Guinea region. Tectonic elements modified after Hill & Hall (2003). Abbreviations: ADB, Adelbert block; AOB, April ultramafics; AUS, Australian plate; BHB, Bird’s Head block; CM, Cyclops Mountains; CWB, Cendrawasih block; CAR, Caroline microplate; EMD, Ertsberg Mining District; FA, Finisterre arc; IOB, Irian ophiolite belt; KBB, Kubor & Bena blocks (including Bena Bena terrane); LFTB, Lengguru fold-and-thrust belt; MA, Mapenduma anticline; MB, Mamberamo Basin block; MO, Marum ophiolite belt; MHS, Manus hotspot; NBS, North Bismarck plate; NGH, New Guinea highlands block; NNG, Northern New Guinea block; OKT, Ok Tedi mining district; PAC, Pacific plate; PIC, Porgera intrusive complex; PSP, Philippine Sea plate; PUB, Papuan Ultramafic Belt ophiolite; SB, Sepik Basin block; SDB, Sunda block; SBS, South Bismarck plate; SIB, Solomon Islands block; WP, Wandamen peninsula; WDK, Woodlark microplate; YQ, Yeleme quarries.

  • This figure incorporates cross sections and map views of various parts of the regional tectonics (Baldwin et al., 2012). The New Britain region is in the map near the A and B sections. I include the figure caption below as a blockquote.

  • Oblique block diagram of New Guinea from the northeast with schematic cross sections showing the present-day plate tectonic setting. Digital elevation model was generated from http://www.geomapapp.org. Oceanic crust in tectonic cross sections is shown by thick black-and-white hatched lines, with arrows indicating active subduction; thick gray-and-white hatched lines indicate uncertain former subduction. Continental crust, transitional continental crust, and arc-related crust are shown without pattern. Representative geologic cross sections across parts of slices C and D are marked with transparent red ovals and within slices B and E are shown by dotted lines. (i ) Cross section of the Papuan peninsula and D’Entrecasteaux Islands modified from Little et al. (2011), showing the obducted ophiolite belt due to collision of the Australian (AUS) plate with an arc in the Paleogene, with later Pliocene extension and exhumation to form the D’Entrecasteaux Islands. (ii ) Cross section of the Papuan peninsula after Davies & Jaques (1984) shows the Papuan ophiolite thrust over metamorphic rocks of AUS margin affinity. (iii ) Across the Papuan mainland, the cross section after Crowhurst et al. (1996) shows the obducted Marum ophiolite and complex folding and thrusting due to collision of the Melanesian arc (the Adelbert, Finisterre, and Huon blocks) in the Late Miocene to recent. (iv) Across the Bird’s Head, the cross section after Bailly et al. (2009) illustrates deformation in the Lengguru fold-and-thrust belt as a result of Late Miocene–Early Pliocene northeast-southwest shortening, followed by Late Pliocene–Quaternary extension. Abbreviations as in Figure 2, in addition to NI, New Ireland; SI, Solomon Islands; SS, Solomon Sea; (U)HP, (ultra)high-pressure.

Social Media

Geologic Fundamentals

  • For more on the graphical representation of moment tensors and focal mechnisms, check this IRIS video out:
  • Here is a fantastic infographic from Frisch et al. (2011). This figure shows some examples of earthquakes in different plate tectonic settings, and what their fault plane solutions are. There is a cross section showing these focal mechanisms for a thrust or reverse earthquake. The upper right corner includes my favorite figure of all time. This shows the first motion (up or down) for each of the four quadrants. This figure also shows how the amplitude of the seismic waves are greatest (generally) in the middle of the quadrant and decrease to zero at the nodal planes (the boundary of each quadrant).

  • There are three types of earthquakes, strike-slip, compressional (reverse or thrust, depending upon the dip of the fault), and extensional (normal). Here is are some animations of these three types of earthquake faults. The following three animations are from IRIS.
  • Strike Slip:

    Compressional:

    Extensional:

Earthquake Report: Gorda plate!

I was at a workshop to develop a unified strategy for research and monitoring in the Klamath River estuary (led by the Yurok Tribe, Andreas Krauss) yesterday and missed feeling the first of two M 4.6-4.7 earthquakes. I was presenting the results from our tectonic geodetic studies as they moderate Sea Level Rise at the mouth of the Klamath River (and control sedimentation there). However, I was home in Manila, CA when the second earthquake hit. I felt a sharp and short motion (1-2 seconds max in duration). But I was exhausted still from the death of my cat Chicken. So, I needed to wait until today to put this report together.
The Cascadia subduction zone (CSZ) is a convergent plate boundary fault formed by the interaction between the downgoing oceanic Gorda plate (GP) beneath the continental North America plate (NAP). More about the CSZ can be found here.
The first M 4.6 was a thrust earthquake within the Gorda plate. The CSZ megathrust fault slab depth is about 15 km at the location of these 2 earthquakes. The M 4.7 earthquake is a strike-slip earthquake. Because of the predominant northeast striking left-lateral faults in the GP, I interpret this earthquake to be left-lateral.
My initial thought was that these two EQs could be related. So, I rummaged the literature to find papers that present research of static coulomb stress changes between earthquakes and faults similar to what we had yesterday. When an earthquake fault slips during an earthquake, the crust deforms elastically. This causes some regions to extend and other regions to compress. These extension/compression changes cause static stresses on faults to change. As the seismic waves travel through the crust, this can cause dynamic changes in stress along faults. Both of these types of stress change (static and dynamic) are very small. If there is a fault that is oriented correctly, has a high stress state (almost ready to slip during an earthquake), and has a sufficiently large enough stress change, the first earthquake may trigger a second earthquake.
Because the second earthquake happened long after the main seismic waves had stopped traveling through the region, the M 4.7 earthquake could not have been dynamically triggered by the earlier M 4.6 earthquake. However, based on my review of the literature, it appears that the M 4.6 may have triggered the M 4.7 earthquake.

Below is my interpretive poster for this earthquake

I plot the seismicity from the past month, with color representing depth and diameter representing magnitude (see legend). I include earthquake epicenters from 1918-2018 with magnitudes M ≥ 4.5 (and down to M ≥ 4.5 in a second poster).
I plot the USGS fault plane solutions (moment tensors in blue and focal mechanisms in orange) for the M 4.6 & 4.7 earthquakes. I include generic fault plane solutions for the other fault systems in the region.
I include posters that show either M 4.6 or M 4.7 MMI and Did You Feel It data. I also have version that include emag2 magnetic anomaly data. These mag anomaly data nicely show the structure of the oceanic crust formed at the Gorda spreading center (the anomalies are initially parallel to the spreading center; that these anomalies are parallel to the spreading center was some key evidence for the plate tectonic hypothesis prior to it being accepted as a theory).

  • I placed a moment tensor / focal mechanism legend on the poster. There is more material from the USGS web sites about moment tensors and focal mechanisms (the beach ball symbols). Both moment tensors and focal mechanisms are solutions to seismologic data that reveal two possible interpretations for fault orientation and sense of motion. One must use other information, like the regional tectonics, to interpret which of the two possibilities is more likely.
  • I also include the shaking intensity contours on the map. These use the Modified Mercalli Intensity Scale (MMI; see the legend on the map). This is based upon a computer model estimate of ground motions, different from the “Did You Feel It?” estimate of ground motions that is actually based on real observations. The MMI is a qualitative measure of shaking intensity. More on the MMI scale can be found here and here. This is based upon a computer model estimate of ground motions, different from the “Did You Feel It?” estimate of ground motions that is actually based on real observations.
  • I include the slab contours plotted (McCrory et al., 2012), which are contours that represent the depth to the subduction zone fault. These are mostly based upon seismicity. The depths of the earthquakes have considerable error and do not all occur along the subduction zone faults, so these slab contours are simply the best estimate for the location of the fault.
  • I include some inset figures.

  • In the upper right corner is a map of the Cascadia subduction zone (CSZ) and regional tectonic plate boundary faults. This is modified from several sources (Chaytor et al., 2004; Nelson et al., 2004). I placed a blue stars in the general location of today’s earthquakes.
  • In the upper left corner is a map from Chaytor et al. (2004) that shows some details of the faulting in the region. This figure shows the predominant tectonic fabric in the GP (northeast striking left-lateral faults). More about this figure can be found below.
  • Below the Chaytor figure is an illustration modified from Plafker (1972). This figure shows how a subduction zone deforms between (interseismic) and during (coseismic) earthquakes. Today’s earthquake did not occur along the CSZ, so did not produce crustal deformation like this. However, it is useful to know this when studying the CSZ. Today’s earthquakes happened in the lower Gorda plate
  • In the lower left corner is a figure from Rollins and Stein (2010). In their paper they discuss how static coulomb stress changes from earthquakes may impart (or remove) stress from adjacent crust/faults. I place a blues star in the general location of today’s earthquakes.
  • To the left of the CSZ map is a figure from Yue et al. (2008) that shows the results of their static coulomb modeling. They model static changes in stress change from source earthquakes (strike-slip in upper panel and thrust faults in lower panel) imparted onto receiver faults. The lower left example (c) shows the stress change imparted following a thrust fault source earthquake imparted onto a left-lateral strike-slip receiver fault. If we rotate this panel counterclockwise (about 25°)to match the orientation of the M 4.6 earthquake, we may observe that the M 4.7 earthquake resides in the quadrant that saw an increase in static coulomb stress (colored red).
  • In the lower right corner is another example of static coulomb stress modeling from Lin et al. (2011). The left panel shows what static stress changes may be imparted from a source thrust fault onto left lateral strike-slip faults (“tear” faults are strike-slip faults that connect thrust faults). These left panels also show an increase in static coulomb stress in the lower left quadrant. I take these two examples as supporting evidence for my hypothesis that the M 4.6 earthquake triggered the M 4.7 earthquake.

M 4.6 MMI/DYFI


M 4.6 MMI/DYFI emag2


M 4.7 MMI/DYFI


M 4.7 MMI/DYFI emag2


USGS Earthquake Pages

  • Here is the Baby Benioff Seismograph from Humboldt State Univ. Dept. of Geology. See social media below.

UPDATE: 2018.03.23 22:10 local time

  • I later noticed that there was a M 4.5 earlier on 2018.03.09 south of these two M 4.6 and 4.7 earthquakes. I here prepare an overlay analysis of the seismicity with the Yue et al. (2008) results compared to these 3 earthquakes in a sequence. The below figure has two panels representing the hypothetical static coulomb stress changes between these three earthquakes. Earthquake order number is labeled in cyan.
  • I orient the Yue et al. (2008) figures relative to the primary nodal plane strike preferred USGS interpretation. In other words, I use the orientation of the USGS preferred fault plane solution to orient the Yue et al. (2008) coulomb stress change figures.
  • These overlays are scaled relative to the published scale.
  • Note how the largest magnitude (M 4.7) earthquake is in a region of increased static coulomb stress from both the prior earthquakes. These stress changes are very small and the magnitudes are probably not scaled appropriately for the space, so this is possibly a conjectural interpretation.
    1. The left panel shows what stress changes might happen on left-lateral strike-slip receiver faults given a left-lateral strike-slip source fault. The M 4.7 EQ is in the region of increased static coulomb stress.
    2. The right panel shows what stress changes might happen on left-lateral striek-slip receiver faults given a thrust fault source earthquake. The M 4.7 EQ is AGAIN in the region of increased static coulomb stress.


Some Relevant Discussion and Figures

  • Here is a map of the Cascadia subduction zone, modified from Nelson et al. (2006). The Juan de Fuca and Gorda plates subduct norteastwardly beneath the North America plate at rates ranging from 29- to 45-mm/yr. Sites where evidence of past earthquakes (paleoseismology) are denoted by white dots. Where there is also evidence for past CSZ tsunami, there are black dots. These paleoseismology sites are labeled (e.g. Humboldt Bay). Some submarine paleoseismology core sites are also shown as grey dots. The two main spreading ridges are not labeled, but the northern one is the Juan de Fuca ridge (where oceanic crust is formed for the Juan de Fuca plate) and the southern one is the Gorda rise (where the oceanic crust is formed for the Gorda plate).

  • Here is a version of the CSZ cross section alone (Plafker, 1972). This shows two parts of the earthquake cycle: the interseismic part (between earthquakes) and the coseismic part (during earthquakes). Regions that experience uplift during the interseismic period tend to experience subsidence during the coseismic period.

  • Here is a map from Chaytor et al. (2004) that shows some details of the faulting in the region. The moment tensor (at the moment i write this) shows a north-south striking fault with a reverse or thrust faulting mechanism. While this region of faulting is dominated by strike slip faults (and most all prior earthquake moment tensors showed strike slip earthquakes), when strike slip faults bend, they can create compression (transpression) and extension (transtension). This transpressive or transtentional deformation may produce thrust/reverse earthquakes or normal fault earthquakes, respectively. The transverse ranges north of Los Angeles are an example of uplift/transpression due to the bend in the San Andreas fault in that region.

  • These are the models for tectonic deformation within the Gorda plate as presented by Jason Chaytor in 2004.
  • Mw = 5 Trinidad Chaytor

  • Here is a map from Rollins and Stein, showing their interpretations of different historic earthquakes in the region. This was published in response to the Januray 2010 Gorda plate earthquake. The faults are from Chaytor et al. (2004).

  • In this map below, I label a number of other significant earthquakes in this Mendocino triple junction region. Another historic right-lateral earthquake on the Mendocino fault system was in 1994. There was a series of earthquakes possibly along the easternmost section of the Mendocino fault system in late January 2015, here is my post about that earthquake series.

The Gorda and Juan de Fuca plates subduct beneath the North America plate to form the Cascadia subduction zone fault system. In 1992 there was a swarm of earthquakes with the magnitude Mw 7.2 Mainshock on 4/25. Initially this earthquake was interpreted to have been on the Cascadia subduction zone (CSZ). The moment tensor shows a compressional mechanism. However the two largest aftershocks on 4/26/1992 (Mw 6.5 and Mw 6.7), had strike-slip moment tensors. These two aftershocks align on what may be the eastern extension of the Mendocino fault.
There have been several series of intra-plate earthquakes in the Gorda plate. Two main shocks that I plot of this type of earthquake are the 1980 (Mw 7.2) and 2005 (Mw 7.2) earthquakes. I place orange lines approximately where the faults are that ruptured in 1980 and 2005. These are also plotted in the Rollins and Stein (2010) figure above. The Gorda plate is being deformed due to compression between the Pacific plate to the south and the Juan de Fuca plate to the north. Due to this north-south compression, the plate is deforming internally so that normal faults that formed at the spreading center (the Gorda Rise) are reactivated as left-lateral strike-slip faults. In 2014, there was another swarm of left-lateral earthquakes in the Gorda plate. I posted some material about the Gorda plate setting on this page.

  • Here is the Yue et al. (2008) figure, along with their figure caption below.

  • Coulomb stress change for different combination of faults. The thick while line marks the source fault, and the white arrows indicate the focal mechanism. The black line and the black arrows represent the orientation of the receiving fault and its mechanism, respectively.

  • Here is the figure from Lin et al. (2011), along with their figure caption.

  • Maps showing Coulomb stress changes caused by an M = 7.0 earthquake on adjacent tear faults. The source is the same as in Figure 4. Coulomb stresses are calculated on (a–c) left‐lateral and (e–g) right‐lateral tear faults. Stress is sampled at depth of 1 km (Figures 6a and 6e), 10 km (Figures 6b and 6f), and 19.5 km (Figures 6c and 6g). (d) Cross section at the right end of the source earthquake (cross section position shown in Figure 6a). Note that left‐lateral tear faulting is favored in one position with respect to the thrust, while right‐lateral faulting is favored in the opposite position.

Social Media


Geologic Fundamentals

  • For more on the graphical representation of moment tensors and focal mechnisms, check this IRIS video out:
  • Here is a fantastic infographic from Frisch et al. (2011). This figure shows some examples of earthquakes in different plate tectonic settings, and what their fault plane solutions are. There is a cross section showing these focal mechanisms for a thrust or reverse earthquake. The upper right corner includes my favorite figure of all time. This shows the first motion (up or down) for each of the four quadrants. This figure also shows how the amplitude of the seismic waves are greatest (generally) in the middle of the quadrant and decrease to zero at the nodal planes (the boundary of each quadrant).

  • There are three types of earthquakes, strike-slip, compressional (reverse or thrust, depending upon the dip of the fault), and extensional (normal). Here is are some animations of these three types of earthquake faults. The following three animations are from IRIS.
  • Strike Slip:

    Compressional:

    Extensional:

    References:

  • Atwater, B.F., Musumi-Rokkaku, S., Satake, K., Tsuju, Y., Eueda, K., and Yamaguchi, D.K., 2005. The Orphan Tsunami of 1700—Japanese Clues to a Parent Earthquake in North America, USGS Professional Paper 1707, USGS, Reston, VA, 144 pp.
  • Chaytor, J.D., Goldfinger, C., Dziak, R.P., and Fox, C.G., 2004. Active deformation of the Gorda plate: Constraining deformation models with new geophysical data: Geology v. 32, p. 353-356.
  • Dengler, L.A., Moley, K.M., McPherson, R.C., Pasyanos, M., Dewey, J.W., and Murray, M., 1995. The September 1, 1994 Mendocino Fault Earthquake, California Geology, Marc/April 1995, p. 43-53.
  • Frisch, W., Meschede, M., Blakey, R., 2011. Plate Tectonics, Springer-Verlag, London, 213 pp.
  • Geist, E.L. and Andrews D.J., 2000. Slip rates on San Francisco Bay area faults from anelastic deformation of the continental lithosphere, Journal of Geophysical Research, v. 105, no. B11, p. 25,543-25,552.
  • Irwin, W.P., 1990. Quaternary deformation, in Wallace, R.E. (ed.), 1990, The San Andreas Fault system, California: U.S. Geological Survey Professional Paper 1515, online at: http://pubs.usgs.gov/pp/1990/1515/
  • Lin, J., R. S. Stein, M. Meghraoui, S. Toda, A. Ayadi, C. Dorbath, and S. Belabbes (2011), Stress transfer among en echelon and opposing thrusts and tear faults: Triggering caused by the 2003 Mw = 6.9 Zemmouri, Algeria, earthquake, J. Geophys. Res., 116, B03305, doi:10.1029/2010JB007654.
  • McCrory, P.A.,. Blair, J.L., Waldhauser, F., kand Oppenheimer, D.H., 2012. Juan de Fuca slab geometry and its relation to Wadati-Benioff zone seismicity in JGR, v. 117, B09306, doi:10.1029/2012JB009407.
  • McLaughlin, R.J., Sarna-Wojcicki, A.M., Wagner, D.L., Fleck, R.J., Langenheim, V.E., Jachens, R.C., Clahan, K., and Allen, J.R., 2012. Evolution of the Rodgers Creek–Maacama right-lateral fault system and associated basins east of the northward-migrating Mendocino Triple Junction, northern California in Geosphere, v. 8, no. 2., p. 342-373.
  • Nelson, A.R., Asquith, A.C., and Grant, W.C., 2004. Great Earthquakes and Tsunamis of the Past 2000 Years at the Salmon River Estuary, Central Oregon Coast, USA: Bulletin of the Seismological Society of America, Vol. 94, No. 4, pp. 1276–1292
  • Rollins, J.C. and Stein, R.S., 2010. Coulomb stress interactions among M ≥ 5.9 earthquakes in the Gorda deformation zone and on the Mendocino Fault Zone, Cascadia subduction zone, and northern San Andreas Fault: Journal of Geophysical Research, v. 115, B12306, doi:10.1029/2009JB007117, 2010.
  • Stoffer, P.W., 2006, Where’s the San Andreas Fault? A guidebook to tracing the fault on public lands in the San Francisco Bay region: U.S. Geological Survey General Interest Publication 16, 123 p., online at http://pubs.usgs.gov/gip/2006/16/
  • Yue, H., Zhang, Z., Chen, Y.J., 2008. Interaction between adjacent left-lateral strike-slip faults and thrust faults: the 1976 Songpan earthquake sequence in Chinese Science Bulletin, v. 53, no. 16, p. 2520-2526
  • Wallace, Robert E., ed., 1990, The San Andreas fault system, California: U.S. Geological Survey Professional Paper 1515, 283 p. [http://pubs.usgs.gov/pp/1988/1434/].

Earthquake Report: Malawi & Mozambique

Busy day today. This is my second earthquake report today.
This report is about a M 5.6 earthquake along the Malawi Rift (MR) system, part of the larger East Africa Rift (EAR) extensional plate boundary. The EAR is currently the locus of extension between the Nubia and Somalia plates. The orientation of extension in this region has changed over time (for more on this, see Castaing, 1991). There are many normal faults that accommodate this extension (forming the rift valleys where so much paleoanthopologic evidence has been archived by rift volcanic deposits, and later exposed due to the extension). As the faults change strike (compass orientation), the type of faulting also changes (there are lots of strike-slip faults that have formed to accommodate the mismatch between fault strike and extension direction).
Topday’s M 5.6 earthquake is extensional, showing extension in the northeast-southwest direction. At first, we might think that this is strange, since the predominant direction of extension is east-west. However, upon further investigation, we learn that the normal faults in the region of today’s earthquake have northwest strike (they are oriented northwest-southeast). So, northeast extension makes sense here.
There have been a number of earthquakes along the EAR and I include these in the poster. Links to the USGS websites are listed below.

Below is my interpretive poster for this earthquake

I plot the seismicity from the past month, with color representing depth and diameter representing magnitude (see legend). I include USGS earthquake epicenters from 1918-2018 with magnitudes M ≥ 5.5.
I plot the USGS fault plane solutions (moment tensors in blue and focal mechanisms in orange) for the M 5.6 earthquakes, in addition to some relevant historic earthquakes.
I include the magnetic anomaly data (emag 2).

  • I placed a moment tensor / focal mechanism legend on the poster. There is more material from the USGS web sites about moment tensors and focal mechanisms (the beach ball symbols). Both moment tensors and focal mechanisms are solutions to seismologic data that reveal two possible interpretations for fault orientation and sense of motion. One must use other information, like the regional tectonics, to interpret which of the two possibilities is more likely.
  • I also include the shaking intensity contours on the map. These use the Modified Mercalli Intensity Scale (MMI; see the legend on the map). This is based upon a computer model estimate of ground motions, different from the “Did You Feel It?” estimate of ground motions that is actually based on real observations. The MMI is a qualitative measure of shaking intensity. More on the MMI scale can be found here and here. This is based upon a computer model estimate of ground motions, different from the “Did You Feel It?” estimate of ground motions that is actually based on real observations.
  • I include some inset figures.

  • In the upper left corner is a map from Stamps et al. (2018) that shows the relative plate motion across the plate boundaries. The length of these vectors represents relative velocity between the plate systems (designated by color). The EAR has been propagating to the south, and the GPS rates reflect this (faster in then north and slower in the south). I place a blue star in the general location of today’s earthquake (as in other inset maps).
  • In the upper right corner is a map from Hayes et al. (2014) that shows the heightened seismic hazard associated with the EAR.
  • To the left of the seismic hazard map is a map showing faults colored relative to when they formed. This also shows how the EAR is propagating to the south.
  • In the lower right corner is a graphic that illustrates how Castaing (1991) has interpreted the tectonic strain to have evolved through time. Note the lower right panel as this represents the Cenozoic to Recent tectonic setting.


USGS Earthquake Pages

    These are from this current sequence

  • 2018.03.08 M 5.6 Malawi

Some Relevant Discussion and Figures

  • Here is the Stamps et al. (2018) figure. These authors describe their efforts to create the “Sub-Saharan Africa Geodetic Strain Rate Model v.1.0 (SSA-GSRM v.1.0).” They used GPS data to estimate strain rates for the EAR system.

  • Tectonic setting of Africa and the East African Rift System. OR = Okavangu Rift, LR = Luangua Rift, MR = Mweru Rift, EB = Eastern Branch, KP = Kivu Volcanic Province, CVL = Cameroon Volcanic Line. Earthquakes >M4 from the International Seismological Catalog29 are shown in different colors as well as relative plate motions from Saria et al.3, which are used to constrain long-term tectonic rigid plate motions. Figure was created by DSS using the open source software Generic Mapping Tools v5.2.1 supported by the National Science Foundation.

  • This map shows their interpretation of how much of the EAR is experiencing either extension or compression and their comparison with the GSRM existing model. The Stamps et al. (2018) model is on the left. The upper panel shows how their new model is sensitive to additional strain not observed in the GSRM model. The lower panel shows extension in warm colors and compression in cool colors.

  • Geodetic strain rate second invariant and dilatation and comparison with GSRM v.2.1. (A) The second invariant of strain rate for the new long-term tectonic deformation model indicating magnitude. (B) Residual strain rate magnitudes relative to GSRM v2.1. (C) Dilatation indicating the dominantly compressional and extensional regimes. Tensor orientations are overlaid. Red = extension and black = compression. (C,D) Same as (C), but for residual strain rate tensors and dilatation.

  • Here is the Hayes et al. (2014) seismic hazard map.

  • Here is the Castaing (1991) figure that shows how the tectonics of the EAR has changed through time.

  • Stereograms showing successive stress fields in South Malawi

  • This map shows some of the fault mapping in the region of todays earthquake (Castaing, 1991). Today’s earthquake happened due south of Lake Chilwa, possibly associated with the Cholo fault (tho they do not map the Cholo fault to the location of the USGS epicenter).

  • Reactivation of the Shire Valley area by the Recent East African Rift System (modified after Habgood, 1963; Pinna et al., 1987). I = Malawi-Mozambique border; 2 = ante-Cenozoic formations; S = Cenozoic to Recent deposits; 4 = dextral strike-slip faults; 5 = normal faults; 6 = strike-slip fault with normal component.

  • This map shows the more recent faulting in the region (Castaing, 1991).

  • Recent East African Rift System {modified after Chorowicz, 1989; Chorowicz and Mukonki. 1980; Chorowicz et al., 1983, 1987; Daly et al., 1989; Ebinger et al., 1987; Katz, 1987; Kazrnin, 1980; McConnel, 1972; Rach and Rosendahl, 1989; Rosendahl, 1987; Villeneuve, 1983; Wheeler and Karson, 1989). I = Rift boundary normal faults; 2 = pre-transform faults; = Cenozoic and Recent volcanics; 4 = Cenozoic granites; 5 = direction of extension (a = Lengwe and Mwabvi basins-present study and focal mechanism solution of 6 May 1966 earthquake from Shudofsky (1985), b-h = microtectonic observations between Lake Edward and Lake Malawi from Chorowicz (1989) and Chorowicz and Mukonki (1980)); 6 = general extension.

  • Regions of extension (Saemundsson, 2010). I include the original figure captions below them as blockquotes.

  • The Afro-Arabian rift system (continental graben and depressions are shaded) (From: Baker et al., 1972)

  • Fault segments along the EAR, Chorowicz (2005).

  • Hypsographic DEM of the East African rift system. Black lines: main faults; E–W dotted lines: locations of cross-sections of Fig. 3; white surfaces: lakes; grey levels from dark (low elevations) to light (high elevations). The East African rift system is a series of several thousand kilometers long aligned successions of adjacent individual tectonic basins (rift valleys), separated from each other by relative shoals and generally bordered by uplifted shoulders. It can be regarded as an intra-continental ridge system comprising an axial rift.

  • Faults characterized vs. their major sense of motion, Chorowicz (2005).

  • Western branch and part of eastern branch of the East African rift system, on shadowed DEM.

  • Regional tectonic strain, Chorowicz (2005).

  • On-going individualization of the Somalian plate in Eastern Africa. Asthenospheric intrusions (black polygons) show already open lithosphere. White arrows show direction of relative divergent movement.

  • This is an illustration showing how the extension in this region may be accommodated by dextral (right-lateral) strike-slip faults, Chorowicz (2005).

  • Fault and fold zone of the Tanganyika–Rukwa–Malawi segment of the EARS. Folds are developed in stripes between left-stepping en echelon dextral strike-slip faults. This pattern of folds explains why some segment border areas of the Tanganyika rift form low plains instead of the usual high shoulders.

  • Here is the USGS “Seismicity of the Earth” poster for this region (Hayes et al., 2014).

  • This is the latest geologic maps of Africa (Thieblemont, D., 2016). Click on the map for a 67 MB pdf version.

Geologic Fundamentals

  • For more on the graphical representation of moment tensors and focal mechnisms, check this IRIS video out:
  • Here is a fantastic infographic from Frisch et al. (2011). This figure shows some examples of earthquakes in different plate tectonic settings, and what their fault plane solutions are. There is a cross section showing these focal mechanisms for a thrust or reverse earthquake. The upper right corner includes my favorite figure of all time. This shows the first motion (up or down) for each of the four quadrants. This figure also shows how the amplitude of the seismic waves are greatest (generally) in the middle of the quadrant and decrease to zero at the nodal planes (the boundary of each quadrant).

  • There are three types of earthquakes, strike-slip, compressional (reverse or thrust, depending upon the dip of the fault), and extensional (normal). Here is are some animations of these three types of earthquake faults. The following three animations are from IRIS.
  • Strike Slip:

    Compressional:

    Extensional:

Social Media

    References:

  • Baker, B.H., Mohr P.A., and Williams, L.A.J., 1972: Geology of the Eastern Rift System of Africa in The Geol. Soc. of America. Special Paper, 136, 67 pp.
  • Castaing, C., 1991. lost-Pan-African tectonic evolution of South Malawi in relation to the Karroo and Recent East African Rift Systems in Tectonophysics, v. 191, p. 55-73
  • Chorowicz, J., 2005. The East African rift system in Journal of African Earth Sciences, v. 43., p. 379-410.
  • Hayes, G.P., Jones, E.S., Stadler, T.J., Barnhart, W.D., McNamara, D.E., Benz, H.M., Furlong, K.P., and Villaseñor, Antonio, 2014. Seismicity of the Earth 1900–2013 East African Rift: U.S. Geological Survey Open-File Report 2010–1083-P, 1 sheet, scale 1:8,500,000 http://dx.doi.org/10.3133/of20101083P
  • Leseane, K., Atekwana, E.A., Mickus, K.L., Abdelsalam, M.G., Shemanq, E.M., and Atekwana, E.A., 2015. Thermal perturbations beneath the incipient Okavango Rift Zone, northwest Botswana in JGR: Solid Earth, v. 120, doi:10.1002/2014JB011029.
  • Saemundsson, K., 2010. East African Rift System – an Overview presented at Short Course V on Exploration for Geothermal Resources, organized by UNU-GTP, GDC and KenGen, at Lake Bogoria and Lake Naivasha, Kenya, Oct. 29 – Nov. 19, 2010, 10 pp.
  • Stamps, D.S., Saria, E., and Kreemer, C., 2018. A Geodetic Strain Rate Model for the East African Rift System in Scientific Reports, v. 8, DOI:10.1038/s41598-017-19097-w
  • Thieblemont, D. (ed.), 2016. Geological Map of Africa et 1:10M scale, CGMW-BRGM 2016

Earthquake Report: New Ireland!

We had an M 6.8 earthquake near a transform micro-plate boundary fault system north of New Ireland, Papua New Guinea today. Here is the USGS website for this earthquake.
The main transform fault (Weitin fault) is ~40 km to the west of the USGS epicenter. There was a very similar earthquake on 1982.08.12 (USGS website).
This earthquake is unrelated to the sequence occurring on the island of New Guinea.
Something that I rediscovered is that there were two M 8 earthquakes in 1971 in this region. This testifies that it is possible to have a Great earthquake (M ≥ 8) close in space and time relative to another Great earthquake. These earthquakes do not have USGS fault plane solutions, but I suspect that these are subduction zone earthquakes (based upon their depth).
This transform system is capable of producing Great earthquakes too, as evidenced by the 2000.11.16 M 8.0 earthquake (USGS website). This is another example of two Great earthquakes (or almost 2 Great earthquakes, as the M 7.8 is not quite a Great earthquake) are related. It appears that the M 8.0 earthquake may have triggered teh M 7.8 earthquake about 3 months later (however at first glance, it seemed to me like the strike-slip earthquake might not increase the static coulomb stress on the subduction zone, but I have not spent more than half a minute thinking about this).

Here are the USGS websites for the earthquakes discussed here.

https://earthquake.usgs.gov/earthquakes/eventpage/usp000a3sp#executive

Below is my interpretive poster for this earthquake

I plot the seismicity from the past month, with color representing depth and diameter representing magnitude (see legend). I include earthquake epicenters from 1918-2018 with magnitudes M ≥ 6.5 (in a second poster). I also prepared these two posters with emag2 magnetic anomaly data (the file sizes are larger for these emag2 posters).
I plot the USGS fault plane solutions (moment tensors in blue and focal mechanisms in orange) for the M 6.8 earthquake, in addition to some relevant historic earthquakes.

  • I placed a moment tensor / focal mechanism legend on the poster. There is more material from the USGS web sites about moment tensors and focal mechanisms (the beach ball symbols). Both moment tensors and focal mechanisms are solutions to seismologic data that reveal two possible interpretations for fault orientation and sense of motion. One must use other information, like the regional tectonics, to interpret which of the two possibilities is more likely.
  • I also include the shaking intensity intensity on the map (shows where there is land). These use the Modified Mercalli Intensity Scale (MMI; see the legend on the map). This is based upon a computer model estimate of ground motions, different from the “Did You Feel It?” estimate of ground motions that is actually based on real observations. The MMI is a qualitative measure of shaking intensity. More on the MMI scale can be found here and here. This is based upon a computer model estimate of ground motions, different from the “Did You Feel It?” estimate of ground motions that is actually based on real observations.
  • I include the slab contours plotted (Hayes et al., 2012), which are contours that represent the depth to the subduction zone fault. These are mostly based upon seismicity. The depths of the earthquakes have considerable error and do not all occur along the subduction zone faults, so these slab contours are simply the best estimate for the location of the fault.
  • I include some inset figures.

  • In the top right of the poster are two figures from Oregon State University, which are based upon Hamilton (1979). “Tectonic microplates of the Melanesian region. Arrows show net plate motion relative to the Australian Plate.” To the right of the map is a cross section showing how the Solomon Sea plate is subducting beneath New Britain. This is from Johnson, 1976 I place a blue star in the general location of the earthquake in these inset figures.
  • In the upper left corner is another generalized tectonic map of the region from Holm et al., 2015.
  • In the lower left corner is a map from Müller et al. (2001) that shows details of the faulting in the Manus and New Ireland basins.

Main Interpretive Poster


Main Interpretive Poster with emag2


Earthquakes M≥ 6.5


Earthquakes M≥ 6.5 with emag2


Some Relevant Discussion and Figures

  • This is a map showing the seismicity of this region since 2000 A.D.

  • Earlier, I discussed seismicity from 2000-2015 here. The seismicity on the west of this region appears aligned with north-south shortening along the New Britain trench, while seismicity on the east of this region appears aligned with more east-west shortening. Here is a map that I put together where I show these two tectonic domains with the seismicity from this time period (today’s earthquakes are not plotted on this map, but one may see where they might plot).

  • Here is the generalized tectonic map of the region from Holm et al., 2015. I include the figure caption below as a blockquote.

  • Tectonic setting and mineral deposits of eastern Papua New Guinea and Solomon Islands. The modern arc setting related to formation of the mineral deposits comprises, from west to east, the West Bismarck arc, the New Britain arc, the Tabar-Lihir-Tanga-Feni Chain and the Solomon arc, associated with north-dipping subduction/underthrusting at the Ramu-Markham fault zone, New Britain trench and San Cristobal trench respectively. Arrows denote plate motion direction of the Australian and Pacific plates. Filled triangles denote active subduction. Outlined triangles denote slow or extinct subduction. NBP: North Bismarck plate; SBP: South Bismarck plate; AT: Adelbert Terrane; FT: Finisterre Terrane; RMF: Ramu-Markham fault zone; NBT: New Britain trench.

  • Here is the slab interpretation for the New Britain region from Holm and Richards, 2013. I include the figure caption below as a blockquote.

  • 3-D model of the Solomon slab comprising the subducted Solomon Sea plate, and associated crust of the Woodlark Basin and Australian plate subducted at the New Britain and San Cristobal trenches. Depth is in kilometres; the top surface of the slab is contoured at 20 km intervals from the Earth’s surface (black) to termination of slabrelated seismicity at approximately 550 km depth (light brown). Red line indicates the locations of the Ramu-Markham Fault (RMF)–New Britain trench (NBT)–San Cristobal trench (SCT); other major structures are removed for clarity; NB, New Britain; NI, New Ireland; SI, Solomon Islands; SS, Solomon Sea; TLTF, Tabar–Lihir–Tanga–Feni arc. See text for details.

  • Here are the forward models for the slab in the New Britain region from Holm and Richards, 2013. I include the figure caption below as a blockquote.

  • Forward tectonic reconstruction of progressive arc collision and accretion of New Britain to the Papua New Guinea margin. (a) Schematic forward reconstruction of New Britain relative to Papua New Guinea assuming continued northward motion of the Australian plate and clockwise rotation of the South Bismarck plate. (b) Cross-sections illustrate a conceptual interpretation of collision between New Britain and Papua New Guinea.

  • This map shows plate velocities and euler poles for different blocks. Note the counterclockwise motion of the plate that underlies the Solomon Sea (Baldwin et al., 2012). I include the figure caption below as a blockquote.

  • Tectonic maps of the New Guinea region. (a) Seismicity, volcanoes, and plate motion vectors. Plate motion vectors relative to the Australian plate are surface velocity models based on GPS data, fault slip rates, and earthquake focal mechanisms (UNAVCO, http://jules.unavco.org/Voyager/Earth). Earthquake data are sourced from the International Seismological Center EHB Bulletin (http://www.isc.ac.uk); data represent events from January 1994 through January 2009 with constrained focal depths. Background image is generated from http://www.geomapapp.org. Abbreviations: AB, Arafura Basin; AT, Aure Trough; AyT, Ayu Trough; BA, Banda arc; BSSL, Bismarck Sea seismic lineation; BH, Bird’s Head; BT, Banda Trench; BTFZ, Bewani-Torricelli fault zone; DD, Dayman Dome; DEI, D’Entrecasteaux Islands; FP, Fly Platform; GOP, Gulf of Papua; HP, Huon peninsula; LA, Louisiade Archipelago; LFZ, Lowlands fault zone; MaT, Manus Trench; ML, Mt. Lamington; MT, Mt. Trafalgar; MuT, Mussau Trough; MV, Mt. Victory; MTB, Mamberamo thrust belt; MVF, Managalase Plateau volcanic field; NBT, New Britain Trench; NBA, New Britain arc; NF, Nubara fault; NGT, New Guinea Trench; OJP, Ontong Java Plateau; OSF, Owen Stanley fault zone; PFTB, Papuan fold-and-thrust belt; PP, Papuan peninsula; PRi, Pocklington Rise; PT, Pocklington Trough; RMF, Ramu-Markham fault; SST, South Solomons Trench; SA, Solomon arc; SFZ, Sorong fault zone; ST, Seram Trench; TFZ, Tarera-Aiduna fault zone; TJ, AUS-WDKPAC triple junction; TL, Tasman line; TT, Trobriand Trough;WD, Weber Deep;WB, Woodlark Basin;WFTB, Western (Irian) fold-and-thrust belt; WR,Woodlark Rift; WRi, Woodlark Rise; WTB, Weyland thrust; YFZ, Yapen fault zone.White box indicates the location shown in Figure 3. (b) Map of plates, microplates, and tectonic blocks and elements of the New Guinea region. Tectonic elements modified after Hill & Hall (2003). Abbreviations: ADB, Adelbert block; AOB, April ultramafics; AUS, Australian plate; BHB, Bird’s Head block; CM, Cyclops Mountains; CWB, Cendrawasih block; CAR, Caroline microplate; EMD, Ertsberg Mining District; FA, Finisterre arc; IOB, Irian ophiolite belt; KBB, Kubor & Bena blocks (including Bena Bena terrane); LFTB, Lengguru fold-and-thrust belt; MA, Mapenduma anticline; MB, Mamberamo Basin block; MO, Marum ophiolite belt; MHS, Manus hotspot; NBS, North Bismarck plate; NGH, New Guinea highlands block; NNG, Northern New Guinea block; OKT, Ok Tedi mining district; PAC, Pacific plate; PIC, Porgera intrusive complex; PSP, Philippine Sea plate; PUB, Papuan Ultramafic Belt ophiolite; SB, Sepik Basin block; SDB, Sunda block; SBS, South Bismarck plate; SIB, Solomon Islands block; WP, Wandamen peninsula; WDK, Woodlark microplate; YQ, Yeleme quarries.

  • This figure incorporates cross sections and map views of various parts of the regional tectonics (Baldwin et al., 2012). The New Britain region is in the map near the A and B sections. I include the figure caption below as a blockquote.

  • Oblique block diagram of New Guinea from the northeast with schematic cross sections showing the present-day plate tectonic setting. Digital elevation model was generated from http://www.geomapapp.org. Oceanic crust in tectonic cross sections is shown by thick black-and-white hatched lines, with arrows indicating active subduction; thick gray-and-white hatched lines indicate uncertain former subduction. Continental crust, transitional continental crust, and arc-related crust are shown without pattern. Representative geologic cross sections across parts of slices C and D are marked with transparent red ovals and within slices B and E are shown by dotted lines. (i ) Cross section of the Papuan peninsula and D’Entrecasteaux Islands modified from Little et al. (2011), showing the obducted ophiolite belt due to collision of the Australian (AUS) plate with an arc in the Paleogene, with later Pliocene extension and exhumation to form the D’Entrecasteaux Islands. (ii ) Cross section of the Papuan peninsula after Davies & Jaques (1984) shows the Papuan ophiolite thrust over metamorphic rocks of AUS margin affinity. (iii ) Across the Papuan mainland, the cross section after Crowhurst et al. (1996) shows the obducted Marum ophiolite and complex folding and thrusting due to collision of the Melanesian arc (the Adelbert, Finisterre, and Huon blocks) in the Late Miocene to recent. (iv) Across the Bird’s Head, the cross section after Bailly et al. (2009) illustrates deformation in the Lengguru fold-and-thrust belt as a result of Late Miocene–Early Pliocene northeast-southwest shortening, followed by Late Pliocene–Quaternary extension. Abbreviations as in Figure 2, in addition to NI, New Ireland; SI, Solomon Islands; SS, Solomon Sea; (U)HP, (ultra)high-pressure.

Geologic Fundamentals

  • For more on the graphical representation of moment tensors and focal mechnisms, check this IRIS video out:
  • Here is a fantastic infographic from Frisch et al. (2011). This figure shows some examples of earthquakes in different plate tectonic settings, and what their fault plane solutions are. There is a cross section showing these focal mechanisms for a thrust or reverse earthquake. The upper right corner includes my favorite figure of all time. This shows the first motion (up or down) for each of the four quadrants. This figure also shows how the amplitude of the seismic waves are greatest (generally) in the middle of the quadrant and decrease to zero at the nodal planes (the boundary of each quadrant).

  • There are three types of earthquakes, strike-slip, compressional (reverse or thrust, depending upon the dip of the fault), and extensional (normal). Here is are some animations of these three types of earthquake faults. The following three animations are from IRIS.
  • Strike Slip:

    Compressional:

    Extensional:

Social Media

    References:

  • Baldwin, S.L., Monteleone, B.D., Webb, L.E., Fitzgerald, P.G., Grove, M., and Hill, E.J., 2004. Pliocene eclogite exhumation at plate tectonic rates in eastern Papua New Guinea in Nature, v. 431, p/ 263-267, doi:10.1038/nature02846.
  • Baldwin, S.L., Fitzgerald, P.G., and Webb, L.E., 2012. Tectonics of the New Guinea Region, Annu. Rev. Earth Planet. Sci., v. 40, pp. 495-520.
  • Cloos, M., Sapiie, B., Quarles van Ufford, A., Weiland, R.J., Warren, P.Q., and McMahon, T.P., 2005, Collisional delamination in New Guinea: The geotectonics of subducting slab breakoff: Geological Society of America Special Paper 400, 51 p., doi: 10.1130/2005.2400.
  • Hamilton, W.B., 1979. Tectonics of the Indonesian Region, USGS Professional Paper 1078.
  • Hayes, G. P., D. J. Wald, and R. L. Johnson (2012), Slab1.0: A three-dimensional model of global subduction zone geometries, J. Geophys. Res., 117, B01302, doi:10.1029/2011JB008524.
  • Holm, R. and Richards, S.W., 2013. A re-evaluation of arc-continent collision and along-arc variation in the Bismarck Sea region, Papua New Guinea in Australian Journal of Earth Sciences, v. 60, p. 605-619.
  • Holm, R.J., Richards, S.W., Rosenbaum, G., and Spandler, C., 2015. Disparate Tectonic Settings for Mineralisation in an Active Arc, Eastern Papua New Guinea and the Solomon Islands in proceedings from PACRIM 2015 Congress, Hong Kong ,18-21 March, 2015, pp. 7.
  • Holm, R.J., Rosenbaum, G., Richards, S.W., 2016. Post 8 Ma reconstruction of Papua New Guinea and Solomon Islands: Microplate tectonics in a convergent plate boundary setting in Eartth Science Reviews, v. 156, p. 66-81.
  • Johnson, R.W., 1976, Late Cainozoic volcanism and plate tectonics at the southern margin of the Bismarck Sea, Papua New Guinea, in Johnson, R.W., ed., 1976, Volcanism in Australia: Amsterdam, Elsevier, p. 101-116
  • Koulali, A., tregoning, P., McClusky, S., Stanaway, R., Wallace, L., and Lister, G., 2015. New Insights into the present-day kinematics of the central and western Papua New Guinea from GPS in GJI, v. 202, p. 993-1004, doi: 10.1093/gji/ggv200
  • Müller, D., Franz, L., Herzig, P.M., and Hunt, S., 2001. Potassic igneous rocks from the vicinity of epithermal gold mineralization, Lihir Island, Papua New Guinea in Lithos, v. 57, p. 163-186
  • Sapiie, B., and Cloos, M., 2004. Strike-slip faulting in the core of the Central Range of west New Guinea: Ertsberg Mining District, Indonesia in GSA Bulletin, v. 116; no. 3/4; p. 277–293
  • Tregoning, P., McQueen, H., Lambeck, K., Jackson, R. Little, T., Saunders, S., and Rosa, R., 2000. Present-day crustal motion in Papua New Guinea, Earth Planets and Space, v. 52, pp. 727-730.
  • Wells, D., l., and Coppersmith, K.J., 1994. New Empirical Relationships among Magnitude, Rupture Length, Rupture Width, Rupture Area, and Surface Displacement in BSSA, vol. 84, no. 4, pp. 974-1002