#EarthquakeReport Mariana Trench!

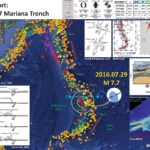
Earlier this year, there was an intermediate depth earthquake along the Mariana Trench with a magnitude of M 7.7. I was traveling and did not have the opportunity to prepare a report at the time. While getting together my annual summary I noticed this omission and prepared this report to compliment the remaining reports. Here is the USGS website for this earthquake. Intermediate depth earthquakes happen at hypocentral depths between 70 and 300 km and represent deformation within the downgoing lithosphere. The earthquake has an hypocentral depth of almost 200 km, so is unlikely to generate major ground motions at the surface (see the #EarthquakeReport interpretive poster below). After publishing (on 2016.12.28), I will change the publication date to 2016.07.29.

Below is my interpretive poster for this earthquake.

I plot the seismicity from the past year, with color representing depth and diameter representing magnitude (see legend). I also include a blue line (labeled E-E’) that aligns with the cross section shown on one of the inset figures below.

  • I placed a moment tensor / focal mechanism legend on the poster. There is more material from the USGS web sites about moment tensors and focal mechanisms (the beach ball symbols). Both moment tensors and focal mechanisms are solutions to seismologic data that reveal two possible interpretations for fault orientation and sense of motion. One must use other information, like the regional tectonics, to interpret which of the two possibilities is more likely. The moment tensor shows northeast-southwest compression, perpendicular to the convergence at this plate boundary. Most of the recent seismicity in this region is associated with convergence along the New Britain trench or the South Solomon trench.
  • I also include the shaking intensity contours on the map. These use the Modified Mercalli Intensity Scale (MMI; see the legend on the map). This is based upon a computer model estimate of ground motions, different from the “Did You Feel It?” estimate of ground motions that is actually based on real observations. The MMI is a qualitative measure of shaking intensity. More on the MMI scale can be found here and here. This is based upon a computer model estimate of ground motions, different from the “Did You Feel It?” estimate of ground motions that is actually based on real observations.
  • I did not include the slab contours (Hayes et al., 2012), which are contours that represent the depth to the subduction zone fault. These are mostly based upon seismicity. The depths of the earthquakes have considerable error and do not all occur along the subduction zone faults, so these slab contours are simply the best estimate for the location of the fault. The hypocentral depth plots this close to the location of the fault as mapped by Hayes et al. (2012). These slab contours would have been difficult to see in the second map below, so I decided to leave them off of both maps. Instead, there is sufficient seismicity at sufficient depths with which to visualize the dipping megathrust faults (colors from shallow to deep: orange, yellow, green, blue, purple, and red).

    I include some inset figures in the poster.

  • In the upper left corner I include a general plate tectonic map showing the plate boundary faults, oceanic ridges, and oceanic plateaus (Seno and Maruyama, 1984).
  • In the center on the top I include a figure presented by Uyeda and Kanamori (1979) where they propose two end members for subduction zone geometry: (1) shallow dipping megathrusts, the “Chile type” and (2) deeply dipping megathrusts, the “Marianas type.”
  • In the lower left corner I include two figures. On the left is a regional tectonic map that shows how back arc spreading and arc volcanism have interacted to create the region. On the right is a cross-section at about 20 degrees North latitude. The cross-section shows how these elements interacted through time to result in the current configuration/geometry.
  • In the lower right corner is a low-angle oblique view of the bathymetry of the Mariana Trench, volcanic arc, and back arc (Susan Merle).
  • Above that is a cross section showing some specific components of the Mariana Trench region (Hussong et al., 1982).
  • In the upper right corner is a plot of seismicity from Matt Fouch (using data from Engdahl et al., 1998 ). On the left is a map showing the epicenters colored for depth. On the right are hypocenters plotted along cross-sections for different locations as designated on the map. Cross section E-E; is just north of the M 7.7 earthquake. I show the M 7.7 earthquake on the map and the cross-section as a large blue dot. Note how the M 7.7 earthquake happened along a very steeply dipping part of the megathrust. I include this figure with more a detailed description below.


  • This map shows earthquakes from 1900-2016 with magnitudes M ≥ 5.5.


  • Here is the tectonic map of the region. Seno and Maruyama (1984) muse paleomagnetic data from sediment cores to reconstruct the plate tectonic geometry since the Eocene. I include their figure captions as a blockquote.

  • Tectonic elements in the Philippine Sea, Deep Sea Drilling Project sites are indicated by solid squares with site numbers. I, B and G denote Izu Peninsula, Benin Islands and Guam, respectively. Volcanic ridges are spotted and remnant arcs are hatchured. Arrows indicate declination of paleomagnetism of two seamounts in the Sbikoku Basin (Vaccquier and Uyeda. 1957).

  • This is an updated cross-section of the Uyeda and Maruyama (1984) end member types of subduction zones from Stern et al. (2002). There are many variables that might control earthquakes along subduction zones that are also not represented by this model. These other variables might include at least: thickness of sediment on incoming oceanic crust, roughness of incoming oceanic crust (possibly affected by the overlying sediment), convergence rate, hydrogeologic processes (in crust or sediment), etc.

  • End-member types of subduction zones, based on the age of lithosphere being subducted (modified after Uyeda and Kanamori [1979]).

  • This shows the arc and backarc tectonic elements in this region (Stern et al., 2003).

  • Generalized locality map for the Izu-Bonin-Mariana Arc system. Dashed line labeled STL = Sofugan Tectonic Line.

  • This shows, in cross-section form, the magmatic evolution of the Back-Arc along the Mariana Trench (Stern et al., 2003).

  • Simplified history of the IBM arc system. Shaded areas are magmatically inactive, cross-hatched areas are magmatically active.

  • This is the cross section from Hussong and Fryer (1982) showing the crustal structure in the region of Deep Sea Drilling Project Site 60. More about this site is available online here. The upper panel is the original figure (showing the drill sites) and the lower panel is an updated version. These figures also show the velocity model in km/second (this shows how the seismic velocity varies through different materials). Note the rough incoming oceanic crust (see the Magellan Seamounts on the Pacific plate). The rough plate is also visible in the main poster above.

  • Physiographic diagram and crustal structure across the Mariana Trench and arc and the Mariana Trough, with Leg 60 site location shown. Crustal structure generalized from IODP site survey data by D. Hussong. Physiography drawn from IPOD site survey data by W. Coulbourn. This diagram summarizes the data and structural interpretations available prior to drilling.


  • Here Stern (2010) updates the cross section of Uyeda and Kanamori (1979) even further.

  • Comparison of Andean-type arc (a) and intra-oceanic arc system (b), greatly simplified.

    • Here is the seismicity cross section prepared by Fouch also an inset in the poster above.

    • Map view of bathymetry and seismicity in the IBM subduction zone using the earthquake catalog of Engdahl, van der Hilst & Buland 1998. Circles denote epicentral locations; lighter circles represent shallower events, darker circles represent deeper events. Black lines denote cross sectional areas depicted in 6 profiles on right, organized from N to S. Black circles represent hypocentral locations in volume ~60 km to each side of the lines shown on the map at left. Large variations in slab dip and maximum depth of seismicity are apparent. Distance along each section is measured from the magmatic arc. A) Northern Izu-Bonin region. Slab dip is ~45°; seismicity tapers off from ~175 km to ~300 km depth but increases around 400 km, and terminates at ~475 km. B) Central Izu Bonin region. Slab dip is nearly vertical; seismicity tapers off from ~100 km to ~325 km but increases in rate and extends horizontally around 500 km, and terminates at ~550 km. C) Southern Izu Bonin region. Slab dip is ~50°; seismicity is continuous to ~200 km, but a very few anomalous events are evident down to ~600 km. D) Northern Mariana region. Slab dip is ~60°; seismicity is continuous to ~375 km and terminates at ~400 km, but a very few anomalous events are evident down to ~600 km. E) Central Mariana region. Slab dip is vertical; seismicity tapers off slightly between ~275 km and ~575 km, but is essentially continuous. A pocket of deep events around 600 km exists, as well as 1 deep event at 680 km. F) Southern Mariana region. Slab dip is ~55°; seismicity is continuous to ~225 km, with an anomalous event at 375 km.

  • This is a great synthesis figure showing the tectonics of the central Mariana Trench (Oakley et al., 2008 ). This shows the bathymetry of the central Mariana Trench, along with Multi Channel Seismic lines used to characterize the lithospheric structure and seismic velocity profiles.

  • Regional location map. PSP, Philippine Sea Plate; PP, Pacific Plate; IBM, Izu-Bonin-Mariana Trenches; MT, Mariana Trough; WMR, West Mariana Ridge; PVB, Parece Vela Basin; PKR, Palau-Kushu Ridge; WPB, West Philippine Basin. Bathymetry of the central Mariana arc-trench system from combined surveys, sunlit from the east, showing EW0202 seismic lines. Interpreted lines are shown in red. Pacific Plate magnetic lineations from Nakanishi et al. [1992a] are drawn in white.

  • This is a larger scale map showing the active bending moment normal faults in the subducting Pacific plate (mapped as black lines in the map on the left). Cross-section profiles are shown in the center. Note how the roughness of the Pacific plate may impart some topography to the upper plate (Oakley et al., 2008 ).

  • Bathymetry along MCS tracks and generated profiles across the central Mariana Trench plotted from west to east. Flexure-related faults are outlined in black. The dashed line on the bathymetric map outlines the lower slope terrace in Region D. VE = 14x. Depth versus latitude along the Central Mariana Trench axis (orange) and outer fore
    arc (pink).

  • This is a cross section showing the plate and mantle geometry, the sediment thickness, and the structures in this region. There is a comparison between what is on the incoming (subducting) plate with what is found along the outer Mariana Forearc. This figure brings together many of the details that may control both intraplate (crustal) and interplate (megathrust) seismicity (Oakey et al., 2008 ).

  • Enlarged cross section along MCS Line 53–54 of the outer fore arc and subducting plate with numerically annotated features. To illustrate the deeper morphology in Region D, dotted lines show the bathymetry and subducted plate along MCS Line 79–80.

  • This map shows some moment tensors as calculated by Emry et al. (2014). The authors evaluate the cause for the faulting in this region and associate seismicity plotted in this map as due to the extension in the outer rise.

  • Relocated GCMT earthquakes in map view. Lower hemisphere stereographic projections for earthquakes are shown with compressional P wave quadrants (containing the T axis in black) and dilatational P wave quadrants (containing the P axis in white). The event numbers next to each focal mechanism correspond to Tables 2 and 4. The red arrow shows the angle of convergence of the Pacific plate relative to the Mariana fore arc as determined by Kato et al. [2003]. High-resolution bathymetry data in Northern and Central Mariana are from 2010 Mariana Law of the Sea Cruise [Gardner, 2010] and high-resolution bathymetry data in Southern Mariana are courtesy of F.Martinez. The color scale for bathymetry is positioned below and is the same for all bathymetric maps in the paper. (inset) Tectonic setting of the Philippine Sea. Bathymetry contours are shown by thin black lines. Subduction trenches are shown in blue; spreading centers are shown in red; transforms are shown in green.

  • Here is a larger scale view of the bathymetry and moment tensors (Emry et al., 2014). The normal faults are easy to see in the bathymetry (e.g. the white lines on the right side of the map). Note how the moment tensors are aligned subparallel to the faults.

  • (top) Relocated GCMT earthquake locations in map view. Lower hemisphere stereographic projections for earthquakes are shown with compressional quadrants (in black) and dilatational quadrants (in white). The red arrow shows the angle and rate of Pacific plate convergence relative to the fore arc as determined by Kato et al. [2003]. High-resolution bathymetry data are from Gardner [2010]. The bathymetry scale is the same as in [the figure above]. Inset shows the tectonic setting of the Mariana Islands. Bathymetry contours are shown by thin black lines. The trench axis is shown in blue; back-arc spreading center is in red; transform is in green.
  • (bottom) Trench perpendicular cross section with the location of the subduction trench at 0 km; negative distances indicate the distance landward (or west of the trench) and positive distances indicate seaward distances (or east of the trench). Thick black lines show the bathymetry along (17.25°N, 147.3577°E) to (17.2752°N, 148.9311°E). Thick red lines show depth to the Moho used in our waveform inversion. Black squares show the depth to the plate interface at ~17°N from Oakley et al. [2008]; red squares indicate the continuation of the Moho landward from the trench. Focal mechanisms for the region are rotated 90° into cross section. Dilatational quadrants are indicated by white while compressional quadrants are indicated by red. Vertical exaggeration (VE) is 1.5.
  • These are model results that show an estimate for the changes in stresses in the crust due to flexure of the outer rise along the Mariana Trench (Emry et al., 2014). Seismicity is plotted along these cross sections. Note how the shallow region that experiences flexure also experiences extension up to more than 100 MPa. Note how the earthquakes in Central Mariana all occur in this region (in contrast to Southern Mariana).

  • (top) The best fit flexure model for the Central Mariana outer rise using bathymetry seaward (east) of the trench axis. (bottom) The best fit flexure model for the Southern Mariana outer rise using bathymetry seaward (southeast) of the trench axis. Tensional deviatoric stresses correspond to blue regions and positive values (MPa); compression corresponds to red regions and negative values, and black regions indicate highly compressional stresses where the color scale has saturated. Extensional earthquakes plotted as white diamonds; strike-slip earthquakes are black crosses; compressional earthquakes are gray circles.

References:

Earthquake Report: Bayside (northern California): Update #1

So, I put together another map with today’s earthquake in context with the historic seismicity and some other factors. Now the USGS magnitude is M = 4.7 and there is a moment tensor for this earthquake (that looks very similar to the focal mechanism, which is not always the case.). Here is my initial earthquake report here.
Below is a map showing the Northern California Earthquake Data Center (NCEDC) seismicity plotted. Today’s M 4.7 earthquake is plotted as a yellow star. This earthquake is similar to other earthquakes plotted in this region.

    Here are the data plotted on the map.

  • Northern California Earthquake Data Center Double Differenced earthquake epicenters, using the Northern California Earthquake Catalog (1984-2014). These epicenters are located by using the double difference method. Basically, earthquakes from a similar region are processed in such a way that, because they are in a similar region it is assumed that the seismic waves/rays travel through the same material (i.e. with the same seismic velocity). With this assumption, their positions can be better determined. These better positions are better relative to each other, but not in an absolute way. Here is an overview of the double difference method from Lamont Doherty. There is a software program that people use to process seismic data for this method (HypoDD).
  • These earthquake epicenters are plotted vs depth with color and magnitude with circle diameter.
  • I plot the depth to the slab in purple. These lines represent an estimate of the depth of the Cascadia subduction zone fault (McCrory et al., 2006).
  • I also plot the current USGS active fault and fold database. The offshore fault map is incomplete, but has been remapped by Dr. Chris Goldfinger and will be released by the USGS in the coming months. I cannot plot the new faults until it is officially released. These faults are in red and then I also plot the faults used by the USGS national seismic hazard map team in black.
  • On the eastern part of the map one may observe the non-volcanic tremor interpreted by the Pacific Northwest Seismic Network. These data can be downloaded by anyone. There is also a great online interface that lets one create animations. These tremor are basically small earthquakes that are not as resolvable on seismographs, so they cannot be located like regular earthquakes. Because of this, these tremor locations are only epicenters (no depth information).
  • The background data are topographic data and bathmetric data compiled by Dr. Jason Chaytor when he was working at the Active Tectonics Lab at Oregon State University.


    I also include some inset figures.

  • In the upper left corner I place a map of the Cascadia subduction zone. This map shows the Cascadia subduction zone, along with other major plate boundary faults in the region (Gorda Rise, Mendocino fault, San Andreas fault). The Juan de Fuca and Gorda plates subduct norteastwardly beneath the North America plate at rates ranging from 29- to 45-mm/yr. Sites where evidence of past earthquakes (paleoseismology) are denoted by white dots. Where there is also evidence for past CSZ tsunami, there are black dots. These paleoseismology sites are labeled (e.g. Humboldt Bay). Some submarine paleoseismology core sites are also shown as grey dots. The two main spreading ridges are not labeled, but the northern one is the Juan de Fuca ridge (where oceanic crust is formed for the Juan de Fuca plate) and the southern one is the Gorda rise (where the oceanic crust is formed for the Gorda plate). The map also shows the interpretation of faults that are part of the internally deforming Gorda plate. These faults within the Gorda plate are responsible for the large damaging earthquakes in 1980, 2005, and 2010 (others also in 2014, and 2015).
  • In the upper right corner I place a figure from Rollins and Stein (2010) that shows their interpretations for some earthquakes in this region. This was published in response to the January 2010 Gorda plate earthquake. The faults are from Chaytor et al. (2004). The 1980, 1992, 1994, 2005, and 2010 earthquakes are plotted and labeled.
  • In the lower left corner I place a figure from Chaytor et al. (2004) that shows their interpretation of the tectonics of the Gorda plate based upon high resolution bathymetric data (showing the shape of the seafloor).
  • I also include the moment tensor and a moment tensor legend. There is more material from the USGS web sites about moment tensors and focal mechanisms (the beach ball symbols). Both moment tensors and focal mechanisms are solutions to seismologic data that reveal two possible interpretations for fault orientation and sense of motion. One must use other information, like the regional tectonics, to interpret which of the two possibilities is more likely.

Here is my initial earthquake report map as presented in the first earthquake report here.


Here is the seismic record from Jaime Wayne’s Netquake Seismometer. Here is a link to the netquake page. The seismometer is located near Orick.


In this map below (from a Mendocino fault earthquake on 2016/01/01), I label a number of other significant earthquakes in this Mendocino triple junction region. Another historic right-lateral earthquake on the Mendocino fault system was in 1994. There was a series of earthquakes possibly along the easternmost section of the Mendocino fault system in late January 2015, here is my post about that earthquake series.

References:

  • Chaytor, J.D., Goldfinger, C., Dziak, R.P., Fox, C.G., 2004. Active deformation of the Gorda plate: Constraining deformation models with new geophysical data. Geology 32, 353-356.
  • McCrory, P. A., Blair, J. L., Oppenheimer, D. H., and Walter, S. R., 2006. Depth to the Juan de Fuca slab beneath the Cascadia subduction margin; a 3-D model for sorting earthquakes U. S. Geological Survey
  • Nelson, A.R., Kelsey, H.M., Witter, R.C., 2006. Great earthquakes of variable magnitude at the Cascadia subduction zone. Quaternary Research 65, 354-365.
  • Rollins, J.C., Stein, R.S., 2010. Coulomb Stress Interactions Among M ≥ 5.9 Earthquakes in the Gorda Deformation Zone and on the Mendocino Fault Zone, Cascadia Subduction Zone, and Northern San Andreas Fault. Journal of Geophysical Research 115, 19 pp.

Earthquake Report: Bayside (northern California)

Well, after installing a stilling basin for our new tide gage installation at Trinidad, CA, I was napping in my upstairs bedroom in Manila, CA. I was awakened by a short (2-3 second) short shaking earthquake. Turns out it was a M 4.8 earthquake east-southeast of my residence. Here is the USGS website for this earthquake. The depth is currently set at about 23 km, so it is near the megathrust, but is probably in the Gorda plate. There was an earthquake in this region last October, which had a different focal mechanism and was to the north a few kms.
#Update 1. I looked at the map at the bottom of this report. Today’s earthquake plots close to where the megathrust is estimated to be between 15 and 20 km (McCrory et al., 2006). So, I was correct that this earthquake is in the downgoing Gorda plate.
#Update 2. The map now has a moment tensor (blue) instead of a focal mechanism (orange). Now I am thinking that this could possibly be on an east-west fault since it is more aligned with the Mendocino fault. However, I am sticking with my initial interpretation as most of the earthquakes that we know about in the Gorda plate are northeast striking left-lateral strike slip faults.

    I put together this quick earthquake poster for this earthquake and have a few brief inset figures.

  • In the upper left corner I place a map of the Cascadia subduction zone. I discuss this figure below.
  • In the upper right corner I place three figures. These three maps each show a different measure of the ground shaking using the Modified Mercalli Intensity Scale. The MMI is a qualitative measure of shaking intensity. More on the MMI scale can be found here and here.
      From left to right:

    1. The “Did You Feel It?” map. This is a map that shows the ground shaking based upon peoples’ online reporting.
    2. The Shake Map. This map shows a computer modeled estimate of the ground shaking.
    3. The MMI contour map.
    4. In the lower right corner I show the attenuation with distance plot. This is a plot showing how the ground motions attenuate (lessen) with distance from the earthquake. The orange line is an estimate of the intensity of ground motions based on a numerical model. This numerical model is based on a regression of hundreds of earthquakes (distance vs. magnitude/intensity). These regressions form the basis for Ground Motion Prediction Equations (GMPEs). The blue dots are the actual observations made by real people (using the DYFI form that I posted above). These model based estimates of ground shaking intensity are used, especially for larger earthquakes, to determine what damage might be expected.
    5. I placed a moment tensor / focal mechanism legend in the upper right corner of the map. There is more material from the USGS web sites about moment tensors and focal mechanisms (the beach ball symbols). Both moment tensors and focal mechanisms are solutions to seismologic data that reveal two possible interpretations for fault orientation and sense of motion. One must use other information, like the regional tectonics, to interpret which of the two possibilities is more likely. I suspect that this is probably a left lateral strike slip earthquake based upon the focal mechanism and our knowledge of the tectonics of the Gorda plate.


      Here is the record from the seismometer located across the hallway from the HSU Dept of Geology Office. The seismograph is located in Van Matre Hall. Photo Credit Dr. Mark Hemphill-Haley.


      Here I have a summary of earthquakes for this region (including an earthquake in the Explorer plate to the north).


      I present material about the Cascadia subduction zone for the Friends of the Arcata Marsh (FOAM) held on 7/22/16 at the Arcata Marsh Interpretive Center. This page has some supporting material from this presentation, including the digital presentation file. The material in this post is also found on this page here.


      Here is a map of the Cascadia subduction zone, modified from Nelson et al. (2004). The Juan de Fuca and Gorda plates subduct norteastwardly beneath the North America plate at rates ranging from 29- to 45-mm/yr. Sites where evidence of past earthquakes (paleoseismology) are denoted by white dots. Where there is also evidence for past CSZ tsunami, there are black dots. These paleoseismology sites are labeled (e.g. Humboldt Bay). Some submarine paleoseismology core sites are also shown as grey dots. The two main spreading ridges are not labeled, but the northern one is the Juan de Fuca ridge (where oceanic crust is formed for the Juan de Fuca plate) and the southern one is the Gorda rise (where the oceanic crust is formed for the Gorda plate).


      Here is a version of the CSZ cross section alone (Plafker, 1972). This shows two parts of the earthquake cycle: the interseismic part (between earthquakes) and the coseismic part (during earthquakes). Regions that experience uplift during the interseismic period tend to experience subsidence during the coseismic period.


      This figure shows how a subduction zone deforms between (interseismic) and during (coseismic) earthquakes. We also can see how a subduction zone generates a tsunami. Atwater et al., 2005.


      Here is an animation produced by the folks at Cal Tech following the 2004 Sumatra-Andaman subduction zone earthquake. I have several posts about that earthquake here and here. One may learn more about this animation, as well as download this animation here.

      This figure shows the regions that participate in this interseismic and coseismic deformation at Cascadia. Atwater et al., 2005. Black dots on the map show sites where evidence for coseismic subsidence has been found in coastal marshes, lakes, and estuaries.


      Here is a map showing a number of data sets. Seismicity is plotted versus depth (NCEDC). Tremor is plotted (Pacific Northwest Seismic Network). Vertical Deformation rates are plotted (unpublished). Slab depth contours (km) are plotted (McCrory et al., 2006). Fault locking zones are plotted (Wang et al., 2003; Burgette et al., 2009). Bob McPherson (Humboldt State University, Department of Geology) is currently working on a research paper where he will discuss how the seismicity reveals the location of the seismogenically locked fault zone.


      This map shows the various possible prehistoric earthquake rupture regions (patches) for the past 10,000 years. Goldfinger et al., 2012. These rupture scenarios have been adopted by the USGS hazards team that determines the seismic hazards for the USA.

        References:

      • Atwater, B.F., Musumi-Rokkaku, S., Satake, K., Tsuju, Y., Eueda, K., and Yamaguchi, D.K., 2005. The Orphan Tsunami of 1700—Japanese Clues to a Parent Earthquake in North America, USGS Professional Paper 1707, USGS, Reston, VA, 144 pp.
      • Burgette, R. et al., 2009. Interseismic uplift rates for western Oregon and along-strike variation in locking on the Cascadia subduction zone in Journal of Geophysical Research, v. 114, B01408, doi:10.1029/2008JB005679
      • Chaytor, J.D., Goldfinger, C., Dziak, R.P., and Fox, C.G., 2004. Active deformation of the Gorda plate: Constraining deformation models with new geophysical data: Geology v. 32, p. 353-356
      • Goldfinger, C., Nelson, C.H., Morey, A., Johnson, J.E., Gutierrez-Pastor, J., Eriksson, A.T., Karabanov, E., Patton, J., Gràcia, E., Enkin, R., Dallimore, A., Dunhill, G., and Vallier, T., 2012. Turbidite Event History: Methods and Implications for Holocene Paleoseismicity of the Cascadia Subduction Zone, USGS Professional Paper # 1661F. U.S. Geological Survey, Reston, VA, 184 pp.
      • McCrory, P. A., Blair, J. L., Oppenheimer, D. H., and Walter, S. R., 2006. Depth to the Juan de Fuca slab beneath the Cascadia subduction margin; a 3-D model for sorting earthquakes U. S. Geological Survey
      • Nelson, A.R., Kelsey, H.M., and Witter, R.C., 2006. Great earthquakes of variable magnitude at the Cascadia subduction zone: Quaternary Research, doi:10.1016/j.yqres.2006.02.009, p. 354-365.
      • Plafker, G., 1972. Alaskan earthquake of 1964 and Chilean earthquake of 1960: Implications for arc tectonics in Journal of Geophysical Research, v. 77, p. 901-925.
      • USGS Quaternary Fault Database: http://earthquake.usgs.gov/hazards/qfaults/
      • Wang, K., Wells, R., Mazzotti, S., Hyndman, R. D., and Sagiya, T., 2003. A revised dislocation model of interseismic deformation of the Cascadia subduction zone Journal of Geophysical Research, B, Solid Earth and Planets v. 108, no. 1.

Friends of the Arcata Marsh 2016.07.22

I present material about the Cascadia subduction zone for the Friends of the Arcata Marsh (FOAM) held on 7/22/16 at the Arcata Marsh Interpretive Center. This page has some supporting material from this presentation, including the digital presentation file. The material in this post is also found on this page here.

    This is the digital presentation

  • Here is the digital presentation (50 MB pptx). A draft presentation is in place and will be updated the day of the presentation.

    This is a video of the presentation

  • Here I will post a video of the presentation.

    Here are some sources of information about the Cascadia subduction zone

  • For the 315th anniversary of the most recent full rupture CSZ earthquake I put together a summary of our state of knowledge about the CSZ and that 1700 A.D. Jan. 26 earthquake. 2015.01.26
  • The USGS (and others) put together an educational video about the CSZ. I post this video and other supporting information online here: 2015.10.08

Here is an educational video about Cascadia subduction zone earthquakes and tsunamis.

Here is a tsunami hindcast for the Jan 26, 1700 Cascadia subduction zone megathrust earthquake that may have ruptured all the way south to Humboldt Bay. This is the download link for the embedded video below (35 MB mp4).


Here is an animation showing the Holocene record of earthquakes along the Cascadia subduction zone (Goldfinger et al., 2012).

Here is an animation of a Cascadia subduction zone earthquake generated tsunami. This is the download link for the embedded video below (15 MB mp4).

Here is an animation of the numerical simulation for tsunami inundation at Cannon Beach (Ecola Creek).
This was prepared by Rob Witter (Witter, 2008 ).

  • This is the digital file of the embedded video below (52 MB mp4)