Earthquake Report: M 6.8 Ecuador

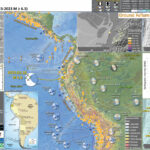
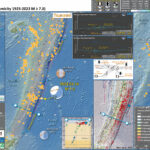
This morning my time there was a magnitude M 6.8 earthquake in Ecuador.

https://earthquake.usgs.gov/earthquakes/eventpage/pt23077000/executive

I got a notification that there would not be a tsunami to reach the west coast of the USA. Because of the depth and magnitude, there was a low chance for a local tsunami as well (but we have been surprised before). I could not identify a tsunami on the tide gages in the region.

However, the USGS One Pager PAGER alert suggests that there may be significant casualties. I hope this estimate is incorrect. I have seen some videos online of significant building damage.

The USGS prepares models to estimate the chance of earthquake triggered landslides and earthquake induced liquefaction. These models suggest that there is a low chance for landslides but a moderate chance for liquefaction. See the ground failure section of the USGS earthquake page for more information.

I don’t always have the time to write a proper Earthquake Report. However, I prepare interpretive posters for these events.

Because of this, I present Earthquake Report Lite. (but it is more than just water, like the adult beverage that claims otherwise). I will try to describe the figures included in the poster, but sometimes I will simply post the poster here.

Below is my interpretive poster for this earthquake

  • I plot the seismicity from the past month, with diameter representing magnitude (see legend). I include earthquake epicenters from 1923-2023 with magnitudes M ≥ 6.5.
  • I plot the USGS fault plane solutions (moment tensors in blue and focal mechanisms in orange), possibly in addition to some relevant historic earthquakes.
  • A review of the basic base map variations and data that I use for the interpretive posters can be found on the Earthquake Reports page. I have improved these posters over time and some of this background information applies to the older posters.
  • Some basic fundamentals of earthquake geology and plate tectonics can be found on the Earthquake Plate Tectonic Fundamentals page.

    I include some inset figures.

  • In the upper left corner is a large scale plate tectonic map showing the major plate boundary faults.
  • In the lower left center is a map showing how the Nazca slab is configured in different locations (Ramos and Folguera, 2009).
  • In the left center is a cross section showing seismicity in this region (Kirby et al., 1995). The source area for this plot is designated by a dashed yellow box on the map.
  • In the upper right corner is a pair of maps that show the landslide probability (left) and the liquefaction susceptibility (right) for this M 6.8 earthquake. I spend more time describing these types of data here. Read more about these maps here.
  • In the lower right corner I plot the USGS modeled intensity (Modified Mercalli Intensity scale, MMI) and the USGS “Did You Feel It?” observations (labeled in yellow). Above the map is a plot showing these same data plotted relative to distance from the earthquake. Read more about what these data sets are and what they represent in the report here.
  • Here is the map with 3 month’s seismicity plotted.

    References:

    Basic & General References

  • Frisch, W., Meschede, M., Blakey, R., 2011. Plate Tectonics, Springer-Verlag, London, 213 pp.
  • Hayes, G., 2018, Slab2 – A Comprehensive Subduction Zone Geometry Model: U.S. Geological Survey data release, https://doi.org/10.5066/F7PV6JNV.
  • Holt, W. E., C. Kreemer, A. J. Haines, L. Estey, C. Meertens, G. Blewitt, and D. Lavallee (2005), Project helps constrain continental dynamics and seismic hazards, Eos Trans. AGU, 86(41), 383–387, , https://doi.org/10.1029/2005EO410002. /li>
  • Jessee, M.A.N., Hamburger, M. W., Allstadt, K., Wald, D. J., Robeson, S. M., Tanyas, H., et al. (2018). A global empirical model for near-real-time assessment of seismically induced landslides. Journal of Geophysical Research: Earth Surface, 123, 1835–1859. https://doi.org/10.1029/2017JF004494
  • Kreemer, C., J. Haines, W. Holt, G. Blewitt, and D. Lavallee (2000), On the determination of a global strain rate model, Geophys. J. Int., 52(10), 765–770.
  • Kreemer, C., W. E. Holt, and A. J. Haines (2003), An integrated global model of present-day plate motions and plate boundary deformation, Geophys. J. Int., 154(1), 8–34, , https://doi.org/10.1046/j.1365-246X.2003.01917.x.
  • Kreemer, C., G. Blewitt, E.C. Klein, 2014. A geodetic plate motion and Global Strain Rate Model in Geochemistry, Geophysics, Geosystems, v. 15, p. 3849-3889, https://doi.org/10.1002/2014GC005407.
  • Meyer, B., Saltus, R., Chulliat, a., 2017. EMAG2: Earth Magnetic Anomaly Grid (2-arc-minute resolution) Version 3. National Centers for Environmental Information, NOAA. Model. https://doi.org/10.7289/V5H70CVX
  • Müller, R.D., Sdrolias, M., Gaina, C. and Roest, W.R., 2008, Age spreading rates and spreading asymmetry of the world’s ocean crust in Geochemistry, Geophysics, Geosystems, 9, Q04006, https://doi.org/10.1029/2007GC001743
  • Pagani,M. , J. Garcia-Pelaez, R. Gee, K. Johnson, V. Poggi, R. Styron, G. Weatherill, M. Simionato, D. Viganò, L. Danciu, D. Monelli (2018). Global Earthquake Model (GEM) Seismic Hazard Map (version 2018.1 – December 2018), DOI: 10.13117/GEM-GLOBAL-SEISMIC-HAZARD-MAP-2018.1
  • Silva, V ., D Amo-Oduro, A Calderon, J Dabbeek, V Despotaki, L Martins, A Rao, M Simionato, D Viganò, C Yepes, A Acevedo, N Horspool, H Crowley, K Jaiswal, M Journeay, M Pittore, 2018. Global Earthquake Model (GEM) Seismic Risk Map (version 2018.1). https://doi.org/10.13117/GEM-GLOBAL-SEISMIC-RISK-MAP-2018.1
  • Zhu, J., Baise, L. G., Thompson, E. M., 2017, An Updated Geospatial Liquefaction Model for Global Application, Bulletin of the Seismological Society of America, 107, p 1365-1385, https://doi.org/0.1785/0120160198
  • Specific References

  • Antonijevic, S.K., et a;l., 2015. The role of ridges in the formation and longevity of flat slabs in Nature, v. 524, p. 212-215, doi:10.1038/nature14648
  • Bishop, B.T., Beck, S.L., Zandt, G., Wagner, L., Long, M., Knezevic Antonijevic, S., Kumar, A., and Tavera, H., 2017, Causes and consequences of flat-slab subduction in southern Peru: Geosphere, v. 13, no. 5, p. 1392–1407, doi:10.1130/GES01440.1.
  • Chlieh, M. Mothes, P.A>, Nocquet, J-M., Jarrin, P., Charvis, P., Cisneros, D., Font, Y., Color, J-Y., Villegas-Lanza, J-C., Rolandone, F., Vallée, M., Regnier, M., Sogovia, M., Martin, X., and Yepes, H., 2014. Distribution of discrete seismic asperities and aseismic slip along the Ecuadorian megathrust in Earth and Planetary Science Letters, v. 400, p. 292–301
  • Kumar, A., et al., 2016. Seismicity and state of stress in the central and southern Peruvian flat slab in EPSL, v. 441, p. 71-80. http://dx.doi.org/10.1016/j.epsl.2016.02.023
  • Rhea, S., Hayes, G., Villaseñor, A., Furlong, K.P., Tarr, A.C., and Benz, H.M., 2010. Seismicity of the earth 1900–2007, Nazca Plate and South America: U.S. Geological Survey Open-File Report 2010–1083-E, 1 sheet, scale 1:12,000,000.
  • Villegas-Lanza, J. C., M. Chlieh, O. Cavalié, H. Tavera, P. Baby, J. Chire-Chira, and J.-M. Nocquet (2016), Active tectonics of Peru: Heterogeneous interseismic coupling along the Nazca megathrust, rigid motion of the Peruvian Sliver, and Subandean shortening accommodation, J. Geophys. Res. Solid Earth, 121, 7371–7394, https://doi.org/10.1002/2016JB013080.
  • Wagner, L.S., and Okal, E.A., 2019. The Pucallpa Nest and its constraints on the geometry of the Peruvian Flat Slab in Tectonophysics, v. 762, p. 97-108, https://doi.org/10.1016/j.tecto.2019.04.021
  • Yepes,H., L. Audin, A. Alvarado, C. Beauval, J. Aguilar, Y. Font, and F. Cotton (2016), A new view for the geodynamics of Ecuador: Implication in seismogenic source definition and seismic hazard assessment, Tectonics, 35, 1249–1279, https://doi.org/10.1002/2015TC003941.

Return to the Earthquake Reports page.


Earthquake Report: M 7.0 Kermadec

Tonight (my time) there was a tsunami notification for a magnitude M 7.1 earthquake along the Kermadec subduction zone.

https://earthquake.usgs.gov/earthquakes/eventpage/us7000jkbd/executive

My cat is not letting me complete this report. So, I will add some more stuff over the next few days.

There was an earthquake further to the north last November, check out that report here.

In this part of the world, there is a convergent plate boundary where the Pacific plate dives westward beneath the Australia plate forming the Kermadec megathrust subduction zone fault. This fault has a history of earthquakes with magnitudes commonly exceeding M 7 and some exceeding M 8.

Below is my interpretive poster for this earthquake

  • I plot the seismicity from the past month, with diameter representing magnitude (see legend). I include earthquake epicenters from 1922-2022 with magnitudes M ≥ 7.0 in one version.
  • I plot the USGS fault plane solutions (moment tensors in blue and focal mechanisms in orange), possibly in addition to some relevant historic earthquakes.
  • A review of the basic base map variations and data that I use for the interpretive posters can be found on the Earthquake Reports page. I have improved these posters over time and some of this background information applies to the older posters.
  • Some basic fundamentals of earthquake geology and plate tectonics can be found on the Earthquake Plate Tectonic Fundamentals page.

    I include some inset figures. Some of the same figures are located in different places on the larger scale map below.

  • In the upper left corner is a map that shows the major plate tectonic boundaries.
  • In the lower right corner is a map that shows the ground shaking from the earthquake, with color representing intensity using the Modified Mercalli Intensity (MMI) scale. The closer to the earthquake, the stronger the ground shaking. The colors on the map represent the USGS model of ground shaking. The colored circles represent reports from people who posted information on the USGS Did You Feel It? part of the website for this earthquake. There are things that affect the strength of ground shaking other than distance, which is why the reported intensities are different from the modeled intensities.
  • In the upper right corner is a larger scale map that shows the crustal faults in the Pacific plate. Today’s M 7.0 was in the Pacific plate. It appears tensional oblique (strike-slip and tensional). There are two other historic examples of outer rise earthquakes in 1977 and 2001.
  • To the left are tide gage plots from the tide gages on Raoul Island (shown on map).
  • In the lower right center is a map from Benz et al. (2011) that shows earthquakes with circles that represent magnitude (diameter) and depth (color). Deeper = blue & shallower = red. There is a cross section (cut into the earth) profile through this seismicity (the blue line J-J’). I plot the M 7.0 as a blue star.
  • To the left of the map is cross section J-J’ that shows earthquake hypocenters (3-D locations) in the region of the M 7.0 earthquake.
  • Above the Benz map, there is a cross section of the Kermadec trench that shows different places where there could be earthquakes along this plate boundary.
  • Here is the map with 2 month’s seismicity M ≥ 0 plotted.

  • Well, as I was preparing this report, I realized that I prepared an interpretive poster and never wrote it up!
  • So, here is the poster for a magnitude M 7.4 earthquake from 18 June 2020.
  • This M 7.4 earthquake was also in the downgoing Pacific plate.

Some Relevant Discussion and Figures

  • Here is the tectonic map from Ballance et al., 1999.

  • Map of the Southwest Pacific Ocean showing the regional tectonic setting and location of the two dredged profiles. Depth contours in kilometres. The presently active arcs comprise New Zealand–Kermadec Ridge–Tonga Ridge, linked with Vanuatu by transforms associated with the North Fiji Basin. Colville Ridge–Lau Ridge is the remnant arc. Havre Trough–Lau Basin is the active backarc basin. Kermadec–Tonga Trench marks the site of subduction of Pacific lithosphere westward beneath Australian plate lithosphere. North and South Fiji Basins are marginal basins of late Neogene and probable Oligocene age, respectively. 5.4sK–Ar date of dredged basalt sample (Adams et al., 1994).

  • Here is a great visualization of the Kermadec Trench from Woods Hole.

Kermadec Trench from Woods Hole Oceanographic Inst. on Vimeo.

  • Here is another map of the bathymetry in this region of the Kermadec trench. This was produced by Jack Cook at the Woods Hole Oceanographic Institution. The Lousiville Seamount Chain is clearly visible in this graphic.

  • I put together an animation of seismicity from 1965 – 2015 Sept. 7. Here is a map that shows the entire seismicity for this period. I plot the slab contours for the subduction zone here. These were created by the USGS (Hayes et al., 2012).

  • Here is the animation. Download the mp4 file here. This animation includes earthquakes with magnitudes greater than M 6.5 and this is the kml file that I used to make this animation.

    References:

    Basic & General References

  • Frisch, W., Meschede, M., Blakey, R., 2011. Plate Tectonics, Springer-Verlag, London, 213 pp.
  • Hayes, G., 2018, Slab2 – A Comprehensive Subduction Zone Geometry Model: U.S. Geological Survey data release, https://doi.org/10.5066/F7PV6JNV.
  • Holt, W. E., C. Kreemer, A. J. Haines, L. Estey, C. Meertens, G. Blewitt, and D. Lavallee (2005), Project helps constrain continental dynamics and seismic hazards, Eos Trans. AGU, 86(41), 383–387, , https://doi.org/10.1029/2005EO410002. /li>
  • Jessee, M.A.N., Hamburger, M. W., Allstadt, K., Wald, D. J., Robeson, S. M., Tanyas, H., et al. (2018). A global empirical model for near-real-time assessment of seismically induced landslides. Journal of Geophysical Research: Earth Surface, 123, 1835–1859. https://doi.org/10.1029/2017JF004494
  • Kreemer, C., J. Haines, W. Holt, G. Blewitt, and D. Lavallee (2000), On the determination of a global strain rate model, Geophys. J. Int., 52(10), 765–770.
  • Kreemer, C., W. E. Holt, and A. J. Haines (2003), An integrated global model of present-day plate motions and plate boundary deformation, Geophys. J. Int., 154(1), 8–34, , https://doi.org/10.1046/j.1365-246X.2003.01917.x.
  • Kreemer, C., G. Blewitt, E.C. Klein, 2014. A geodetic plate motion and Global Strain Rate Model in Geochemistry, Geophysics, Geosystems, v. 15, p. 3849-3889, https://doi.org/10.1002/2014GC005407.
  • Meyer, B., Saltus, R., Chulliat, a., 2017. EMAG2: Earth Magnetic Anomaly Grid (2-arc-minute resolution) Version 3. National Centers for Environmental Information, NOAA. Model. https://doi.org/10.7289/V5H70CVX
  • Müller, R.D., Sdrolias, M., Gaina, C. and Roest, W.R., 2008, Age spreading rates and spreading asymmetry of the world’s ocean crust in Geochemistry, Geophysics, Geosystems, 9, Q04006, https://doi.org/10.1029/2007GC001743
  • Pagani,M. , J. Garcia-Pelaez, R. Gee, K. Johnson, V. Poggi, R. Styron, G. Weatherill, M. Simionato, D. Viganò, L. Danciu, D. Monelli (2018). Global Earthquake Model (GEM) Seismic Hazard Map (version 2018.1 – December 2018), DOI: 10.13117/GEM-GLOBAL-SEISMIC-HAZARD-MAP-2018.1
  • Silva, V ., D Amo-Oduro, A Calderon, J Dabbeek, V Despotaki, L Martins, A Rao, M Simionato, D Viganò, C Yepes, A Acevedo, N Horspool, H Crowley, K Jaiswal, M Journeay, M Pittore, 2018. Global Earthquake Model (GEM) Seismic Risk Map (version 2018.1). https://doi.org/10.13117/GEM-GLOBAL-SEISMIC-RISK-MAP-2018.1
  • Zhu, J., Baise, L. G., Thompson, E. M., 2017, An Updated Geospatial Liquefaction Model for Global Application, Bulletin of the Seismological Society of America, 107, p 1365-1385, https://doi.org/0.1785/0120160198
  • Specific References

  • Richards, S., Holm, R., and Barber, G., 2011. Skip Nav Destination When slabs collide: A tectonic assessment of deep earthquakes in the Tonga-Vanuatu region in Geology, c. 39, no. 8, p. 787-790, https://doi.org/10.1130/G31937.1
  • Timm, C., Bassett, D., Graham, I. et al. Louisville seamount subduction and its implication on mantle flow beneath the central Tonga–Kermadec arc. Nat Commun 4, 1720 (2013). https://doi.org/10.1038/ncomms2702

Return to the Earthquake Reports page.