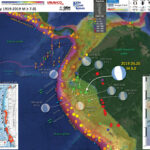
Just a moment ago, there was an intermediate depth Great Earthquake (magnitude M≥8.0) beneath Peru. I was heading to bed at about 1:10 local time (Sacramento, CA) when I noticed a tweet from Dr. Anthony Lomax (presenting his first motion mechanism for this earthquake). I realized that I was no longer heading to bed. I put together the interpretive posters and tweeted out to social media, but put off completing the report until today.
https://earthquake.usgs.gov/earthquakes/eventpage/us60003sc0/executive
The major plate boundary in this region of the world is the subduction zone that forms the Peru-Chile Trench, where the Nazca plate dives eastwards beneath the South America plate.
This magnitude M = 8.0 Great earthquake is extensional (normal) and in the downgoing Nazca plate at a depth of about 110 km. Earthquakes M ≥ 8 are generally considered “Great” earthquakes.
In the past few years, there have been some good examples of deep earthquakes, depths ≥ 300 km or so. For example an M 7.6 on 2015.11.24, an M 6.8 on 2018.04.02, an M 7.1 on 2018.08.24, an M 7.5 on 2019.02.22, and a M 7.0 on 2019.03.01. Today’s temblor happened ~500 km from the 2 February 2019 M 7.5 quake. It seems that the M 8 may be related to this earlier M 7.5, though someone would need to conduct coulomb modeling to get a better gauge of this possibility.
At first take, this event was deep, so some would consider this to lead to lesser damage had the quake been closer to the surface. While this is true, the size of the quake and the fact that it was not deep (but intermediate in depth, at about 110 km), the damage has shown to be quite extensive. The USGS PAGER alert, along with the USGS liquefaction and landslide probability maps, also suggested that this event would be deadly and damaging (unfortunately). Luckily, the areas hardest hit have low population exposure. Though Iquitos is still pretty close. The MMI contours show MMI VII (very strong shaking) near the epicenter.
Below I present the standard interpretive posters, as well as maps that show the USGS Ground Failure products.
Today’s earthquake appears to have occurred where the downgoing Nazca plate is changing the steepness of dip (the angle measured from the horizontal plane). To the west of the quake, the subducting slab is less steeply dipping (flat slab subduction), and to the east, the slab is dipping more steeply. As the plate bends downwards, there is extension in the upper part of the subducting slab (like when one bends a finger, the wrinkles in their knuckles stretch out and disappear due to the extension in the upper part of the finger).
Below is my interpretive poster for this earthquake
I plot the seismicity from the past month, with color representing depth and diameter representing magnitude (see legend). I include earthquake epicenters from 1918-2018 with magnitudes M ≥ 3.0 in one version.
I plot the USGS fault plane solutions (moment tensors in blue and focal mechanisms in orange), possibly in addition to some relevant historic earthquakes.
- I placed a moment tensor / focal mechanism legend on the poster. There is more material from the USGS web sites about moment tensors and focal mechanisms (the beach ball symbols). Both moment tensors and focal mechanisms are solutions to seismologic data that reveal two possible interpretations for fault orientation and sense of motion. One must use other information, like the regional tectonics, to interpret which of the two possibilities is more likely.
- I also include the shaking intensity contours on the map. These use the Modified Mercalli Intensity Scale (MMI; see the legend on the map). This is based upon a computer model estimate of ground motions, different from the “Did You Feel It?” estimate of ground motions that is actually based on real observations. The MMI is a qualitative measure of shaking intensity. More on the MMI scale can be found here and here. This is based upon a computer model estimate of ground motions, different from the “Did You Feel It?” estimate of ground motions that is actually based on real observations.
- I include the slab 2.0 contours plotted (Hayes, 2018), which are contours that represent the depth to the subduction zone fault. These are mostly based upon seismicity. The depths of the earthquakes have considerable error and do not all occur along the subduction zone faults, so these slab contours are simply the best estimate for the location of the fault.
- In the map below, I include a transparent overlay of the magnetic anomaly data from EMAG2 (Meyer et al., 2017). As oceanic crust is formed, it inherits the magnetic field at the time. At different points through time, the magnetic polarity (north vs. south) flips, the north pole becomes the south pole. These changes in polarity can be seen when measuring the magnetic field above oceanic plates. This is one of the fundamental evidences for plate spreading at oceanic spreading ridges (like the Gorda rise).
- Regions with magnetic fields aligned like today’s magnetic polarity are colored red in the EMAG2 data, while reversed polarity regions are colored blue. Regions of intermediate magnetic field are colored light purple.
- We can see the roughly east-west trends of these red and blue stripes. These lines are parallel to the ocean spreading ridges from where they were formed. The stripes disappear at the subduction zone because the oceanic crust with these anomalies is diving deep beneath the Sunda plate (part of Eurasia), so the magnetic anomalies from the overlying Sunda plate mask the evidence for the Australia plate.
Magnetic Anomalies
- In the upper right corner is a generalized plate tectonic map showing the major plate boundaries (Hu et al., 2016).
- In the lower right corner is a larger scale map with more details about how the relative plate motions and crustal structures in the South America plate relate to each other (Hu et al., 2016).
- In the upper right corner is a low angle oblique view of the subducting slab beneath South America (Wagner and Okal, 2019). I place a blue star in the general location of the M 8.0 temblor both on the map and on the 3-D view of the slab.
- In the lower left corner is a map and seismicity cross sections from Wagner and Okal (2019). Note how the M 8.0 is at the edge of the flat slab, where the slab starts to dip more steeply to the east..
I include some inset figures. Some of the same figures are located in different places on the larger scale map below.
- Here is the map with a century’s seismicity plotted. Note that I include 2 thrust earthquakes. What are the depths for these temblors? (use the color of the circle to help)
- While today’s M 8.0 was extensional and along this plate boundary system, there are some good examples of subduction zone earthquakes in the region as well. Here is a poster that has a summary of subduction zone earthquakes presented in this report for an earthquake on 2018.01.18.
- Below are some key posters that show additional recent and additional historic earthquakes in the region.
- 2018.04.02 M 6.8 Bolivia
- 2018.08.24 M 7.1 Peru
- 2019.02.23 M 7.5 Ecuador. This earthquake was only a couple months ago and was at a similar depth.
- This M 7.5 quake was also near the bend in the subduction zone, so possibly caused by the tension in the upper plate (just like today’s eq). If one looks closely, the strike of the slab near the M 7.5 is oriented counterclockwise compared to the slab near today’s M 8, The M 7.5 earthquake mechanism (e.g. moment tensor) is also rotated counterclockwise (northwest strike). It may not be possible to know if either (or both) of these quakes are due to bending moment extension, or down-dip slab tension.
- Also, these two earthquakes are separated by 500 km. Earthquakes this size can slip large amounts of the fault. For example, the USGS slip model suggests a fault length of about 250 km or so, with a width of 120 km or so. Given the high rate of large earthquakes (an earthquake magnitude M 7 or greater every 7 years for the past 36 years), it is reasonable to link these earthquakes using our knowledge of static triggering of earthquakes.
USGS Landslide and Liquefaction Ground Failure data products
- Below I present a series of maps that are intended to address the excellent ‘new’ products included in the USGS earthquake pages: landslide probability and liquefaction susceptibility (a.k.a. the Ground Failure data products).
- First I present the landslide probability model. This is a GIS data product that relates a variety of factors to the probability (the chance of) landslides as triggered by this earthquake. There are a number of assumptions that are made in order to be able to produce this model across such a large region, though this is still of great value (like other aspects from teh USGS, e.g. the PAGER alert). Learn more about all of these Ground Failure products here.
- There are many different ways in which a landslide can be triggered. The first order relations behind slope failure (landslides) is that the “resisting” forces that are preventing slope failure (e.g. the strength of the bedrock or soil) are overcome by the “driving” forces that are pushing this land downwards (e.g. gravity). I spend more time discussing landslides and liquefaction in this recent earthquake report.
- This model, like all landslide computer models, uses similar inputs. I review these here:
- Some information about ground shaking. Often, people use Peak Ground Acceleration, though in the past decade+, it has been recognized that the parameter “Arias Intensity” is a better measure of the energy imparted by the earthquake across the land and seascape. Instead of simply accounting for the peak accelerations, AI integrates the entire energy (duration) during the earthquake. That being said, PGA is a more common parameter that is available for people to use. For example, when I was modeling slope stability for the 2004 Sumatra-Andaman subduction zone earthquake, the only model that was calibrated to observational data were in units of PGA. The first order control to shaking intensity (energy observed at any particular location) is distance to the earthquake fault that slipped.
- Some information about the strength of the materials (e.g. angle of internal friction (the strength) and cohesion (the resistance).
- Information about the slope. Steeper slopes, with all other things being equal, are more likely to fail than are shallower slopes. Think about skiing. Beginners (like me) often choose shallower slopes to ski because they will go down the slope slower, while experts choose steeper slopes.
- Areas that are red are more likely to experience landslides than areas that are colored blue. I include a coarse resolution topographic/bathymetric dataset to help us identify where the mountains are relative to the coastal plain and continental shelf (submarine). Note the blue line is the shoreline and that North is to the left. The M=7.5 epicenter is the green dot to the east of the mountains.
- Landslide ground shaking can change the Factor of Safety in several ways that might increase the driving force or decrease the resisting force. Keefer (1984) studied a global data set of earthquake triggered landslides and found that larger earthquakes trigger larger and more numerous landslides across a larger area than do smaller earthquakes. Earthquakes can cause landslides because the seismic waves can cause the driving force to increase (the earthquake motions can “push” the land downwards), leading to a landslide. In addition, ground shaking can change the strength of these earth materials (a form of resisting force) with a process called liquefaction.
- Sediment or soil strength is based upon the ability for sediment particles to push against each other without moving. This is a combination of friction and the forces exerted between these particles. This is loosely what we call the “angle of internal friction.” Liquefaction is a process by which pore pressure increases cause water to push out against the sediment particles so that they are no longer touching.
- An analogy that some may be familiar with relates to a visit to the beach. When one is walking on the wet sand near the shoreline, the sand may hold the weight of our body generally pretty well. However, if we stop and vibrate our feet back and forth, this causes pore pressure to increase and we sink into the sand as the sand liquefies. Or, at least our feet sink into the sand.
- Below is the liquefaction susceptibility map. I discuss liquefaction more in my earthquake report on the 28 September 20018 Sulawesi, Indonesia earthquake, landslide, and tsunami here.
- Something else that is cool about the liquefaction map is we can see where the river valleys are. These regions have a higher liq. susc. because they are (1) closer to the earthquake and (2) they are composed of materials that are more susceptible to liquefaction (e.g. sediment rather than bedrock).
- Here is a map that shows shaking intensity using the MMI scale (mentioned and plotted in the main earthquake poster maps). I present this here in the same format as the ground failure model maps so we can compare these other maps with the ground shaking model (which is a first order control on slope failure).
- Let’s compare the MMI map below with the liquefaction susc. map. What might we conclude may be the largest factor for the landscape being susceptible to liquefaction?
- Check out how the liquefaction map more directly resembles this MMI map, than the landslide map. In this case, my interpretation is that for the landslide model, slope is a larger controlling factor than ground shaking (though still a major factor).
- And to answer my question, you were correct, liquefaction appears to be more highly controlled by ground shaking intensity.
UPDATE: 2019.05.27
- I prepared an interpretive poster that shows a comparison of the impact for two similar and different earthquakes in the region. I compare the ground shaking from the 2019.02.22 M 7.5 and the 2019.05.26 M 8.0 earthquakes.
- Both quakes are in a similar position along the Nazca plate, with extensional mechanisms near the hingeline between flat subduction and steeper dipping subduction.
- The M 7.5 temblor is deeper at 145 km, compared tot he M 8.0 with a depth of 110 km.
- I provide map and attenuation relation comparisons on the left and map view comparisons on the right.
- The maps on the left show the results of intensity modeling done by the USGS, called shakemaps. These models are based on the knowledge we have about how shaking intensity decreases with distance from the earthquake. These attenuation relations are often called “Ground Motion Prediction Equations” (GMPE for short).
- Below the maps are the plots that show these GMPE models used to make the shakemaps above. The orange and green lines are the predictive lines for ground shaking in sedimentary bedrock (e.g. California, green) and crystalline bedrock (e.g. central and eastern USA, orange).
- The dots are intensity values as reported by people who submitted their observations via the USGS “did you feel it?” website. Green dots are individual values, and teh larger dots and whisker bars are the average values, with 1 sigma uncertainty (the error bars).
- I placed a gray rectangle showing the range of MMI reported for the M 7.5 to allow us to easily compare with the M 8.
- The maps on the right include DYFI reported data (the circles, with diameters representing the number of reports) as well as the USGS model of shaking intensity (the transparent polygons and lines, labeled relative to their MMI value).
- Note how much farther DYFI reports were sourced (both on the maps and the plots on the left). The M 8.0 was felt over 2,000 km away from teh quake.
- Here is a map that shows the impact from this event. This is from Copernicus at the European Union. This map was tweeted in a tweet linked below.
- IRIS prepares excellent visualizations for earthquakes such as this M 8.0.
- Below is a visualization that shows how seismic waves were transmitted through the Earth following the M 8.0 earthquake.
- Here is an updated interpretive poster, still with a century’s seismicity plotted. However, I added more historic earthquakes (including 2 notable megathrust quakes in 2001 and 2007). I added different inset figures, listed below.
- In the upper right corner is a map that shows an interpretation of different subducting slabs beneath the South America plate (Ramos & Folguera, 2009).
- In the lower right corner is a map that shows the age of the oceanic lithosphere for the Nazca plate (Capitanio et al., 2011).
- On the left margin is a series of figures from Kirby et al., 1995. The upper panel is a map showing historic seismicity and some representative earthquake mechanisms. Their paper focused on the deep earthquakes in the northern, western jog, and southern groups. Yesterday’s M 8.0 was up-dip of the northern group.
- In the two lower panels are plots of seismicity in cross-sectional view (east-west on top and north-south on bottom). I label the locations for different types of earthquakes (megathrust subduction zone, crustal, intermediate depth, and deep earthquakes). The 1921-22 and 1970 quakes are labeled here (as well as the 1994 M 8.2).
- There have been a series of couplets, large magnitude earthquakes closely spaced in place and time, in this region. About a month spanned a doublet in 1921-22, and less than a day for quakes in 2015. One might consider a pair of M~7 quakes in 1989/90. It seems possible that either yesterday’s M 8.0 was in a region of increased static stress (??) following the 2019.02.22 M 7.5. It also seems possible that there may be an additional earthquake in this region. We won’t know until it happens.
- I also included the USGS slip models for these 2 2019 temblors. These are placed roughly relative to the online USGS maps for these slip models. Note the large difference in fault size for these 2 quakes; the M 8 slipped a much larger fault than the M 7.5 slipped.
Some Relevant Discussion and Figures
- This is the Hu et al. (2016) tectonic map. Note the slab contours and how they help us understand the shape of the downgoing Nazca plate.
Geological setting of South America with depth contours of slab 1.0 (Hayes et al., 2012)indicated by thin black lines, subducting oceanic plateaus translucent gray and continental cratons translucent white. The major flat slabs in South America are outlined with thick black lines. The locations of oceanic plateaus, cratons and flat slabs are modified from Gutscher et al.(2000), Loewy et al.(2004)and Ramos and Folguera (2009), respectively. The present-day plate motion is shown as black arrows. Tooth-shaped line represents the South American trench. Seafloor ages to the west of South America are shown with colorful lines with numbers indicating the age in Ma.
- Here is a more detailed tectonic map from Wagner and Okal (2019) that shows seismicity plotted relative to depth (color). The slab contours are also plotted.
Map of South American seismicity and Holocene volcanism. Red triangles indicate Holocene volcanism from the Global Volcanism Project (2013). Circles indicate earthquakes from Jan 1990 to Jan 2015 listed in the Reviewed International Seismological Centre On-line Bulletin (2015) with magnitudes > 4 and depths > 70 km. Orange box shows Pucallpa nest described in this study. Yellow boxes show other nests: the Bucaramanga nest in Colombia and the Pipanaco nest in Argentina. The faded black lines show slab contours from Slab 2.0 (Hayes et al., 2018). The faded blue lines show slab contours from Cahill and Isacks (1992). The black arrow offshore shows relative Nazca-South America plate motion from Altamimi et al. (2016).
- Here is an animation from IRIS that reviews the tectonics of the Peru-Chile subduction zone. For the animation, first is a screen shot and below that is the embedded video. This animation is from IRIS. Written and directed by Robert F. Butler, University of Portland. Animation and Graphics: Jenda Johnson, geologist. Consultant: Susan Beck, University or Arizona. Narration: Elayne Shapiro, University of Portland.
- Here is a download link for the embedded video below (34 MB mp4)
- The Rhea et al. (2016) document is excellent and can be downloaded here. The USGS prepared another cool poster that shows the seismicity for this region (though there does not seem to be a reference for this).
- This is a great visualization from Dr. Laura Wagner. This shows how the downgoing Nazca plate is shaped, based upon their modeling.
- Here are some cross sections that show the geometry of the slab, as modeled by Hu et al. (2016). Cross section C is almost exactly where the 01 March 2019 M 7.0 and 9 June 1994 M 8.2 earthquakes are.
Cross sections of the best-fit model from 5◦to 30◦S at an interval of 5◦. Orange arrows mark the location of these cross sections. In each cross section, background color represents the temperature field with the yellow lines indicating the interpolated Benioff zone from slab 1.0(Hayes et al., 2012). Gray circles represent the locations of earthquakes with magnitude >4.0 from IRIS earthquake catalog for years from 1970 to 2015. Black lines above each cross section delineate the topography, with the vertical scale amplified by 20 times. Note the overall match of the slab geometry to both individual seismicity and slab 1.0 contour.
- Here is an alternate view of the Nazca slab from Yepes et al. (2016).
Slab bending depicted as a hypothetical contorted surface. The drawings represent the subduction and bending of Farallon and Nazca plates from three different perspectives. The margin convexity (concavity from the perspective of the continental plate) forces the slab to flex and shorten at depth which accumulates stresses in most strained areas. Present-day position of the Grijalva rifted margin at the trench coincides with a noticeable inflection point of the trench axis (in red). A horizontal grid has been added to help visualize the plates dipping angles. A transparent 100 km thick volume has been added below the contorted surface to simulate the plate, but at intermediate depths the depicted surface should be representing the plate inner section. (a) South to north perspective showing the different dipping angles of Farallon and Nazca plates. The slab depth color scale is valid for the three drawings. (b) West to east oblique perspective at approximately the same angle as Nazca plate’s dip. The contortion of the Farallon plate at depth south of the Grijalva rifted margin is clearly noticeable from this perspective. (c) East to west perspective. Intermediate depth seismicity (50–300 km) from the instrumental catalog [Beauval et al., 2013] is drawn at the reported hypocentral depth. Two areas of maximum strain in the Farallon plate are shown (hachured): the El Puyo seismic cluster (SC) and the 100–130 km depth stretch of high moment release seismicity related to a potential hinge in the subducting plate. Lack of seismicity in the Nazca plate is explained due to the fact that this young plate, even though it is also strained, is too hot for brittle rupture.
- Here are the seismicity cross sections from Wagner and Okal (2019). Today’s M 8.0 (as plotted in the interpretive posters) is at the location in the Nazca slab where it bends. The M 8 is in the upper slab, where there would be extension from this bending.
Map of Pucallpa Nest with focal mechanisms and cross sections. Top: map view: circles show seismicity (same as Fig. 2) along with focal mechanisms from the Global CMT catalog (Dziewonski et al., 1981; Ekström et al., 2012). The red contours are our proposed slab geometry in 50 km increments. Teal outlined shape is the projected location of the subducted Nazca Ridge based on its conjugate Tuamotu Plateau on the Pacific plate (Hampel, 2002). The dark blue outlined shape is the subducted Inca Plateau based on the location of its conjugate, the Marquesas Plateau (Rosenbaum et al., 2005). The pink shaded region shows the location of the Shira Mountains (Hermoza et al., 2006). Cross sections have earthquakes and focal mechanisms projected onto the transect from within the boxes outlined on the map. For all cross sections, the red line is the proposed slab geometry shown in red contours and in Fig. 7 – the solid red line indicates the slab geometry determined from PULSE studies (e.g. Antonijevic et al., 2015, 2016; Kumar et al., 2016; Bishop et al., 2017) and the dashed red line indicates the slab geometry inferred in the present study. The dashed black line is the slab from Cahill and Isacks (1992). The blue line is the slab from Slab2.0 (Hayes et al., 2018). The black line above the depth profiles on each cross section shows topography/bathymetry in km. Middle: Cross-section A–A′ through the NNW-SSE trending arm of the Pucallpa Nest. T-axes are uniformly down-dip, roughly parallel to the dip of the proposed slab geometry. Bottom: Cross-section B–B′ is parallel to the WSW-ENE arm of the Pucallpa Nest. Focal mechanisms on this segment are more variable. The inverted red triangle on the topography profile shows the location of the Agua Caliente Oil Field and Boiling River. Cross-section C–C′ is parallel to the NNW-SSE arm of the Pucallpa Nest.
- This is the updated 3-D view of the slab from Wagner and Okal (2019).
3D image of slab seismicity and possible slab geometry surrounding the Pucallpa Nest. Cubes show event location for seismicity>70 km depth from the RISC 1990–2015. Squares on underlying and overlying topographic maps show projections of the same events. Slab geometry south of ~9°S is constrained by seismic stations of the PULSE deployment (see Fig. 2). Slab geometry proposed here for areas further north is based on RISC event locations and focal mechanisms.
Geologic Fundamentals
- For more on the graphical representation of moment tensors and focal mechnisms, check this IRIS video out:
- Here is a fantastic infographic from Frisch et al. (2011). This figure shows some examples of earthquakes in different plate tectonic settings, and what their fault plane solutions are. There is a cross section showing these focal mechanisms for a thrust or reverse earthquake. The upper right corner includes my favorite figure of all time. This shows the first motion (up or down) for each of the four quadrants. This figure also shows how the amplitude of the seismic waves are greatest (generally) in the middle of the quadrant and decrease to zero at the nodal planes (the boundary of each quadrant).
- Here is another way to look at these beach balls.
The two beach balls show the stike-slip fault motions for the M6.4 (left) and M6.0 (right) earthquakes. Helena Buurman's primer on reading those symbols is here. pic.twitter.com/aWrrb8I9tj
— AK Earthquake Center (@AKearthquake) August 15, 2018
- There are three types of earthquakes, strike-slip, compressional (reverse or thrust, depending upon the dip of the fault), and extensional (normal). Here is are some animations of these three types of earthquake faults. The following three animations are from IRIS.
Strike Slip:
Compressional:
Extensional:
- This is an image from the USGS that shows how, when an oceanic plate moves over a hotspot, the volcanoes formed over the hotspot form a series of volcanoes that increase in age in the direction of plate motion. The presumption is that the hotspot is stable and stays in one location. Torsvik et al. (2017) use various methods to evaluate why this is a false presumption for the Hawaii Hotspot.
- Here is a map from Torsvik et al. (2017) that shows the age of volcanic rocks at different locations along the Hawaii-Emperor Seamount Chain.
- Here is a great tweet that discusses the different parts of a seismogram and how the internal structures of the Earth help control seismic waves as they propagate in the Earth.
A cutaway view along the Hawaiian island chain showing the inferred mantle plume that has fed the Hawaiian hot spot on the overriding Pacific Plate. The geologic ages of the oldest volcano on each island (Ma = millions of years ago) are progressively older to the northwest, consistent with the hot spot model for the origin of the Hawaiian Ridge-Emperor Seamount Chain. (Modified from image of Joel E. Robinson, USGS, in “This Dynamic Planet” map of Simkin and others, 2006.)
Hawaiian-Emperor Chain. White dots are the locations of radiometrically dated seamounts, atolls and islands, based on compilations of Doubrovine et al. and O’Connor et al. Features encircled with larger white circles are discussed in the text and Fig. 2. Marine gravity anomaly map is from Sandwell and Smith.
Today, on #SeismogramSaturday: what are all those strangely-named seismic phases described in seismograms from distant earthquakes? And what do they tell us about Earth’s interior? pic.twitter.com/VJ9pXJFdCy
— Jackie Caplan-Auerbach (@geophysichick) February 23, 2019
- 2010.02.27 M 8.8 Earthquake Review
- 2019.05.26 M 8.0 Peru
- 2019.05.12 M 6.1 Panama
- 2019.03.01 M 7.0 Peru
- 2019.02.22 M 7.5 Ecuador
- 2019.01.20 M 6.7 Chile
- 2018.08.21 M 7.3 Venezuela
- 2018.08.24 M 7.1 Peru
- 2018.04.02 M 6.8 Bolivia
- 2018.01.14 M 7.1 Peru
- 2018.01.15 M 7.1 Peru Update #1
- 2017.06.30 M 6.0 Ecuador
- 2017.04.24 M 6.9 Chile
- 2017.04.23 M 5.9 Chile
- 2016.12.25 M 7.6 Chile
- 2016.11.24 M 7.0 El Salvador
- 2016.11.04 M 6.4 Maule, Chile
- 2016.04.16 M 7.8 Ecuador
- 2016.04.16 M 7.8 Ecuador Update #1
- 2015.11.29 M 5.9 Argentina
- 2015.11.11 M 6.9 Chile
- 2015.11.24 M 7.6 Peru
- 2015.11.26 M 7.6 Peru Update
- 2015.09.16 M 8.3 Chile
- 2014.04.01 M 8.2 Chile
- 2010.02.27 M 8.8 Chile
- 1960.05.22 M 9.5 Chile
Chile | South America
General Overview
Earthquake Reports
Social Media
— Jason "Jay" R. Patton (@patton_cascadia) May 26, 2019
interesting… pic.twitter.com/VPiB0bLbCQ
— Cenk YALTIRAK (@CYaltirak) May 26, 2019
— Jason "Jay" R. Patton (@patton_cascadia) May 27, 2019
UPDATE 2019.05.27
#ERCC #DailyMap: 2019-05-27 ⦙ Peru | 8.0 M Earthquake of 26 May 2019 ▸https://t.co/MQ0fKG8FDW pic.twitter.com/34UGFWqo1D
— Copernicus EMS (@CopernicusEMS) May 27, 2019
— Jason "Jay" R. Patton (@patton_cascadia) May 27, 2019
#SismoEnLoreto: La clave es la profundidad <– con la participación de @DocTerremoto https://t.co/ohqaAX8zLx vía @elcomercio_peru
— Bruno Ortiz B. (Blogdenotas) (@blogdenotas) May 27, 2019
Self-reactivated rupture during the 2019 Mw = 8 northern Peru intraslab earthquake https://t.co/gpGCv0CMS7
— Baoning Wu (@BaoningWu) November 12, 2022
- Antonijevic, S.K., et a;l., 2015. The role of ridges in the formation and longevity of flat slabs in Nature, v. 524, p. 212-215, doi:10.1038/nature14648
- Bishop, B.T., Beck, S.L., Zandt, G., Wagner, L., Long, M., Knezevic Antonijevic, S., Kumar, A., and Tavera, H., 2017, Causes and consequences of flat-slab subduction in southern Peru: Geosphere, v. 13, no. 5, p. 1392–1407, doi:10.1130/GES01440.1.
- Chlieh, M. Mothes, P.A>, Nocquet, J-M., Jarrin, P., Charvis, P., Cisneros, D., Font, Y., Color, J-Y., Villegas-Lanza, J-C., Rolandone, F., Vallée, M., Regnier, M., Sogovia, M., Martin, X., and Yepes, H., 2014. Distribution of discrete seismic asperities and aseismic slip along the Ecuadorian megathrust in Earth and Planetary Science Letters, v. 400, p. 292–301
- Frisch, W., Meschede, M., Blakey, R., 2011. Plate Tectonics, Springer-Verlag, London, 213 pp.
- Hayes, G., 2018, Slab2 – A Comprehensive Subduction Zone Geometry Model: U.S. Geological Survey data release, https://doi.org/10.5066/F7PV6JNV.
- Kumar, A., et al., 2016. Seismicity and state of stress in the central and southern Peruvian flat slab in EPSL, v. 441, p. 71-80. http://dx.doi.org/10.1016/j.epsl.2016.02.023
- Meyer, B., Saltus, R., Chulliat, a., 2017. EMAG2: Earth Magnetic Anomaly Grid (2-arc-minute resolution) Version 3. National Centers for Environmental Information, NOAA. Model. doi:10.7289/V5H70CVX
- Müller, R.D., Sdrolias, M., Gaina, C. and Roest, W.R., 2008, Age spreading rates and spreading asymmetry of the world’s ocean crust in Geochemistry, Geophysics, Geosystems, 9, Q04006, doi:10.1029/2007GC001743
- Rhea, S., Hayes, G., Villaseñor, A., Furlong, K.P., Tarr, A.C., and Benz, H.M., 2010. Seismicity of the earth 1900–2007, Nazca Plate and South America: U.S. Geological Survey Open-File Report 2010–1083-E, 1 sheet, scale 1:12,000,000.
- Villegas-Lanza, J. C., M. Chlieh, O. Cavalié, H. Tavera, P. Baby, J. Chire-Chira, and J.-M. Nocquet (2016), Active tectonics of Peru: Heterogeneous interseismic coupling along the Nazca megathrust, rigid motion of the Peruvian Sliver, and Subandean shortening accommodation, J. Geophys. Res. Solid Earth, 121, 7371–7394, https://doi.org/10.1002/2016JB013080.
- Wagner, L.S., and Okal, E.A., 2019. The Pucallpa Nest and its constraints on the geometry of the Peruvian Flat Slab in Tectonophysics, v. 762, p. 97-108, https://doi.org/10.1016/j.tecto.2019.04.021
- Yepes,H., L. Audin, A. Alvarado, C. Beauval, J. Aguilar, Y. Font, and F. Cotton (2016), A new view for the geodynamics of Ecuador: Implication in seismogenic source definition and seismic hazard assessment, Tectonics, 35, 1249–1279, https://doi.org/10.1002/2015TC003941.
References:
https://academic.oup.com/gji/article-abstract/232/1/115/6674205?redirectedFrom=fulltext
Return to the Earthquake Reports page.
This region of Earth is one of the most seismically active in the past decade plus. This morning, as I was preparing for work, I got an email notifying me of an earthquake with a magnitude M = 7.5 located near New Ireland, Papua New Guinea. I plot the seismicity from the past month, with color representing depth and diameter representing magnitude (see legend). I include earthquake epicenters from 1918-2018 with magnitudes M ≥ 3.0 in one version. There are many different ways in which a landslide can be triggered. The first order relations behind slope failure (landslides) is that the “resisting” forces that are preventing slope failure (e.g. the strength of the bedrock or soil) are overcome by the “driving” forces that are pushing this land downwards (e.g. gravity). The ratio of resisting forces to driving forces is called the Factor of Safety (FOS). We can write this ratio like this: FOS = Resisting Force / Driving Force When FOS > 1, the slope is stable and when FOS < 1, the slope fails and we get a landslide. The illustration below shows these relations. Note how the slope angle α can take part in this ratio (the steeper the slope, the greater impact of the mass of the slope can contribute to driving forces). The real world is more complicated than the simplified illustration below.
Nowicki Jessee and others (2018) is the preferred model for earthquake-triggered landslide hazard. Our primary landslide model is the empirical model of Nowicki Jessee and others (2018). The model was developed by relating 23 inventories of landslides triggered by past earthquakes with different combinations of predictor variables using logistic regression. The output resolution is ~250 m. The model inputs are described below. More details about the model can be found in the original publication. We modify the published model by excluding areas with slopes <5° and changing the coefficient for the lithology layer "unconsolidated sediments" from -3.22 to -1.36, the coefficient for "mixed sedimentary rocks" to better reflect that this unit is expected to be weak (more negative coefficient indicates stronger rock).To exclude areas of insignificantly small probabilities in the computation of aggregate statistics for this model, we use a probability threshold of 0.002.
Zhu and others (2017) is the preferred model for liquefaction hazard. The model was developed by relating 27 inventories of liquefaction triggered by past earthquakes to globally-available geospatial proxies (summarized below) using logistic regression. We have implemented the global version of the model and have added additional modifications proposed by Baise and Rashidian (2017), including a peak ground acceleration (PGA) threshold of 0.1 g and linear interpolation of the input layers. We also exclude areas with slopes >5°. We linearly interpolate the original input layers of ~1 km resolution to 500 m resolution. The model inputs are described below. More details about the model can be found in the original publication.
Tectonic setting and mineral deposits of eastern Papua New Guinea and Solomon Islands. The modern arc setting related to formation of the mineral deposits comprises, from west to east, the West Bismarck arc, the New Britain arc, the Tabar-Lihir-Tanga-Feni Chain and the Solomon arc, associated with north-dipping subduction/underthrusting at the Ramu-Markham fault zone, New Britain trench and San Cristobal trench respectively. Arrows denote plate motion direction of the Australian and Pacific plates. Filled triangles denote active subduction. Outlined triangles denote slow or extinct subduction. NBP: North Bismarck plate; SBP: South Bismarck plate; AT: Adelbert Terrane; FT: Finisterre Terrane; RMF: Ramu-Markham fault zone; NBT: New Britain trench.
3-D model of the Solomon slab comprising the subducted Solomon Sea plate, and associated crust of the Woodlark Basin and Australian plate subducted at the New Britain and San Cristobal trenches. Depth is in kilometres; the top surface of the slab is contoured at 20 km intervals from the Earth’s surface (black) to termination of slabrelated seismicity at approximately 550 km depth (light brown). Red line indicates the locations of the Ramu-Markham Fault (RMF)–New Britain trench (NBT)–San Cristobal trench (SCT); other major structures are removed for clarity; NB, New Britain; NI, New Ireland; SI, Solomon Islands; SS, Solomon Sea; TLTF, Tabar–Lihir–Tanga–Feni arc. See text for details.
Forward tectonic reconstruction of progressive arc collision and accretion of New Britain to the Papua New Guinea margin. (a) Schematic forward reconstruction of New Britain relative to Papua New Guinea assuming continued northward motion of the Australian plate and clockwise rotation of the South Bismarck plate. (b) Cross-sections illustrate a conceptual interpretation of collision between New Britain and Papua New Guinea.
Weitin Fault, Southern New Ireland, showing trace of fault, topography and evidence used by Hohnen (1978) to tentatively suggest sinistral fault movement (after Hohnen, 1978).
a) Present day tectonic features of the Papua New Guinea and Solomon Islands region as shown in plate reconstructions. Sea floor magnetic anomalies are shown for the Caroline plate (Gaina and Müller, 2007), Solomon Sea plate (Gaina and Müller, 2007) and Coral Sea (Weissel and Watts, 1979). Outline of the reconstructed Solomon Sea slab (SSP) and Vanuatu slab (VS)models are as indicated. b) Cross-sections related to the present day tectonic setting. Section locations are as indicated. Bismarck Sea fault (BSF); Feni Deep (FD); Louisiade Plateau
Map showing onshore structures of the Gazelle Peninsula and New Ireland and those interpreted from SeaMARC II sidescan backscatter data in the Eastern Bismarck Sea. BSSL, Bismarck Sea Seismic Lineation (BSSL). SeaMARC II backscatter data from which lineations have been picked are from Taylor et al. (1991 a-c). Modified after Madsen and Lindley (1994).
Tectonic setting of Papua New Guinea and Solomon Islands. A) Regional plate boundaries and tectonic elements. Light grey shading illustrates bathymetry <2000m below sea level indicative of continental or arc crust, and oceanic plateaus. The New Guinea Orogen comprises rocks of the New Guinea Mobile Belt and the Papuan Fold and Thrust Belt; Adelbert Terrane (AT); Aure-Moresby trough (AMT); Bougainville Island (B); Bismarck Sea fault (BSF); Bundi fault zone (BFZ); Choiseul Island (C); Feni Deep (FD); Finisterre Terrane (FT); Guadalcanal Island (G); Gazelle Peninsula (GP); Kia-Kaipito-Korigole fault zone (KKKF); Lagaip fault zone (LFZ); Malaita Island (M); Manus Island (MI); New Britain (NB); New Georgia Islands (NG); New Guinea Mobile Belt (NGMB); New Ireland (NI); Papuan Fold and Thrust Belt (PFTB); Ramu-Markham fault (RMF); Santa Isabel Island (SI); Sepik arc (SA); Weitin Fault (WF); West Bismarck fault (WBF); Willaumez-Manus Rise (WMR). Arrows indicate rate and direction of plate motion of the Australian and Pacific plates (MORVEL, DeMets et al., 2010); B) Pliocene-Quaternary volcanic centres and magmatic arcs related to this study. Figure modified from Holm et al. (2016). Subduction zone symbols with filled pattern denote active subduction; empty symbols denote extinct subduction zone or negligible convergence.
Selected tectonic reconstructions and mineral deposit formation for key areas and times within the eastern Papua New Guinea and Solomon Islands region. A) Formation of the Panguna and Fauro Island Deposits above the interpreted subducted margin of the Solomon Sea plate-Woodlark Basin, and Mase deposit above the subducting Woodlark spreading center; B) Formation of the New Georgia deposits above the subducting Woodlark spreading center, and Guadalcanal deposits above the subducting margin of the Woodlark Basin; C) Formation of the Solwara deposits related to transtension along the Bismarck Sea fault above the subducting Solomon Sea plate, and deposits of the Tabar- Lihir-Tanga-Feni island arc chain related to upper plate extension (normal faulting indicated by hatched linework between New Ireland and Bougainville), while the Ladolam deposit forms above a tear in the subducting slab. Interpreted Solomon Sea slab (light blue shaded area for present-day) is from Holm and Richards (2013); the reconstructed surface extent or indicative trend of slab structure is indicated by the dashed red lines. Green regions denote the present-day landmass using modern coastlines; grey regions are indicative of crustal extent using the 2000m bathymetric contour. The reconstruction is presented here relative to the global moving hotspot reference frame, please see the reconstruction files in the supplementary material for specific reference frames.
The two beach balls show the stike-slip fault motions for the M6.4 (left) and M6.0 (right) earthquakes. Helena Buurman's primer on reading those symbols is here. pic.twitter.com/aWrrb8I9tj — AK Earthquake Center (@AKearthquake) August 15, 2018
Strike Slip: A cutaway view along the Hawaiian island chain showing the inferred mantle plume that has fed the Hawaiian hot spot on the overriding Pacific Plate. The geologic ages of the oldest volcano on each island (Ma = millions of years ago) are progressively older to the northwest, consistent with the hot spot model for the origin of the Hawaiian Ridge-Emperor Seamount Chain. (Modified from image of Joel E. Robinson, USGS, in “This Dynamic Planet” map of Simkin and others, 2006.)
Hawaiian-Emperor Chain. White dots are the locations of radiometrically dated seamounts, atolls and islands, based on compilations of Doubrovine et al. and O’Connor et al. Features encircled with larger white circles are discussed in the text and Fig. 2. Marine gravity anomaly map is from Sandwell and Smith.
Today, on #SeismogramSaturday: what are all those strangely-named seismic phases described in seismograms from distant earthquakes? And what do they tell us about Earth’s interior? pic.twitter.com/VJ9pXJFdCy — Jackie Caplan-Auerbach (@geophysichick) February 23, 2019
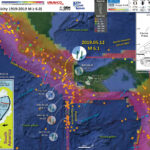
There was just now an earthquake beneath Panamá. The major plate boundary in the region is a subduction zone (convergent plate boundary) where the Cocos and Nazca plates dive northwards beneath the Caribbean plate forming the Middle America trench (MAT). I plot the seismicity from the past month, with color representing depth and diameter representing magnitude (see legend). I include earthquake epicenters from 1918-2018 with magnitudes M ≥ 3.0 in one version.
Gala´pagos Islands and hotspot tracks (Cocos, Coiba, Malpelo, and Carnegie Ridges), igneous complexes in Central America with Gala´pagos geochemical affinities, and western portion of Caribbean plate. Is. is Island, S.C. is spreading
Map of southern Central America (dark shading) and the Panama microplate (pale shading). Darien is picked out in pale shading. Dashed lines with teeth mark zones of convergence; zippered line is Panama-Colombia suture. Very heavy dashed line marks location of Neogene volcanic arc; black circles mark Paleogene-Eocene volcanic arc. NPDB – North Panama deformed belt; SPDB – South Panama deformed belt; PFZ – Panama fracture zone. Principal Neogene sedimentary basins located by striped ovals.
Crustal structure between Malpelo and Panama, showing 1965 to 1975 epicenters (defining present plate boundaries), magnetic anomalies, tracks of profiles shown in Figures 6 and 8, and locations of sampling sites.
Magnetic anomalies between Malpelo and Carnegie Ridges, numbered according to time scales listed in caption of Figure 2. Note anomaly 5 to 5B sequence along long 81°W, mirrored around extinct Malpelo rift spreading center at lat 1°40’N. Magnetic anomalies on western (Costa Rica rift) segment are from Hey and others (1977). Tracks are labeled for Conrad 11.11 (CON 11) Yaloc 69 (Y 69), Iguana 3, Cocotow 2 (CCTW 2), Cocotow 3 (CCTW 3), F. Drake 3 (FD 3), and some lines of Oceanographer 70 (OC 70). Unlabeled profiles on Costa Rica rift are from Oceanographer 69; those on Malpelo rift are from Oceanographer 70.
Profile of Cocotow 3 traverse between Malpelo and Carnegie Ridges (see Fig. 4 for location). Synthetic magnetic profile was generated using reversal time scale discussed in Figure 2 caption, spreading rates indicated at top of this figure, magnetization of 4 A/m, and magnetized layer that is 500 m thick and has an upper surface that coincides with basement relief. Note that anomaly match is poor
Tectonic reconstructions tracing inferred history of eastern Panama Basin. (A) Middle Oligocene: Farallon plate interacting with Caribbean and South American plates, just before splitting into Nazca and Cocos plates. (B) Middle Miocene: Malpelo and Carnegie Ridges are being formed by hot spot centered on Nazca plate near axis of Nazca-Cocos spreading and are being continuously separated by spreading at boundary. (C) Late Miocene: slowdown of spreading on Malpelo rift, rejuvenation of fracture zone at long 83°W, and cessation of subduction at Panama Trench. (D) Early Pliocene: continued northward migration of Cocos Ridge, stagnation of Malpelo Ridge, and uplift of Coiba Ridge near Nazca-Cocos-Caribbean triple junction. (E) Pleistocene: Cocos and Carnegie Ridges have just arrived at Middle America and Ecuador Trenches, and triple junction has jumped west from Coiba to Panama fracture zone.
Overview of the eastern Panama Basin (modified from Meschede et al., 1998). Numbers indicate the ages of oceanic crust. The distribution of extinct spreading systems is from Meschede et al. (1998). CNS = Cocos-Nazca spreading system. RSB = rough/smooth boundary.
Map depicting lhe southwestern Panama continental manin and lhe Panama-Coiba Fracture Zone wilh some of its characteristic focal mechanisms.
Interpretation of the pattern of crustal isochrons (Hardy 1991; Lonsdale 2005) and plate boundaries in the Panama Basin (modified from Lonsdale 2005). Earthquakes (black dots) and fault plane solution are from the Harvard University archive of centroid-moment tensor solutions. Plain lines are active spreading axis and transform faults: Costa Rica Rift (CRR) and Panama Fracture Zone (PFZ). Dashed and dotted lines are fossil spreading axis and transform faults: Buenaventura Rift (BR), Malpelo Rift (MR), Coiba Fracture Zone (CFZ) and Yaquina Graben. Possible spreading activity along Sandra Rift (SR) is still in discussion.
(a) Digital elevation model of the plate tectonic setting surrounding the Cordillera de Talamanca (CT), southern Costa Rica and Cordillera Central (CC), western Panama. Tectonic plates shown are the Cocos plate (CO), Nazca plate (NZ), Caribbean plate (CA), Panama microplate (PM), with plate velocities relative to a fixed CA plate [Bird, 2003; DeMets et al., 1990; DeMets, 2001; Jin and Zhu, 2004; Kellogg and Vega, 1995]. MAT, Middle America Trench; EPR, East Pacific Rise; CNS-2, Cocos-Nazca-Spreading; PTJ, Panama Triple Junction; PFZ, Panama Fracture Zone; BFZ, Balboa Fracture Zone; CFZ, Coiba Fracture Zone; NP, Nicoya Peninsula; AG, Aguacate Range; OP, Osa Peninsula; BP, Burica Peninsula; FCTB, Fila Costeña Thrust Belt; NPDB, North Panama Deformed Belt; TV, Tisingal Volcano; IV, Irazú volcano; BV, Barú volcano; YV, La Yeguada volcano; EV, El Valle volcano. Bathymetric data supplied by ETOPO1 combined from Amante and Eakins [2009], Smith and Sandwell [1997], and Ranero et al. [2003]. Topography supplied by CGIR-CSI based on NASA’s SRTM4 data set. White triangles indicate active volcanoes. Yellow dashed lines indicate on-land projection of Cocos Ridge boundaries. (b) Inset showing location of Figure 1a based on ETOPO1 data. SA refers to the South American plate. (c) Velocity triangle for Panama Triple Junction. CR represents the axis of the Cocos Ridge. Red lines denote the PM-CO and PM-NZ vectors, respectively. Numbers shown are in mm/yr.
Map of southern Central America, showing plate tectonic setting surrounding the Panama triple junction (PTJ) and Barú Volcano based on a stable Caribbean plate (DeMets et al., 1990; Kellogg and Vega, 1995; DeMets, 2001; Bird, 2003). MAT—Middle America Trench; CO—Cocos plate; NZ—Nazca plate; CA— Caribbean plate; PM—Panama micro plate; PTJ—Panama triple junction; PFZ—Panama fracture zone; BFZ—Balboa fracture zone; CFZ—Coiba fracture zone; TV—Tisingal Volcano; OP—Osa Peninsula; BP—Burica Peninsula; VG— Valle General. Elevations are based on National Aeronautics and Space Administration’s (NASA) SRTM v4 imagery. Bathymetry is combined from ETOPO1 and Ranero et al. (2003). Thrusts and shortening estimates outlined for Fila Costeña thrust belt are combined from Sitchler et al. (2007), Fisher et al. (2004), and Morell et al. (2008). Fault traces on Burica Peninsula are from Morell et al. (2011a) and back arc is from Brandes et al. (2007). Contour interval for bathymetry is 250 m.
Map of normalized steepness (ksn) values calculated over a 0.5 km window for drainage basins >107 m2 and excluding valley bottoms for Cordillera de Talamanca and western Cordillera Central. Numbers in northeastern flank of Talamanca correspond to knickpoint numbers shown in Table 2. The locations of longitudinal profiles in Figure 7 are marked as A, B and C, respectively. Faults shown in the Fila Costeña are based on Fisher et al. [2004], Morell et al. [2008], and Sitchler et al. [2007]. Faults drawn in the Limón back arc are approximated from topographic lineaments. Location shown in Figure 1. Base map sourced from DEM draped over slope map derived from SRTM data set. Inset in upper right is simplified geologic map for Cordillera de Talamanca region based on Denyer and Alvarado [2007].
Simplified geologic map of the southeast Fila Costeña Thrust Belt in the inner forearc of Costa Rica and western Panama (see Fig. 1 for location). Combined data from Sitchler et al. (in press) and this study, revised after Kolarsky and Mann (1995) and Mora (1979). Although the thrust belt continues to the northwest, we focus on the southeast termination. Black boxes indicate location of Figs. 3 and 5. OPFZ = On-land projection of the Panama Fracture Zone. Geology is draped on 90-m DEM supplied by NASA’s SRTM-3 dataset. Stratigraphic column modified after Sitchler et al. (in press), Phillips (1983) and Fisher et al. (2004). Inset A shows shaded DEM of area in white dotted box denoting scarps visible for right-lateral faults A and B based on SRTM-3 dataset.
Bedrock geologic map of the southeastern termination of the Fila Costeña Thrust Belt showing strike and dip measurements within thrust sheets that dip to the northeast. The southeastern termination of the thrust belt roughly coincides with the on-land projection of the Panama Fracture Zone (OPFZ, red dashed line), which is migrating to the southeast with the Panama Triple Junction. F1, F2, F3, F4, and F5 refer to thrust faults 1, 2, 3, 4 and 5, respectively. Cross-sections show locations of balanced cross-sections in Fig. 4. All fault traces and contacts are approximated. Inset index map shows figure location in red box relative to the on-land projection of the Panama Fracture Zone.
Digital elevation model [Smith and Sandwell, 1997; Amante and Eakins, 2009] showing Panama Basin and seafloor magnetic anomaly data surrounding the southern Central America subduction zone [Lonsdale and Klitgord, 1978; Wilson and Hey, 1995; Barckhausen et al., 2001; Lonsdale, 2005] based on chron time scale of Cande and Kent [1995]. The 22000 m contour is shown for prominent bathymetric features in the region, including Malpelo Ridge (MaR) and Coiba Ridge (CoR). BFZ, Balboa Fracture Zone; CFZ, Coiba Fracture Zone; CNS, Cocos-Nazca spreading center; COL, Colombia; CR, Costa Rica; EC, Ecuador; GHS, Galapagos hot spot; MR, Malpelo Rift; MAT, Middle America Trench; MoR, Morgan Rift; NI, Nicaragua; PA, Panama; PFZ, Panama Fracture Zone; SR, Sandra Rift; YG, Yaquina Graben. Inset: Present day plate boundaries of Cocos (CO), Nazca (NZ), Caribbean (CA), and South American (SA) plates. East Pacific Rise (EPR) and Cocos-Nazca Spreading Center (CNS) are also shown.
Plate reconstruction models for the Cocos (CO) and Nazca (NZ) plates relative to the Caribbean plate from 4 Ma to recent. BFZ, Balboa Fracture Zone; CaR, Carnegie Ridge; CFZ, Coiba Fracture Zone; CNS, crust derived from the Cocos-Nazca spreading center; CocR, Cocos Ridge; CoR, Coiba Ridge; CR, Costa Rica; EPR, crust derived from the East Pacific Rise; GH, Galapagos hot spot; MaR, Malpelo Ridge; MoR, Morgan Rift; MR, Malpelo Rift; PA, Panama; PFZ, Panama Fracture Zone; PTJ, Panama Triple Junction; RSB, rough-smooth boundary; SMD, seamount domain; SR, Sandra Ridge; YG, Yaquina Graben.
Plate reconstruction models for the Cocos and Nazca plates relative to the Caribbean plate from 6 to 10 Ma. CaR, Carnegie Ridge; CFZ, Coiba Fracture Zone; CNS, crust derived from the Cocos-Nazca spreading center; CocR, Cocos Ridge; CR, Costa Rica; EPR, crust derived from the East Pacific Rise; GH, Galapagos hot spot; MaR, Malpelo Ridge; MR, Malpelo Rift; PA, Panama; PFZ, Panama Fracture Zone; PTJ, Panama Triple Junction; SMD, seamount domain, SR, Sandra Ridge; YG, Yaquina Graben.
The two beach balls show the stike-slip fault motions for the M6.4 (left) and M6.0 (right) earthquakes. Helena Buurman's primer on reading those symbols is here. pic.twitter.com/aWrrb8I9tj — AK Earthquake Center (@AKearthquake) August 15, 2018
Strike Slip: A cutaway view along the Hawaiian island chain showing the inferred mantle plume that has fed the Hawaiian hot spot on the overriding Pacific Plate. The geologic ages of the oldest volcano on each island (Ma = millions of years ago) are progressively older to the northwest, consistent with the hot spot model for the origin of the Hawaiian Ridge-Emperor Seamount Chain. (Modified from image of Joel E. Robinson, USGS, in “This Dynamic Planet” map of Simkin and others, 2006.)
Hawaiian-Emperor Chain. White dots are the locations of radiometrically dated seamounts, atolls and islands, based on compilations of Doubrovine et al. and O’Connor et al. Features encircled with larger white circles are discussed in the text and Fig. 2. Marine gravity anomaly map is from Sandwell and Smith.
Today, on #SeismogramSaturday: what are all those strangely-named seismic phases described in seismograms from distant earthquakes? And what do they tell us about Earth’s interior? pic.twitter.com/VJ9pXJFdCy — Jackie Caplan-Auerbach (@geophysichick) February 23, 2019
Mw=6.0, PANAMA-COSTA RICA BORDER REGION (Depth: 19 km), 2019/05/12 19:24:52 UTC – Full details here: https://t.co/cFrxlyVq2B pic.twitter.com/lJjmebILn7 — Earthquakes (@geoscope_ipgp) May 12, 2019 strong #earthquake in #Costa #Rica, also felt in #Panama @ShakingEarth pic.twitter.com/UDHCy9YDct — CATnews | Andreas M. Schäfer (@CATnewsDE) May 12, 2019 #Update: Video of beaches and the coast line in #CostaRica shows the 6,5M earthquake, making cracks and shaking layers upon layers of sand. And where the most damage is expected to be in #Panama. pic.twitter.com/gfzLK8YE2t — Sotiri Dimpinoudis ❁ (@sotiridi) May 12, 2019 EARTHQUAKE IN PANAMA: Some damages reported in Chiriqui region. #Panama #Earthquake #Temblor pic.twitter.com/fymkt7q9Hu — Earthquakes World (@Terremoti7) May 12, 2019 #panama earthquake aftermath. pic.twitter.com/YuGHI6LrZC — Shan Nayak (@ShanNayakk) May 12, 2019 Map of historical seismicity in the area around today's M6.1 Panama – Costa Rica border earthquake, an area of significant crustal strike-slip activity, in addition to a subduction zone pic.twitter.com/oTnnjv3ACj — Jascha Polet (@CPPGeophysics) May 13, 2019
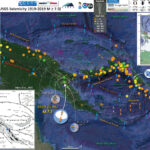
Earlier today, there was an intermediate depth beneath eastern Papua New Guinea (PNG). With a magnitude M = 7.2, this is one of the largest earthquake so far in 2019. Here is the USGS website for this earthquake. I plot the seismicity from the past month, with color representing depth and diameter representing magnitude (see legend). I include earthquake epicenters from 1918-2018 with magnitudes M ≥ 3.0 in one version.
Topography, bathymetry and regional tectonic setting of New Guinea and Solomon Islands. Arrows indicate rate and direction of plate motion of the Australian and Pacific plates (MORVEL, DeMets et al., 2010); Mamberamo thrust belt, Indonesia (MTB); North Fiji Basin (NFB)
Tectonic map of New Guinea, adapted from Hamilton (1979), Cooper and Taylor (1987), Dow et al. (1988), and Sapiie et al. (1999). AFTB—Aure fold and thrust belt, FTB—fold-and-thrust belt, IOB—Irian Ophiolite Belt, TFB—thrust-and-fold belt, POB—Papuan Ophiolite Belt, BTFZ—Bewani-Torricelli fault zone, MDZ—Mamberamo deformation zone, YFZ—Yapen fault zone, SFZ—Sorong fault zone, WO—Weyland overthrust. Continental basement exposures are concentrated along the southern fl ank of the Central Range: BD—Baupo Dome, MA—Mapenduma anticline, DM—Digul monocline, IDI—Idenberg Inlier, MUA—Mueller anticline, KA—Kubor anticline, LFTB—Legguru fold-and-thrust belt, RMFZ—Ramu-Markham fault zone, TAFZ—Tarera-Aiduna fault zone. The Tasman line separates continental crust that is Paleozoic and younger to the east from Precambrian to the west.
Lithospheric-scale cross section at 2 Ma. Plate motion is now focused along the Yapen fault zone in the center of the recently extinct arc. This probably occurred because this zone of weakness had a trend that could accommodate the imposed movements as the corner of the Caroline microplate ruptured, forming the Bismarck plate, and the corner of the Australian plate ruptured, forming the Solomon microplate. The collisional delamination-generated magmatic event ends in the highlands as the lower crustal magma chamber solidifies. Upwelled asthenosphere cools and transforms into lithospheric mantle. This drives a slow regional subsidence of the highlands that will continue for tens of millions of years or until other plate-tectonic movements are initiated. Deep erosion is still concentrated on the fl anks of the mountain belt. RMB—Ruffaer Metamorphic Belt, AUS—Australian plate, PAC—Pacific plate.
Seismotectonic interpretation of New Guinea. Tectonic features: PTFB—Papuan thrust-and-fold belt; RMFZ—Ramu-Markham fault zone; BTFZ—Bewani-Torricelli fault zone; MTFB—Mamberamo thrust-and-fold belt; SFZ—Sorong fault zone; YFZ—Yapen fault zone; RFZ—Ransiki fault zone; TAFZ—Tarera-Aiduna fault zone; WT—Waipona Trough. After Sapiie et al. (1999).
Topography, bathymetry and major tectonic elements of the study area. (a) Major tectonic boundaries of Papua New Guinea and the western Solomon Islands; CP, Caroline plate; MB, Manus Basin; NBP, North Bismarck plate; NBT, New Britain trench; NGT, New Guinea trench; NST, North Solomon trench; PFTB, Papuan Fold and Thrust Belt; PT, Pocklington trough; RMF, Ramu-Markham Fault; SBP, South Bismarck plate; SCT, San Cristobal trench; SS, Solomon Sea plate; TT, Trobriand trough; WB,Woodlark Basin; WMT,West Melanesian trench. Study area is indicated by rectangle labelled Figure 1b; the other inset rectangle highlights location for subsequent figures. Present day GPS motions of plates are indicated relative to the Australian plate (from Tregoning et al. 1998, 1999; Tregoning 2002; Wallace et al. 2004). (b) Detailed topography, bathymetry and structural elements significant to the South Bismarck region (terms not in common use are referenced); AFB, Aure Fold Belt (Davies 2012); AT, Adelbert Terrane (e.g. Wallace et al. 2004); BFZ, Bundi Fault Zone (Abbott 1995); BSSL, Bismarck Sea Seismic Lineation; CG, Cape Gloucester; FT, Finisterre Terrane; GF, Gogol Fault (Abbott 1995); GP, Gazelle Peninsula; HP, Huon Peninsula; MB, Manus Basin; NB, New Britain; NI, New Ireland; OSF, Owen Stanley Fault; RMF, Ramu-Markham Fault; SS, Solomon Sea; WMR, Willaumez-Manus Rise (Johnson et al. 1979); WT, Wonga Thrust (Abbott et al. 1994); minor strike-slip faults are shown adjacent to Huon Peninsula (Abers & McCaffrey 1994) and in east New Britain, the Gazelle Peninsula (e.g. Madsen & Lindley 1994). Circles indicate centres of Quaternary volcanism of the Bismarck arc. Filled triangles indicate active thrusting or subduction, empty triangles indicate extinct or negligible thrusting or subduction.
3-D model of the Solomon slab comprising the subducted Solomon Sea plate, and associated crust of the Woodlark Basin and Australian plate subducted at the New Britain and San Cristobal trenches. Depth is in kilometres; the top surface of the slab is contoured at 20 km intervals from the Earth’s surface (black) to termination of slabrelated seismicity at approximately 550 km depth (light brown). Red line indicates the locations of the Ramu-Markham Fault (RMF)–New Britain trench (NBT)–San Cristobal trench (SCT); other major structures are removed for clarity; NB, New Britain; NI, New Ireland; SI, Solomon Islands; SS, Solomon Sea; TLTF, Tabar–Lihir–Tanga–Feni arc. See text for details.
Forward tectonic reconstruction of progressive arc collision and accretion of New Britain to the Papua New Guinea margin. (a) Schematic forward reconstruction of New Britain relative to Papua New Guinea assuming continued northward motion of the Australian plate and clockwise rotation of the South Bismarck plate. (b) Cross-sections illustrate a conceptual interpretation of collision between New Britain and Papua New Guinea.
Tectonic maps of the New Guinea region. (a) Seismicity, volcanoes, and plate motion vectors. Plate motion vectors relative to the Australian plate are surface velocity models based on GPS data, fault slip rates, and earthquake focal mechanisms (UNAVCO, http://jules.unavco.org/Voyager/Earth). Earthquake data are sourced from the International Seismological Center EHB Bulletin (http://www.isc.ac.uk); data represent events from January 1994 through January 2009 with constrained focal depths. Background image is generated from http://www.geomapapp.org. Abbreviations: AB, Arafura Basin; AT, Aure Trough; AyT, Ayu Trough; BA, Banda arc; BSSL, Bismarck Sea seismic lineation; BH, Bird’s Head; BT, Banda Trench; BTFZ, Bewani-Torricelli fault zone; DD, Dayman Dome; DEI, D’Entrecasteaux Islands; FP, Fly Platform; GOP, Gulf of Papua; HP, Huon peninsula; LA, Louisiade Archipelago; LFZ, Lowlands fault zone; MaT, Manus Trench; ML, Mt. Lamington; MT, Mt. Trafalgar; MuT, Mussau Trough; MV, Mt. Victory; MTB, Mamberamo thrust belt; MVF, Managalase Plateau volcanic field; NBT, New Britain Trench; NBA, New Britain arc; NF, Nubara fault; NGT, New Guinea Trench; OJP, Ontong Java Plateau; OSF, Owen Stanley fault zone; PFTB, Papuan fold-and-thrust belt; PP, Papuan peninsula; PRi, Pocklington Rise; PT, Pocklington Trough; RMF, Ramu-Markham fault; SST, South Solomons Trench; SA, Solomon arc; SFZ, Sorong fault zone; ST, Seram Trench; TFZ, Tarera-Aiduna fault zone; TJ, AUS-WDKPAC triple junction; TL, Tasman line; TT, Trobriand Trough;WD, Weber Deep;WB, Woodlark Basin;WFTB, Western (Irian) fold-and-thrust belt; WR,Woodlark Rift; WRi, Woodlark Rise; WTB, Weyland thrust; YFZ, Yapen fault zone.White box indicates the location shown in Figure 3. (b) Map of plates, microplates, and tectonic blocks and elements of the New Guinea region. Tectonic elements modified after Hill & Hall (2003). Abbreviations: ADB, Adelbert block; AOB, April ultramafics; AUS, Australian plate; BHB, Bird’s Head block; CM, Cyclops Mountains; CWB, Cendrawasih block; CAR, Caroline microplate; EMD, Ertsberg Mining District; FA, Finisterre arc; IOB, Irian ophiolite belt; KBB, Kubor & Bena blocks (including Bena Bena terrane); LFTB, Lengguru fold-and-thrust belt; MA, Mapenduma anticline; MB, Mamberamo Basin block; MO, Marum ophiolite belt; MHS, Manus hotspot; NBS, North Bismarck plate; NGH, New Guinea highlands block; NNG, Northern New Guinea block; OKT, Ok Tedi mining district; PAC, Pacific plate; PIC, Porgera intrusive complex; PSP, Philippine Sea plate; PUB, Papuan Ultramafic Belt ophiolite; SB, Sepik Basin block; SDB, Sunda block; SBS, South Bismarck plate; SIB, Solomon Islands block; WP, Wandamen peninsula; WDK, Woodlark microplate; YQ, Yeleme quarries.
Oblique block diagram of New Guinea from the northeast with schematic cross sections showing the present-day plate tectonic setting. Digital elevation model was generated from http://www.geomapapp.org. Oceanic crust in tectonic cross sections is shown by thick black-and-white hatched lines, with arrows indicating active subduction; thick gray-and-white hatched lines indicate uncertain former subduction. Continental crust, transitional continental crust, and arc-related crust are shown without pattern. Representative geologic cross sections across parts of slices C and D are marked with transparent red ovals and within slices B and E are shown by dotted lines. (i ) Cross section of the Papuan peninsula and D’Entrecasteaux Islands modified from Little et al. (2011), showing the obducted ophiolite belt due to collision of the Australian (AUS) plate with an arc in the Paleogene, with later Pliocene extension and exhumation to form the D’Entrecasteaux Islands. (ii ) Cross section of the Papuan peninsula after Davies & Jaques (1984) shows the Papuan ophiolite thrust over metamorphic rocks of AUS margin affinity. (iii ) Across the Papuan mainland, the cross section after Crowhurst et al. (1996) shows the obducted Marum ophiolite and complex folding and thrusting due to collision of the Melanesian arc (the Adelbert, Finisterre, and Huon blocks) in the Late Miocene to recent. (iv) Across the Bird’s Head, the cross section after Bailly et al. (2009) illustrates deformation in the Lengguru fold-and-thrust belt as a result of Late Miocene–Early Pliocene northeast-southwest shortening, followed by Late Pliocene–Quaternary extension. Abbreviations as in Figure 2, in addition to NI, New Ireland; SI, Solomon Islands; SS, Solomon Sea; (U)HP, (ultra)high-pressure.
Radar image of Mount Murray stratovolcano (lat. 6°45’S, long. 144°00’E)—of late Pliocene or Quaternary age—surmounting the prominent strike ridges of folded Miocene Darai Limestone. Deep erosion of the crater has exposed the intrusive core of the volcano. (Scale about 1:250 000.)
Side-looking radar image of the eastern end of the Papuan Fold Belt between Mount Murray and Mount Karimui. The prominent ridges are steeply dipping Darai Limestone which has been repeated by folding and thrust-faulting. The karst surface developed on the limestone is evident despite the very heavy jungle cover. This image was obtained with the radar looking from the south, so the image is oriented with north to the bottom of the page to prevent the viewer seeing inverted topography. (Scale about 1:250 000.)
The two beach balls show the stike-slip fault motions for the M6.4 (left) and M6.0 (right) earthquakes. Helena Buurman's primer on reading those symbols is here. pic.twitter.com/aWrrb8I9tj — AK Earthquake Center (@AKearthquake) August 15, 2018
Strike Slip: A cutaway view along the Hawaiian island chain showing the inferred mantle plume that has fed the Hawaiian hot spot on the overriding Pacific Plate. The geologic ages of the oldest volcano on each island (Ma = millions of years ago) are progressively older to the northwest, consistent with the hot spot model for the origin of the Hawaiian Ridge-Emperor Seamount Chain. (Modified from image of Joel E. Robinson, USGS, in “This Dynamic Planet” map of Simkin and others, 2006.)
Hawaiian-Emperor Chain. White dots are the locations of radiometrically dated seamounts, atolls and islands, based on compilations of Doubrovine et al. and O’Connor et al. Features encircled with larger white circles are discussed in the text and Fig. 2. Marine gravity anomaly map is from Sandwell and Smith.
Today, on #SeismogramSaturday: what are all those strangely-named seismic phases described in seismograms from distant earthquakes? And what do they tell us about Earth’s interior? pic.twitter.com/VJ9pXJFdCy — Jackie Caplan-Auerbach (@geophysichick) February 23, 2019
Earthquake Report: New Ireland
https://earthquake.usgs.gov/earthquakes/eventpage/us70003kyy/executive
There are every type of plate boundary fault in this region. There are subduction zones, such as that forms the New Britain and San Cristobal trenches. There are transform faults, such as that responsible for the M 7.5 temblor. There are also spreading ridges, such as the one that forms the Manus Basin to the northwest of today’s quake.
I interpret this M 7.5 earthquake to be a left-lateral strike slip earthquake based on (1) the USGS mechanism (moment tensor), (2) our knowledge of the faulting in the region, and (3) historic analogue earthquake examples. There was an earthquake on a subparallel strike-slip fault on 8 March 2018 (here is the earthquake report for that event). Also in that report, I discuss an earthquake from November 2000 that had a magnitude M = 8.0.
After my work on the 28 September 2018 Donggala-Palu earthquake, landslides, and tsunami, I am open minded about the possibility of strike-slip earthquakes as having tsunamigenic potential. There are actually many examples of strike-slip earthquakes causing tsunami, including the 1999 Izmit, 2012 Wharton Basin, and the 2000 New Ireland earthquake too! (see Geist and Parsons, 2005 for more about the small 2000 tsunami.) There was initially a tsunami notification from tsunami.gov about the possibility of a tsunami. Here is a great website where I usually visit when I am looking for tsunami records on tide gage data. This is the closest gage to the quake, but it is not located optimally to record a small tsunami as might have been generated today (I checked).
The Weitin fault is a very active fault, with a slip rate of about 130 mm/yr (Tregoning et al, 1999, 2005). For a comparison, the San Andreas fault has a slip rate of about 25-35 mm/year. Here is a great treatise on the SAF.
There are also examples of earthquake triggering in this region. For example, the 2000.11.16 M 8.0 strike-slip earthquake triggered the 2000.11.16 M 7.8 thrust fault earthquake. It is not unreasonable to consider it possible that there may be triggered earthquakes from this M 7.5 earthquake. Of course, we won’t know until it happens because nobody has the capability to predict earthquakes (regardless of what the charlatans may claim).
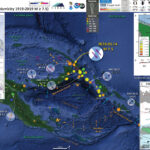
The USGS has a variety of products associated with their earthquake pages. I use many of these products in these earthquake reports, so I especially appreciate them. One of the recently added products is a landslide and a liquefaction probability model output. Based on our knowledge of how earthquake release energy, and our knowledge of how earth materials respond to this energy release, people have developed models that allow us to estimate the possibility any given region may experience landslides or liquefaction. I spent some time discussing this in the 28 Sept. 2018 Donggala-Palu earthquake report here.Below is my interpretive poster for this earthquake
I plot the USGS fault plane solutions (moment tensors in blue and focal mechanisms in orange), possibly in addition to some relevant historic earthquakes.
Magnetic Anomalies
I include some inset figures. Some of the same figures are located in different places on the larger scale map below.
M 7.5 Landslide and Liquefaction Models
Landslide ground shaking can change the Factor of Safety in several ways that might increase the driving force or decrease the resisting force. Keefer (1984) studied a global data set of earthquake triggered landslides and found that larger earthquakes trigger larger and more numerous landslides across a larger area than do smaller earthquakes. Earthquakes can cause landslides because the seismic waves can cause the driving force to increase (the earthquake motions can “push” the land downwards), leading to a landslide. In addition, ground shaking can change the strength of these earth materials (a form of resisting force) with a process called liquefaction.
Sediment or soil strength is based upon the ability for sediment particles to push against each other without moving. This is a combination of friction and the forces exerted between these particles. This is loosely what we call the “angle of internal friction.” Liquefaction is a process by which pore pressure increases cause water to push out against the sediment particles so that they are no longer touching.
An analogy that some may be familiar with relates to a visit to the beach. When one is walking on the wet sand near the shoreline, the sand may hold the weight of our body generally pretty well. However, if we stop and vibrate our feet back and forth, this causes pore pressure to increase and we sink into the sand as the sand liquefies. Or, at least our feet sink into the sand.
Below is a diagram showing how an increase in pore pressure can push against the sediment particles so that they are not touching any more. This allows the particles to move around and this is why our feet sink in the sand in the analogy above. This is also what changes the strength of earth materials such that a landslide can be triggered.
Below is a diagram based upon a publication designed to educate the public about landslides and the processes that trigger them (USGS, 2004). Additional background information about landslide types can be found in Highland et al. (2008). There was a variety of landslide types that can be observed surrounding the earthquake region. So, this illustration can help people when they observing the landscape response to the earthquake whether they are using aerial imagery, photos in newspaper or website articles, or videos on social media. Will you be able to locate a landslide scarp or the toe of a landslide? This figure shows a rotational landslide, one where the land rotates along a curvilinear failure surface.
Here is an excellent educational video from IRIS and a variety of organizations. The video helps us learn about how earthquake intensity gets smaller with distance from an earthquake. The concept of liquefaction is reviewed and we learn how different types of bedrock and underlying earth materials can affect the severity of ground shaking in a given location. The intensity map above is based on a model that relates intensity with distance to the earthquake, but does not incorporate changes in material properties as the video below mentions is an important factor that can increase intensity in places.
If we look at the map at the top of this report, we might imagine that because the areas close to the fault shake more strongly, there may be more landslides in those areas. This is probably true at first order, but the variation in material properties and water content also control where landslides might occur.
There are landslide slope stability and liquefaction susceptibility models based on empirical data from past earthquakes. The USGS has recently incorporated these types of analyses into their earthquake event pages. More about these USGS models can be found on this page.
I prepared some maps that compare the USGS landslide and liquefaction probability maps.
Other Report Pages
Some Relevant Discussion and Figures
(LP); Manus Basin (MB); New Britain trench (NBT); North Bismarck microplate (NBP); North Solomon trench (NST); Ontong Java Plateau (OJP); Ramu-Markham fault (RMF); San Cristobal trench (SCT); Solomon Sea plate (SSP); South Bismarck microplate (SBP); Trobriand trough (TT); projected Vanuatu slab (VS); West Bismarck fault (WBF); West Torres Plateau (WTP); Woodlark Basin (WB).
Here is a visualization of the seismicity as presented by Dr. Steve Hicks.
Geologic Fundamentals
Compressional:
Extensional:
New Britain | Solomon | Bougainville | New Hebrides | Tonga | Kermadec Earthquake Reports
General Overview
Earthquake Reports
Social Media
References:
Return to the Earthquake Reports page.
Earthquake Report: Panamá
This magnitude M = 6.1 earthquake appears to be associated with the transform plate boundary (strike-slip fault) that is formed between the Cocos and Nazca plates. I initially interpreted the earthquake mechanism (e.g. moment tensor) shows this to be a strike-slip earthquake along the Panamá fracture zone (PFZ). However, the earthquake is not currently deep enough according to the USGS Slab 2.0 data (that shows the depth of the megathrust subduction zone, or the top of the downgoing oceanic crust/slab). This is still possible, but it is also possible that this is in the upper plate, the Caribbean plate.
If this is in the upper plate (seems more probable), then there are several reasons for the temblor. Perhaps the PFZ is causing differential stress in the overriding plate (causing strike-slip faults to form subparallel to the PFZ and sister faults). Perhaps there is oblique relative plate motion, that is causing strain and slip partitioning in upper plate crustal faults. Perhaps there is some other complicated faulting in the upper plate that exists for some other reason (e.g. pre-existing structures inherited from the tectonic history). OR, it may be due to a combination of any of these possibilities. The fact that this earthquake (and a Christmas temblor in 2003) are aligned with the PFZ suggests that these quakes may be related to the PFZ. As Mr. Spock (Star Trek) would say, “fascinating.”
I have some early reports for quakes along this fz, though the quality of my reports have improved over time. See the May 2014 and January 2015 reports.
The Panama fracture zone (PFZ) has a few sister fracture zones, subparallel dextral (right-lateral) strike-slip faults that have been studied by looking at seismicity and structures of the seafloor. There was a series of large earthquakes in the region south of the MAT in 1934 (Camacho, 1991) ewith the largest magnitude quake at M = 7.5. Earthquakes in the magnitude 6 range are quite common for this system, with temblors M ≥ 6 over once a year.
After tweeting this report, Dr. Kristen Morell (assistant professor at U.C. Santa Barbara) pointed out to me that they did lots of work on the tectonics in the region for their Ph.D. research. I have added some figures from her work below. Morell shows that there are upper plate crustal faults that are associated with the PFZ. Dr. Morell uses a variety of methods to come to this conclusion, including geomorphology (always a great tool), fault mapping (and cross sections of thrust faults and folds), relative plate motions and reconstructions, exhumation analysis, etc. These articles are fundamental to our understanding in this region and we are lucky to have them.Below is my interpretive poster for this earthquake
I plot the USGS fault plane solutions (moment tensors in blue and focal mechanisms in orange), possibly in addition to some relevant historic earthquakes.
Magnetic Anomalies
I include some inset figures. Some of the same figures are located in different places on the larger scale map below.
Other Report Pages
Some Relevant Discussion and Figures
center.
within 50 to 100 km of Carnegie and Malpelo Ridges. Fit could have been improved by postulating a somewhat faster spreading rate for this region, but even so, we could not achieve as good a match as for central part of profile.
Geologic Fundamentals
Compressional:
Extensional:
Chile | South America
General Overview
Earthquake Reports
Social Media
References:
for the tectonic and biological evolution of the Americas in Geology, v. 30, no. 9, p. 795-798Return to the Earthquake Reports page.
Earthquake Report: Papua New Guinea
Today’s earthquake was quite deep, about 130 km. There are several ways that people have interpreted the tectonics here (which is more common than not).
PNG and New Britain are a region of convergence, where the Australia plate to the south is moving northwards to the Pacific plate (and lots of smaller plates are moving around too).
To the east is a subduction zone (convergent plate boundary) where the Solomon Sea plate dives north beneath the South Bismarck plate. I have prepared many earthquake reports for earthquakes in this region, most of them thrust (compressional) earthquakes related to subduction.
To the north of PNG is a transform plate boundary (strike-slip) that begins at the eastern boundary of the New Britain trench and extends along the north side of PNG, eventually turning into the Sorong fault, then the Palu Koro system in Sulawesi. On 28 September 2018 was an interesting earthquake and tsunami, along with some mega landslides. Here is my report for that series of events.
In the center of PNG, running east-west, is a collision zone formed by the north-south compression I mentioned above. There is a series of compressional folds and faults called the Papua Fold Belt. There have been several large quakes recently in this fold belt. Here is a report for one of those thrust earthquakes, much shallower than today’s eq.
The convergent plate boundary faults in this region have been long lived and have an interesting history. Some of the subduction zones that show up on the maps we will look at are fossil subduction zones (they are no longer active). However, just because they are not active does not mean that there are no earthquakes there. Often, earthquakes can happen along pre-existing zones of weakness. Today’s earthquake may be such a quake. It is difficult to really know.
There have been about 4 earthquakes in the area of today’s quake, with magnitudes M > 7.0. Today’s earthquake is extensional, but intermediate depth earthquakes can be of all types. The 2 quakes that have USGS mechanisms were strike-slip, but one was oblique (it was extensional and strike-slip).
Today, there was also a thrust earthquake, associated with the San Cristobal Trench (the subduction zone to the east of the New Britain trench). I did not label this subduction zone in the map below, but here is an earthquake sequence where I describe this fault zone in greater detail.
Today’s M 7.2 temblor is a cool mystery!Below is my interpretive poster for this earthquake
I plot the USGS fault plane solutions (moment tensors in blue and focal mechanisms in orange), possibly in addition to some relevant historic earthquakes.
Magnetic Anomalies
I include some inset figures. Some of the same figures are located in different places on the larger scale map below.
Other Report Pages
Some Relevant Discussion and Figures
Geologic Fundamentals
Compressional:
Extensional:
New Britain | Solomon | Bougainville | New Hebrides | Tonga | Kermadec Earthquake Reports
General Overview
Earthquake Reports
Social Media
References:
Return to the Earthquake Reports page.