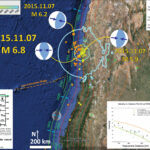
We just had an earthquake in Argentina! Here is the USGS web page for this earthquake.
At first, I thought, “oh, another deep earthquake.” I looked at the hypocentral depth The hypocenter is the 3-D location of the earthquake, while the epicenter is the map location of the earthquake. The depth was really shallow (9.6 km). I initially thought that this was a default depth, but that is typically set at 10 km (so I was unconvinced of my interpretation). I loaded the USGS kml file in google earth and plotted the MMI contours (Modified Mercalli Intensity, a measure of ground shaking intensity). The MMI contours present a great opportunity for a lesson, which I will detail below. I was refreshing the web page to see if the depth would change. It did not.
Here is a map showing the epicenter and the MMI contours. Note how there are some MMI III thin blue contours on the north side of the earthquake (plotted as an orange circle, based on depth and magnitude). These MMI III contours look like a row of “u” or “v” symbols plotted. In this area, there are a series of ridges and valleys that are formed by a fold and thrust belt. This F&T belt is the result of a back thrust related to the subduction zone. The ridges and valleys bring the ground surface further and closer to the earthquake, respectively. Ground motions from earthquakes attenuate (get absorbed and diminish) with distance from the earthquake. There are other factors that modify how ground motions are felt at Earth’s surface, but distance has a first order control on this (as evidenced by this map).
Note the earthquake at the coast to the west of today’s earthquake. This is an earthquake that plots at the southern end of the M 8.1 1995 subduction zone earthquake slip region.
I thought that as soon as the depth were updated, there would be a revised estimate of ground shaking (and a new kml file, with new MMI contours to plot). However, as I refreshed the pages, the “Did You Feel It?” map showed a report with a location close to the epicenter. This report, which is based on real observations (in contrast to the MMI contours, which are generated by a numerical model) had a large intensity. The DYFI system also uses the MMI scale, so it is easy to compare with the model based results. This DYFI report with a large MMI value confirmed that the original estimate for ground shaking, and the hypocentral depth, were generally correct. In other words, this is a shallow earthquake and not a deep one.
If someone were to produce a moment tensor, it would probably have a compressional solution.
Here is the DYFI map that shows the report with a small epicentral distance.
Here are the two “attenuation with distance plots,” before and after the near distance report. Note how the near-distance report confirms that the model is generally ok (especially the one in green, that uses attenuation relations from thousands of earthquakes in California).
Here is a web page that presents research about the thrust faults on the eastern boundary of the Andes. Below I present a few of their figures. First is a map and second is a cross section. This is to the south of today’s earthquake, but is probably a relevant model.
Here is a map showing this region, with the Juan Fernandez ridge near the northern boundary of this oblique map. The recent subduction zone earthquakes in November 2015 to the west have been on the northern side of the JFR.
Here is a cross section showing the detachment fault that has a series of thrust faults the reach the surface on the eastern boundary of the Andean Cordillera.
Monthly Archives: November 2015
Earthquake Report: Deep in Peru, Update #1
There was an aftershock to the pair of M 7.6 earthquakes in Peru: an earthquake with magnitude M = 6.7 in Brazil. Here is the USGS web page for this earthquake.
I reported about the M 7.6 earthquake pair here.
Here is a map showing the M 7.6 earthquake pair and today’s M 6.7 earthquake with epicenters colored vs. depth and diameters vs. magnitude.
I include figures from Kirby et al. (1995), showing a map and three cross sections of seismicity. In their paper, they attempt to explain the deep seismicity along this subduction zone. There is a paucity of seismicity between shallower (<~200 km) and these deeper focus (~600 km) earthquakes. Silver et al. (1995) also attempt to explain this deep seismicity. Both groups of researchers evaluate metamorphic processes to explain changes in fault properties. Kirby et al. (1995) suggest these deep earthquakes align along pre-existing faults. Also, Zhan et al. (2014) evaluate the 1994 Bolivia earthquake, in comparison to the 2013 Sea of Okhotsk M 8.3 earthquake (deepest Great earthquake recorded at 637 km). They contrast these two M 8.3 earthquakes, the Sea of Okhotsk earthquake occured along a belt of metastable Olivine, yet the Bolivia earthquake did not.
I also include some oblique views of the subduction zone from (1) the BANJO project and (2) Espurt et al. (2007). The Banjo project figure shows the epicenter of the 1994 M 8.3 earthquake as a blue circle. The November 2015 earthquakes are located beneath the Fitzcarrald Arch.
I placed a moment tensor / focal mechanism legend in the lower left corner of the map. There is more material from the USGS web sites about moment tensors and focal mechanisms (the beach ball symbols). Both moment tensors and focal mechanisms are solutions to seismologic data that reveal two possible interpretations for fault orientation and sense of motion. One must use other information, like the regional tectonics, to interpret which of the two possibilities is more likely.
I also plot the earthquakes with magnitude greater than M = 7 in the below map. Note that I also add the moment tensor for the 1994 M 8.3 earthquake, one of the deepest earthquakes recorded by modern seismometers. Here is the kml file that I used to make this map. Here is the query that I used to create that kml file. I have plotted moment tensors for some of the largest earthquakes in this region. I also plot the slab contours from Hayes et al. (2012). These contours show the depth where we think that the subduction zone fault may be. These contours are largely based upon seismicity. The hypocentral depths for these deep earthquakes are deeper than the slab depth from Hayes et al. (2012).
Based on our knowledge of subduction zones and plate tectonics, the hypocentral depths, the moment tensor, and the slab contour depths, I interpret the M 7.6 earthquake to be in the downgoing Nazca plate. The plate is undergoing extension from the downgoing slab and this is the likely source of extension for the earthquakes in this region. Some subducting slabs bend, which causes bending moment normal faults. Based on plots of seismicity, it does not appear that the Nazca slab is bending in this way at this depth (typically, this bending is happening at a much shallower depth). Below is a summary map of the seismicity since 1900, showing moment tensors for the largest earthquakes. Note the 1991 M 7.0 earthquake is also extensional, but this is in a location where the slab is bending. So, this 1991 earthquake, while could be due to slab-pull extension, could also be due to extension in the upper part of the downgoing plate causing bending moment normal faults.
Jascha Polet (Geophysist at Cal Poly Pomona, twitter: at CPPGeophysics) has plotted the seismicity of this region. Below is a map that shows the location of the cross section. Dr. Polet uses Generic Mapping Tools (GMT) to plot these data.
Here is the cross section data.
Compare Polet’s plot with this figure from Kirby et al. (1995). The November swarm fits in the upper most panel.
-
References:
- Espurt, N., Baby, P., Brusset, S., Roddaz, M., Hermoza, W., Regard, V., Antoine, P.-O., Salas-Gismodi, R., and Bolaños, R., 2007. How does the Nazca Ridge subduction influence the modern Amazonian foreland basin? in Geology, v. 35, no. 6, p. 515-518.
- Hayes, G. P., D. J. Wald, and R. L. Johnson, 2012. Slab1.0: A three-dimensional model of global subduction zone geometries, J. Geophys. Res., 117, B01302, doi:10.1029/2011JB008524.
- Kirby, S.H., Okal, E.A., and Engdahl, E.R., 1995. The 9 June 94 Bolivian deep earthquake: An exceptional event in an extraordinary subduction zone in Geophysical Research Letters, v. 22, no. 16, p. 2233-2236.
- Silver., P.G., Beck, S.L., Wallace, T.C., Meade, C., Myers, S.C., James, D.E., and Kuehnel, R., 1995. Rupture Characteristics of the Deep Bolivian Earthquake of 9 June 1994 and the Mechanism of Deep-Focus Earthquakes in Science, v. 268, p. 69-73.
- Zhan, Z., Kanamori, H., Tsai, V.C., Helmberger, D.V., and Wei, S., 2014. Rupture complexity of the 1994 Bolivia and 2013 Sea of Okhotsk deep earthquakes in Earth and Planetary Science Letters, v. 385, p. 89-96.
Earthquake Report: Deep in Peru!
Today we had a series of deep focus earthquakes in Peru. This suite of earthquakes occurred in a region that ruptured in the 1960s and recently in 1990. Further to the south, in 1994, there was a deep earthquake that was oriented differently than the 1960s, 1990, and 2015 earthquakes. The plate boundary here is formed by the Nazca plate that subducts beneath the South America plate, forming the Peru-Chile subduction zone.
-
Here are the USGS web pages for the two M = 7.6 earthquake from today.
- 2015.11.24 22:45 M 7.6
- 2015.11.24 22:50 M 7.6
Below is my interpretation map. The epicenters from the past month, with magnitudes greater than M = 2.5 are plotted, as well as epicenters from earthquakes since 1990 with magnitudes greater than M = 7.0. I list these earthquakes in a table below. Here is the kml file that I used to make this map. Here is the query that I used to create that kml file. I have plotted moment tensors for some of the largest earthquakes in this region. I also plot the slab contours from Hayes et al. (2012). These contours show the depth where we think that the subduction zone fault may be. These contours are largely based upon seismicity. The hypocentral depths for these deep earthquakes are deeper than the slab depth from Hayes et al. (2012).
In the lower left corner, I plot earthquake slip patches as plotted by Matt Pritchard, faculty at the Cornell Earth and Atmospheric Sciences: pritchard at cornell.edu. In the lower left corner I include an inset map from the USGS Open File Report 2015-1031-E (Hayes et al., 2015), along with a cross section of seismicity from B-B’. The 1963 epicenter is located on the map and the blue colored hypocenters plot approximately where today’s earthquake would plot.
In the upper left corner, I place Figure 1 from Chlieh et al. (2011). This is a map that shows instrumental and historic earthquake rupture regions. This figure from Chlieh et al. (2011) shows the slip models (earthquake slip in meters) and earthquake slip regions for pre-seismologic (prior to seismometers) earthquakes in grey.
I placed a moment tensor / focal mechanism legend in the upper right corner of the map. There is more material from the USGS web sites about moment tensors and focal mechanisms (the beach ball symbols). Both moment tensors and focal mechanisms are solutions to seismologic data that reveal two possible interpretations for fault orientation and sense of motion. One must use other information, like the regional tectonics, to interpret which of the two possibilities is more likely.
Based on our knowledge of subduction zones and plate tectonics, the hypocentral depths, the moment tensor, and the slab contour depths, I interpret the M 7.6 earthquake to be in the downgoing Nazca plate. The plate is undergoing extension from the downgoing slab and this is the likely source of extension for the earthquakes in this region. Some subducting slabs bend, which causes bending moment normal faults. Based on plots of seismicity, it does not appear that the Nazca slab is bending in this way at this depth (typically, this bending is happening at a much shallower depth).
Here is the table for the earthquakes plotted in my interpretation map at the top of this page. Click on the image and a pdf will load. The html links are live in the pdf.
-
Here are two animations of the seismic waves propagating through the US Array, seismometers across the USA. The above one shows the vertical motion (red = up, blue = down). The second animation shows all three components (N-S and E-W = compass vector; red = up, blue = down). For each animation, first is a screen shot and below that is the embedded video. These animations are from IRIS, Trabant et al. (2012).
- Here is a link to the embedded video below. (11 MB mp4)
- Here is a link to the embedded video below. (30 MB mp4)
Below is a seismograph from Keele University (at hypocentre). The seismograph shows that these two earthquakes, that happened about 5 mins apart, also overlap on this seismograph record. The first two peaks in amplitude are the p-waves and the second two large peaks are the initiation of the s-waves at this seismometer. note how the time distance between the p-waves and the s-waves is similar. This is because these two earthquakes are about the same distance from the seismometer.
Initially, this earthquake was estimated to have a potential for significant damage. When earthquakes of a certain magnitude occur, the USGS (and other organizations) make estimates of ground shaking. These estimates are based on empirically numerical models based upon seismological observations from thousands of earthquakes. The initial computations are automatic, but are soon recalculated by real people given their interpretations of the tectonic setting. The original estimate of shaking seems to have been produced using a default hypocentral depth. Given a shallow depth, the shaking intensity would be larger than if the earthquake was deeper (further away, with more Earth material for the seismic waves to travel through and attenuate). Below are two maps showing the first model (more intense) result and the second (less intense) model result. The colored lines are the ground shaking contours using the Modified Mercalli Intensity scale (MMI). Here is the USGS page on MMI, but the wiki site is better.
The PAGER alerts, which are estimates of the extent of damage to people (casualties) and their possessions (economic losses). The PAGER alerts reflect this change. Here is the first PAGER alert (v. 1). Here is the second PAGER alert (v. 2).
We recently had some earthquakes further to the south of the subduction zone in Chile. Here is my latest Earthquake Report from that series of earthquakes in September of 2015. Below is my interpretation map from that report.
I have summarized the historic seismicity along the subduction zone further to the south, beginning in the region of the 2014.04.01 M 8.2 earthquake. Here is my report, where I discuss the 2014 earthquake series, along with the historic and prehistoric earthquakes in that region. Here is a map from that report. Note how the September 2015 earthquakes fit into part of this gap that I plot below (in the region of the 1922 earthquake).
-
Here is an animation from IRIS that reviews the tectonics of the Peru-Chile subduction zone. For the animation, first is a screen shot and below that is the embedded video. This animation is from IRIS. Written and directed by Robert F. Butler, University of Portland. Animation and Graphics: Jenda Johnson, geologist. Consultant: Susan Beck, University or Arizona. Narration: Elayne Shapiro, University of Portland.
- Here is a download link for the embedded video below (34 MB mp4)
-
References:
- Chlieh et al., 2011. Interseismic coupling and seismic potential along the Central Andes subduction zone, Journal of Geophysical Research, v. 116, B12405, 21 p.
- Hayes, G. P., D. J. Wald, and R. L. Johnson, 2012. Slab1.0: A three-dimensional model of global subduction zone geometries, J. Geophys. Res., 117, B01302, doi:10.1029/2011JB008524.
- Hayes, G.P., Smoczyk, G.M., Benz, H.M., Villaseñor, Antonio, and Furlong, K.P., 2015. Seismicity of the Earth 1900–2013, Seismotectonics of South America (Nazca Plate Region): U.S. Geological Survey Open-File Report 2015–1031–E, 1 sheet, scale 1:14,000,000, http://dx.doi.org/10.3133/ofr20151031E.
- Trabant, C., A. R. Hutko, M. Bahavar, R. Karstens, T. Ahern, and R. Aster, 2012. Data Products at the IRIS DMC: Stepping Stones for Research and Other Applications, Seismological Research Letters, 83(5), 846–854, doi:10.1785/0220120032.
-
Here are some related papers:
- Moreno 2010
- Chileh et al., 2011
- Lay 2011
- Schurr et al., 2014
- Melnick et al., 2014
- Béjar-Pizarro et al., 2013
Earthquake Report: Humboldt County, CA!
Tonight we had a small earthquake offshore of northern California, northwest of Trinidad. Here is the USGS website for this earthquake with a magnitude of 3.2. At first glance, this earthquake appears to be close to the location of the 1980 Trinidad earthquake.
I placed a moment tensor / focal mechanism legend in the upper right corner of the map. There is more material from the USGS web sites about moment tensors and focal mechanisms (the beach ball symbols). Both moment tensors and focal mechanisms are solutions to seismologic data that reveal two possible interpretations for fault orientation and sense of motion. One must use other information, like the regional tectonics, to interpret which of the two possibilities is more likely.
Due to the internal deformation in the Gorda plate, there are ubiquitous northeast striking left-lateral strike slip faults throughout. There have been many left lateral strike slip earthquakes within the Gorda plate (I list some of them below). Below is the map that I put together for this earthquake. I have placed the focal mechanism for the M = 3.2 earthquake and the moment tensor for a 2015.11.02 M 4.3 earthquake along the Mendocino fault system (a right lateral strike slip earthquake). Here is my earthquake report for the M = 4.3 earthquake. I interpret today’s 3.2 earthquake as a northeast striking left lateral strike slip earthquake. If the hypocentral depth were shallower, it could be interpreted as a northeast striking right lateral strike slip earthquake as the Dextral shear from the North-America/Pacific plate boundary motion does feed into this region. However, that motion would likely only be realized along faults in the upper plate.
I include a map of the Cascadia subduction zone. Here is that map as a single file (modified from Chaytor et al., 2004; Nelson et al., 2004). I present more information about the Cascadia subduction zone on this page, which I put together for the 315th anniversary of the last megathrust earthquake. Even more about Cascadia is posted here.
Here is a map from Rollins and Stein (2010) showing the faults and tectonics of the Gorda plate. The 2014.03.29 M 6.8 earthquake is probably somewhere in the right step of the dashed fault labeled “B.” Here is the earthquake report for the M 6.8 Gorda plate earthquake.
These are the models for tectonic deformation within the Gorda plate as presented by Jason Chaytor in 2004.
Here is a map that I put together that shows some of the historic earthquakes in the Mendocino triple junction region. Note the Gorda plate earthquakes, the Mendocino fault earthquakes, and the 1992 Petrolia earthquake, thought to be a small Cascadia subduction zone earthquake.
-
Here are some earthquake reports sorted by region and source of seismicity.
- 2014.03.09 M 6.8 Gorda plate p-1
- 2014.03.23 M 6.8 Gorda plate p-2
- 2014.03.13 M 5.2 Gorda Rise
- 2015.06.01 M 5.8 Blanco fracture zone p-1
- 2015.06.01 M 5.8 Blanco fracture zone p-2 (animations)
- 2015.01.28 M 5.7 Mendocino fault
Gorda plate
Blanco fracture zone
Mendocino fault
-
References:
- Chaytor, J.D., Goldfinger, C., Dziak, R.P., and Fox, C.G., 2004. Active deformation of the Gorda plate: Constraining deformation models with new geophysical data: Geology v. 32, p. 353-356.
- Nelson, A.R., Asquith, A.C., and Grant, W.C., 2004. Great Earthquakes and Tsunamis of the Past 2000 Years at the Salmon River Estuary, Central Oregon Coast, USA: Bulletin of the Seismological Society of America, Vol. 94, No. 4, pp. 1276–1292
- Rollins, J.C. and Stein, R.S., 2010. Coulomb stress interactions among M ≥ 5.9 earthquakes in the Gorda deformation zone and on the Mendocino Fault Zone, Cascadia subduction zone, and northern San Andreas Fault: Journal of Geophysical Research, v. 115, B12306, doi:10.1029/2009JB007117, 2010.
Earthquake Report: Solomons!
Today we had a good sized earthquake along the S. Solomon trench, however, it was not a subduction zone earthquake, but a strike-slip earthquake in the downgoing plate.
-
Here are the largest earthquakes plotted in the map below.
- 2015.10.20 M 7.1
-
Along the New Hebrides trench
In the map below I plot the epicenters of earthquakes from the past 30 days of magnitude greater than M = 2.5. The epicenters have colors representing depth in km. The USGS plate boundaries are plotted vs color. The USGS modeled estimate for ground shaking is plotted with contours of equal ground shaking using the Modified Mercalli Intensity scale. I show the moment tensor for the M 6.8 earthquake, as well as for the M 7.1 from about a month ago. Here is the kmz file that I use in the map.
I placed a moment tensor / focal mechanism legend in the lower left corner of the map. There is more material from the USGS web sites about moment tensors and focal mechanisms (the beach ball symbols). Both moment tensors and focal mechanisms are solutions to seismologic data that reveal two possible interpretations for fault orientation and sense of motion. One must use other information, like the regional tectonics, to interpret which of the two possibilities is more likely.
Based upon the orientation of the fracture zones (strike-slip fault systems) in the plate formed along the Woodlark Spreading center, I interpret this M 6.8 earthquake to be striking north-south. Based on this, along with the moment tensor, I interpret this to be a right lateral strike-slip earthquake.
In the above map I also include a map that shows an interpretation of the regional tectonic setting (credit IRIS) modified from Hamilton (1979). The inset map shows plate velocity vectors.
Here is the same map as above, but with the slab contours plotted (Hayes et al., 2012), which are contours that represent the depth to the subduction zone fault. These are mostly based upon seismicity. The depths of the earthquakes have considerable error and do not all occur along the subduction zone faults, so these slab contours are simply the best estimate for the location of the fault. The hypocentral depth plots this close to the location of the fault as mapped by Hayes et al. (2012). So, the earthquake is either in the downgoing slab, or in the upper plate and a result of the seismogenic locked plate transferring the shear strain from a fracture zone in the downgoing plate to the upper plate.
This region has had several earthquakes with similar senses of motion in the last two years. In May of 2015, there was a thrust/reverse fault earthquake to the east of this M 6.6 earthquake. Here is a summary map that I put together with that, along with some other recent earthquakes plotted. This shows how these different plate boundaries have different types of earthquakes. The page for the May earthquake is here.
To the north and south of this epicentral region, the S. Solomon trench has had typical subduction zone compressional earthquakes. Also, further to the west, along the New Britain trench, there are also typical compressional earthquakes along the subduction zone there. I put together this map to show how the New Britain and Solomon trenches meet. Earthquakes along the New Britain trench have principal stress aligned perpendicular to the New Britain trench and earthquakes along the Solomon trench have principal stresses aligned perpendicular to the Solomon trench due to strain partitioning in the upper plate. I provide more links and explanations about these earthquakes on this page.
There were also three M = 6.8-6.9 earthquakes further to the south along a transform plate boundary (mapped as a subduction zone by the USGS). Here is a map that shows the location of this May earthquake swarm.
-
Here are my earthquake reports for a series of earthquakes in this region:
- 2014.04.11 M 7.1 subduction zone earthquake S. Solomon trench
- 2014.04.13 M 7.1 triggered earthquake at the southern S. Solomon trench
- 2014.12.06 M 6.8 subduction zone earthquake S. Solomon trench
- 2015.03.29 M 7.5 subduction zone earthquake New Britain trench
- 2015.05.21 M 5.7 subduction zone earthquake S. Solomon trench
- 2015.07.13 M 6.7 n-s strike-slip S. Solomon trench
- 2015.08.10 M 6.6 n-s strike-slip S. Solomon trench
- 2015.11.04 M 5.3 n-s strike-slip S. Bismarck plate
-
References:
- Hamilton, W., 1979, Tectonics of the Indonesian region: U.S. Geological Survey Prof. Paper 1078.
- Hayes, G. P., D. J. Wald, and R. L. Johnson (2012), Slab1.0: A three-dimensional model of global subduction zone geometries, J. Geophys. Res., 117, B01302, doi:10.1029/2011JB008524
Earthquake Report: Greece!
Late last night (my time) there was an earthquake in Greece with a USGS magnitude of M = 6.5. Here is the USGS web site for this earthquake. Greece is at the intersection of a complex configuration of plate boundaries. To the south is a subduction zone that is part of the plate boundary formed between the Africa/India-Australia plate to the south and the Eurasia plate to the north. This plate boundary extends from northeast of Australia to west of Portugal and is responsible for the uplift of the tallest mountains of the world in the Himalayas and the Alps. One of the most active and devastating strike slip faults, the North Anatolian fault (NAF), strikes from the north end of Turkey, through the Aegean Sea, and bifurcates (more than 2 splays) through Greece. Today’s earthquake appears to have ruptured a fault related to the Kefalonia fault (KF), the only strand extension of the NAF that makes it completely through Greece.
Here is a map that shows the earthquake epicenter as a gold star, with ground shaking contours that use the Modified Mercalli Intensity Scale. I include maps that others have produced that help us interpret the regional tectonics. See references below.
I placed a moment tensor / focal mechanism legend in the lower left corner of the map. There is more material from the USGS web sites about moment tensors and focal mechanisms (the beach ball symbols). Both moment tensors and focal mechanisms are solutions to seismologic data that reveal two possible interpretations for fault orientation and sense of motion. One must use other information, like the regional tectonics, to interpret which of the two possibilities is more likely.
Based on the tectonic maps from Vött (2007) and Burchfiel et al. (2008), and the moment tensor, I interpret this earthquake to be related to the Kefalonia fault (KF) system and is a right lateral strike-slip earthquake. I also include, as an inset, the GPS velocity field map from Hamilton (2007; see below).
Here is an updated map that shows a couple more aftershocks, at a large (local) scale. I have included the moment tensors for the two largest aftershocks.
-
Here are the USGS web pages for these 3 earthquakes:
- 2015.11.17 M 6.5
- 2015.11.17 M 5.4
- 2015.11.18 M 4.7
This map (Hamilton, 2007) shows GPS vectors that represent secular motion of locations throughout this region. Note how the vectors on the lower part of the figure show larger motion to the west. At the latitudinal location of the NAF is where the vectors show a large change in magnitude. This shows how the NAF motion extends into Greece and is evidence for why the KF is the single through going fault system. I include the author’s figure caption below the figure as a blockquote.
Global Positioning System (satellite geodesy) velocity field of Aegean and Turkish region relative to internally stable northwest Eurasia. Velocities in the overriding plate increase along curving trajectories toward a south-facing subduction system. The trench is not shown but trends near SW and SE corners of map area, is convex southward, and is ~250 km south of Crete, the long island at bottom center. The overriding plate is being extended toward the retreating hinge (not shortened and crumpled against a fixed hinge), the free edge, as it is extruded between the converging Arabian and European plates. High-strain zones of strike slip and extension, not marked here, outline miniplates of lesser internal determination (Nyst and Thatcher, 2004). Other unmarked arc features: the forearc ridge (the crest of the active accretionary wedge) is ~100 km offshore from Peloponnisos (large peninsula of southern Greece, left center), 150 km south of Crete, and 100 km south of Turkish coast at far right; the magmatic arc is convex southward, and is 150 km north of Crete at closest. This image was slightly modified from a figure provided by Wayne Thatcher; cf. Nyst and Thatcher (2004, their Fig. 2).
There was a tsunami recorded, possibly from an observed landslide. The Eurpoen Commission hosts tide gage data online and here is the website for the tide gage in Crotone, Italy.
Here is the map that shows the location of this gage.
Here is the tide gage record.
Here is a photo that shows a landslide triggered by this earthquake. This was taken by a photographer for meteonews. This photo was posted on the International Tsunami Information Center listserv.
Here is a map from the University of Athens that shows the seismicity aligning with the KF.
Based on the PAGER estimate (an estimate generated by a numerical model that estimates ground shaking and the possible damage to people and their belongings), this earthquake could lead to up to 10 fatalities (30% probability). Also, there is a 34% probability that there is damage to their infrastructure of between 10 and 100 million USD.
For comparison, here is the map that shows results from the USGS “Did You Feel It?” online reporting web site. This is based upon real observations, not just modeled estimates (as the PAGER is above). For larger earthquakes, fault models are constructed and models are re-run to improve the PAGER estimates, but not in this case.
Here is another way of comparing the difference between the model based estimates and the real observations. Below is a plot showing the attenuation of shaking intensity with distance from the earthquake. The green and orange lines are the results of from the numerical model and the blue dots are the results from the observational reports. There is not a very good relation between these two data sets, likely because there is a paucity of observational data. But there assumptions about fault geometry of the numerical model also plays a big role as this model assumes a point location for the earthquake, while earthquakes are not point sources of ground motion.
-
References:
- Burchfiel, B.C., et al., 2008. Evolution and dynamics of the Cenozoic tectonics of the South Balkan extensional system in Geosphere, v. 4, no. 6, doi: 10.1130/GES00169.1, p. 919-938.
- Hamilton, W.B., 2007. Driving mechanism and 3-D circulation of plate tectonics, in Sears, J.W., Harms, T.A., and Evenchick, C.A., eds., Whence the Mountains?
Inquiries into the Evolution of Orogenic Systems: A Volume in Honor of Raymond A. Price: Geological Society of America Special Paper 433, p. 1–25, doi:
10.1130/2007.2433(01). - Nyst, M., and Thatcher, W., 2004, New constraints on the active tectonic deformation of the Aegean: Journal of Geophysical Research, v. 109, no. B11, paper 406, 23 p., doi: 10.1029/2003JB002830.
- Vött, A., et al., 2007. Late Holocene Tsunami Imprint on Actio Headland at the entrance to the Ambrakian Gulf in Mediterranee, v. 108, p. 43-57.
Earthquake Report: Chile in 2015!
The patch of the Chile subduction zone that ruptured in September 2015 continues to have large magnitude aftershocks. Today (2015.11.11) there were two M = 6.9 earthquakes in the northern part of this region. Four days ago (2015.11.07) there was another flurry of seismic activity, with the largest earthquake with a magnitude M = 6.8.
-
Here are the largest magnitude earthquakes from this past week:
- 2015.09.16 M 8.3
- 2015.11.07 M 6.2
- 2015.11.07 M 6.8
- 2015.11.07 M 5.9
- 2015.11.11 M 6.9
- 2015.11.11 M 6.9
I reported about the earthquakes from four days ago (2015.11.07) here. In that report, I discuss the differences between modeled ground motions and shaking intensities estimated based upon real observations.
Below is a map showing the seismicity of the past month with magnitudes greater than M 2.5, along with earthquakes from 2000-2015 with magnitudes greater than M 6.0. Here is the query that I used for the 2000-2015 epicenters. I placed the moment tensors for the largest earthquakes listed above, in addition to the moment tensor from the 2010 M 8.8 earthquake. I outline the region that slipped in 2010 and 2015 (so far) as dashed white polygons. I also plot the slab depth contours, which are contours that show where Hayes et al. (2012) estimate that the subduction fault is. Read more about their methods here.
I placed a moment tensor / focal mechanism legend in the upper right corner of the map. There is more material from the USGS web sites about moment tensors and focal mechanisms (the beach ball symbols). Both moment tensors and focal mechanisms are solutions to seismologic data that reveal two possible interpretations for fault orientation and sense of motion. One must use other information, like the regional tectonics, to interpret which of the two possibilities is more likely.
I also placed a map from the USGS earthquake summary poster in the lower left corner (Hayes et al., 2015). The red rectangle shows the general location of the main map. The USGS plot epicenters for historic earthquakes on the map, along with the slab contours (Hayes et al., 2012). There are two cross sections plotted on the map (C-C’ on the north and D-D’ on the south). The USGS plot these hypocenters along these two cross sections and I include those. The 2015 earthquake patch is just south of cross section C-C’.
In the lower right corner I place a cross section from Melnick et al. (2006). This shows the prehistoric earthquake history on the left and a cross section of the subduction zone on the right. This cross section is in the region of the 2010 subduction zone earthquake. Above the Melnick et al. (2006) figure I include the space-time diagram from Beck et al. (1998 ) showing the along strike length of prehistoric earthquakes in the central subduction zone. The map above shows these prehistoric rupture strike lengths as green lines (labeled with green labels). The 2015 earthquake series ruptured past the southern boundary of the 1943 earthquake and about 30% into the 1922 earthquake region. There is a small gap between the 2010 and 2015 earthquake series, which aligns with the Juan Fernandez Ridge (a fracture zone in the Nazca plate; von Huene et al., 1997; Rodrigo et al., 2014). This fracture zone appears to be a structural boundary to earthquake slip patches (subduction zone segmentation), at least for some earthquakes. Beck et al. (1998 ) show that possibly two earthquakes ruptured past this boundary (1730 A.D. and possibly 1647 A.D., though that is queried). This segment boundary appears to be rather persistent for the past ~500 years.
-
Here are some earthquake reports from this 2015 earthquake series:
- 2015.09.16 First Report
- 2015.09.16 First Update
- 2015.09.17 Second Update
- 2015.09.19 Third Update
- 2015.09.17 Tsunami Observations
- 2015.09.18 Historic Chile Tsunami Comparisons
- 2015.03.14 Seismicity 2000-2014
Here are some reports that include comparisons of historic seismicity of this region.
Here is the cross section of the subduction zone just to the south of this Sept/Nov 2015 swarm (Melnick et al., 2006). Below I include the text from the Melnick et al. (2006) figure caption as block text.
(A) Seismotectonic segments, rupture zones of historical subduction earthquakes, and main tectonic features of the south-central Andean convergent margin. Earthquakes were compiled from Lomnitz (1970, 2004), Kelleher (1972), Comte et al. (1986), Cifuentes (1989), Beck et al. (1998 ), and Campos et al. (2002). Nazca plate and trench are from Bangs and Cande (1997) and Tebbens and Cande (1997). Maximum extension of glaciers is from Rabassa and Clapperton (1990). F.Z.—fracture zone. (B) Regional morphotectonic units, Quaternary faults, and location of the study area. Trench and slope have been interpreted from multibeam bathymetry and seismic-reflection profiles (Reichert et al., 2002). (C) Profile of the offshore Chile margin at ~37°S, indicated by thick stippled line on the map and based on seismic-reflection profiles SO161-24 and ENAP-017. Integrated Seismological experiment in the Southern Andes (ISSA) local network seismicity (Bohm et al., 2002) is shown by dots; focal mechanism is from Bruhn (2003). Updip limit of seismogenic coupling zone from heat-fl ow measurements (Grevemeyer et al., 2003). Basal accretion of trench sediments from sandbox models (Lohrmann, 2002; Glodny et al., 2005). Convergence parameters from Somoza (1998 ).
In March 2015, there was some seismicity in this September/November 2015 earthquake slip region. I put together an earthquake report about those earthquake of magnitudes M = 5.0-5.3. I speculate that the 1922 earthquake region is a seismic gap. Note that this September/November 2015 earthquake region is along the southern portion of the seismic gap that I labeled on the map below. Dutchsinse can kiss my 4$$.
Here is a map that shows the recent swarm of ~M = 5 earthquakes. There are moment tensors for the earthquakes listed below, some recent historic subduction zone earthquakes. I placed the general along-strike distance for older historic earthquakes in green (and labeled their years). The largest earthquake ever recorded, the Mw = 9.5 Chile earthquake, had a slip patch that extends from the south of the map to just south of the 2010 earthquake swarm. The 2010 and 2014 earthquake swarm epicenters are plotted as colored circles, while most other historic earthquake epicenters are plotted as gray circles. Note how this March 2015 swarm is at the northern end of the 1922/11/11 M 8.3 earthquake. At the bottom of this page, I put a USGS graphic about what these moment tensor plots (beach balls) tell us about the earthquakes.
Hundreds of people died as a result of the 1922 earthquake. The USGS has more news reports about the 1922 earthquake here. There were also reports of a tsunami over 9 meters. So we know that this segment of the fault can produce large earthquakes and tsunami. However, it has been about a century since the last Great subduction zone earthquake in this region of the fault.
-
Here are the main earthquakes in the above map:
- 1922/11/7 M 7.0
- 1922/11/11 M 8.3
- 1995/07/30 M 8.0
- 1997/10/15 M 7.1
- 2007/11/14 M 7.7
- 2010/2/27 M 8.8
- 2014/4/1 M 8.2
-
There was significant subduction zone seismicity to the north of this region in 2014. I put together some material for the 2014 earthquake in the past. The page where I summarize some of my reports on the 2014 earthquake are found here.
- Interseismic Fault Coupling: the 2014 March Northern Chile Swarm 3/27/14: There were some earthquakes in this region of the subduction zone, so I started posting information about historic earthquakes there.
- M 8.2 earthquake in northern Chile 4/1/14: Here is the main page. There are a couple excellent animations from IRIS on this page!!!
- Tsunamis in the region of the M 8.2 northern Chile earthquake 4/1/14
- M 8.2 northern Chile tsunamis recorded at tide gages 4/2/14
- large magnitude aftershock in northern Chile 4/2/14: the second patch that slipped
- all right, another M 6.2 aftershock in Chile 4/2/14: another large aftershock in the 2014 swarm
- northern Chile M 8.2 earthquake series animations 4/3/14: I put this together to show how this swarm slipped two distinct patches (sub-faults in modeling parlance, asperities in Aki parlance)
- M 6.7 earthquake swarm in northern Chile! 2014/03/06: This is the swarm that started it all.
References:
- Beck, S., Barientos, S., Kausel, E., and Reyes, M., 1998. Source Characteristics of Historic Earthquakes along the Central Chile Subduction Zone in Journal of South American Earth Sciences, v. 11, no. 2., p. 115-129.
- Hayes, G.P., Wald, D.J., and Johnson, R.L., 2012. Slab1.0: A three-dimensional model of global subduction zone geometries in, J. Geophys. Res., 117, B01302, doi:10.1029/2011JB008524
- Hayes, G.P., Smoczyk, G.M., Benz, H.M., Villaseñor, Antonio, and Furlong, K.P., 2015. Seismicity of the Earth 1900–2013, Seismotectonics of South America (Nazca Plate Region): U.S. Geological Survey Open-File Report 2015–1031–E, 1 sheet, scale 1:14,000,000, http://dx.doi.org/10.3133/ofr20151031E.
- Melnick, D., Bookhagen, B., Echtler, H.P., and Strecker, M.R., 2006. Coastal deformation and great subduction earthquakes, Isla Santa María, Chile (37°S) in GSA Bulletin, v. 118, no. 11/12, p. 1463-1480.
- Rodrigo, C. and Lara, L.E., 2014. Plate tectonics and the origin of the Juan Fernández Ridge: analysis of bathymetry and magnetic patterns in Lat. Am. J. Aquat. Res, v. 42, no. 4, p. 907-917
- von Huene, R. et al., 1997. Tectonic control of the subducting Juan Fernandez Ridge on the Andean margin near Valparaiso, Chile in Tectonics, v. 16, no. 3, p. 474-488.
Earthquake report: Aleutian subduction zone at the Amlia fracture zone update
Today (2015.11.09) we had another moderate sized earthquake along the Aleutian subduction zone, the largest of four earthquakes of magnitude mid 5-6. My initial earthquake report form 2015.11.02 can be found here.
-
Here are the USGS web sites for the largest magnitude earthquakes plotted below.
- 2015.11.02 M 5.9
- 2015.11.06 M 5.5
- 2015.11.08 M 5.4
- 2015.11.08 M 5.7
- 2015.11.09 M 6.2
Below is a map showing the epicenters from earthquakes during the past 30 days in the region of some earthquakes with largest magnitudes ranging from 5.4-6.2 (linked above). I plot the moment tensors from the earthquakes with the 4 largest magnitudes. These five earthquakes are the result of north-northwest compression from the subduction of the Pacific plate underneath the North America plate to the north. The majority of these earthquakes occurred in the region of the subduction zone where the Amlia fracture zone is aligned. The AMZ is a left lateral strike slip oriented fracture zone, which displaces crust of unequal age, beneath the megathrust. The difference in age results in a variety of factors that may contribute to differences in fault stress across the fracture zone (buoyancy, thermal properties, etc). For example, older crust is colder and denser, so it sinks lower into the mantle and exerts a different tectonic force upon the overriding plate.
In the upper left corner, I place a map created by Peter Haeussler, USGS, which shows the historic earthquakes along the Alaska and Aleutian subduction zones.
I placed a moment tensor / focal mechanism legend in the upper right corner of the map. There is more material from the USGS web sites about moment tensors and focal mechanisms (the beach ball symbols). Both moment tensors and focal mechanisms are solutions to seismologic data that reveal two possible interpretations for fault orientation and sense of motion. One must use other information, like the regional tectonics, to interpret which of the two possibilities is more likely.
This is a USGS graphic that shows a cross section of the Aleutian subduction zone that is a part of the “Eastern Aleutian Volcanic Arc Digital Model.’
This shows a cross section of a subduction zone through the two main parts of the earthquake cycle. The interseismic part (in-between earthquakes) and the coseismic part (during earthquakes). This was developed by George Plafker and published in his 1972 paper on the Good Friday Earthquake.
Here is a map that shows historic earthquake slip regions as pink polygons (Peter Haeussler, USGS). Dr. Haeussler also plotted the magnetic anomalies (grey regions), the arc volcanoes (black diamonds), and the plate motion vectors (mm/yr, NAP vs PP).
This region was active in September of 2015 also. Here is my earthquake report from that series of earthquakes. Below is a map from this 2015/09 report that shows some late 20th and early 21st century earthquakes and their moment tensors for this region of the Aleutian subduction zone.
-
References:
- Plafker, G., 1972. Alaskan earthquake of 1964 and Chilean earthquake of 1960: Implications for arc tectonics in Journal of Geophysical Research, v. 77, p. 901-925.
Earthquake Report: Nicobar Isles and Sumatra!
This past 24 hours include two large earthquakes in the region of the Sumatra-Andaman subduction zone offshore of Sumatra. Here is a map using the USGS online GIS interface.
Below is a map that I prepared with the seismicity from the past week, as well as the seismicity since 1900 with earthquakes of magnitude greater than M = 7.5. I plot the slab contours (these show the depth where we think that the subduction zone fault is located; Hayes et al., 2012). I plot the moment tensors (read more below about mt data) for these two earthquakes, along with the moment tensors from four significant earthquakes since ~2004. The 2004.12.26 and 2005.03.28 earthquakes are subduction zone earthquakes. The 2012.04.11 earthquakes are the largest strike slip earthquakes ever recorded on modern seismometers. While the tectonic fabric in the India plate is dominated by north-south fracture zones (see the blue line to the right of the label “Sunda trench”), these two M~8+ earthquakes ruptured east-west faults. The oceanic crust is very thick in the region of the Ninteyeast Ridge (thought to have thickened as the crust traveled over a hot spot).
I placed a moment tensor / focal mechanism legend in the upper right corner of the map. There is more material from the USGS web sites about moment tensors and focal mechanisms (the beach ball symbols). Both moment tensors and focal mechanisms are solutions to seismologic data that reveal two possible interpretations for fault orientation and sense of motion. One must use other information, like the regional tectonics, to interpret which of the two possibilities is more likely.
The interesting things about these two earthquakes is that they are not on the subduction zone fault interface. The M = 6.4 earthquake is shallow (USGS depth = 7.7 km). Note how the subduction zone is mapped to ~120-140 km depth near the M 6.4 earthquake. The Andaman Sea is a region of backarc spreading and forearc sliver faulting. Due to oblique convergence along the Sunda trench, the strain is partitioned between the subduction zone fault and the forearc sliver Sumatra fault. In the Andaman Sea, there is a series of en echelon strike-slip/spreading ridges. The M 6.4 earthquake appears to have slipped along one of these strike-slip faults. I interpret this earthquake to be a right lateral strike-slip earthquake, based upon the faults mapped in this region. The smaller earthquakes align in a west-southwest orientation. These may be earthquakes along the spreading center, or all of these earthquakes may be left lateral strike slip faults aligned with a spreading ridge. More analyses would need to be conducted to really know.
In May 2015, there was another Andaman Sea earthquake. Here is my report for that M 5.8 earthquake. Below is a map of the region. The M 5.8 did not have a moment tensor nor focal mechanism calculated, but I placed a generic strike-slip focal mechanism in an orientation that aligns with transform plate boundary that likely ruptured during this earthquake. The M 5.8 epicenter is depicted by a red and black star. I pose that this was a right-lateral strike slip earthquake along a transform plate boundary (shown in blue). Note that I have also added updated fault locations in this area, based upon seismicity (the USGS located plate boundaries are not quite correct; mine are imperfect too, but are consistent with the seismicity). The USGS fault lines have a stepped appearance and the ones that I drew look more smooth.
I placed moment tensors for some of the largest earthquakes in this region. The 2009 and 2008 earthquakes in the northwest are extensional, so are probably in the downgoing India plate (extension from bending of the plate or slab pull). The 2010 and 2005 earthquakes in the southwest are strike-slip and may be due to the oblique subduction (strain partitioning).
Here is a graphic that depicts how a sliver fault accommodates the strain partitioning from oblique subduction.
The M = 6.1 earthquake is a deep earthquake, based upon its USGS hypocentral depth of 75 km. The slab depth in this region is about 70 km, so this is close to the megathrust. However, these slab contours are mostly based upon seismicity, so there is considerable uncertainty regarding the precise location of the fault (Hayes et al., 2012).
Here is a map that I just put together that shows the historic earthquakes along the Suamtra-Andaman subduction zone. Compiled multiband single beam bathymetry and Shuttle Radar Topography Mission (SRTM) topography is in shaded relief and colored vs. depth (Smith and Sandwell, 1997, Graindorge et al., 2008; Ladage et al., 2006).The India-Australia plate subducts northeastward beneath the Sunda plate (part of Eurasia; sz–subduction zone). Orange vectors plot India plate movement relative to Sunda, and black vectors plot Australia relative to Sunda (global positioning system velocity based on Nuvel-1A; Bock et al., 2003; Subarya et al., 2006). Historic ruptures (Bilham, 2005; Malik et al., 2011) are plotted in grey, calendar years are in white. The 2004 and 2005 slip contours are shown orange and green, respectively (Chlieh et al., 2007, fig. 11 therein; Chlieh et al., 2008, figure 20 therein). Bengal and Nicobar fans cover structures of the India-Australia plate in the northern part of the map; are dashed black lines delimit their southern boundaries (Stow et al., 1990). The 2004 and 2005 earthquake focal mechanisms are plotted.
-
I have two reports about the 2004 Sumatra-Andaman subduction zone earthquake.
- Main Report
- Discussion about tectonic deformation Report
This figure from Meltzner et al. (2010) shows measurements of vertical deformation collected from coral microatolls (which are sensitive to the tides, basically, they cannot survive above a certain level of tidal elevation. Read his and related papers to learn more about this method.). These are observations that are independent of GPS data. I include this figure because it shows the complicated tectonic setting. Note all the different strike-slip and extensional faulting north of Sumatra. These faults are from Curray (2005).
Here is a map where I plot the USGS Modified Mercalli Intensity (MMI) contours for these two M 6.4 and 6.1 earthquakes. These are estimates of ground shaking based upon Ground Motion Prediction Equations, empirical relations between shaking intensity and distance to the earthquake.
Here is one example of the MMI scale from the wiki site.
-
These are the two “Did You Feel It?” (DYFI) maps for these two earthquakes. The DYFI maps are based on real observations, not models. Compare these maps with the above MMI Contour map.
- M 6.4 strike-slip
- M 6.1 normal
-
Here are the attenuation plots comparing the DYFI and MMI model based estimates of ground shaking.
- M 6.4 strike-slip
- M 6.1 normal
Here are the USGS web pages for the earthquakes I will discuss below:
- 2004.12.26 Mw 9.15
- 2005.3.28 Mw 8.6
- 2007.9.12 Me 8.5
- 2007.9.12 Mw 7.9
- 2007.9.13 Mw 7.0
- 2012.4.11 Mw 8.2
- 2012.4.11 Mw 8.6
- 2015.3.3 Mw 6.1
Here are a couple posts I put together regarding the initial instigator to this entire series of earthquakes (Mw = 9.15) and then the two largest strike slip earthquakes ever recorded (Mw = 82 and 8.6).
- Looking Back Part 1
- Looking Back Part 2
- 2012 Outer Rise Earthquakes
- Updated maps for the Outer Rise Earthquakes
Here is a map showing moment tensors for the largest earthquakes since the 26 December 2004 Mw = 9.15 Megathrust Great Sumatra-Andaman subduction zone (SASZ) earthquake. Below is a map showing the earthquake slip contours. The beginning of this series started with the Mw 9.15 and Mw = 8.7 Nias earthquakes. There were some other earthquakes along the Mentawaii patch to the south (Mw = 8.5, 7.9, and 7.0). These were also subduction zone earthquakes, but failed to release the strain that had accumulated since the last large magnitude earthquakes to have slipped in this region in 1797 and 1833. In 2012 we had two strike slip earthquakes in the outer rise, where the India-Australia plate flexes in response to the subduction. At first I interpreted these to be earthquakes on northeast striking faults since those the orientation of the predominant faulting in the region. The I-A plate has many of these N-S striking fracture zones, most notably the Investigator fracture zone (the most easterly faults shown in this map as a pair of strike slip faults that head directly for the epicenter of yesterday’s earthquake). However, considering the aftershocks and a large number of different analyses, these two earthquakes (the two largest strike slip earthquakes EVER recorded!) were deemed to have ruptured northwest striking faults. We called these off fault earthquakes, since the main structural grain is those N-S striking fracture zones. Also of note is the focal depth of these two large earthquakes (Mw 8.2 & 8.6). These earthquakes ruptured well into the mantle. Before the 2004 SASZ earthquake and the 2011 Tohoku-Oki earthquake (which also probably ruptured into the mantle), we would not have expected earthquakes in the mantle.
-
While we were at sea offshore Sumatra, there was a CBC (Canada) film maker aboard recording material for a film on Cascadia subduction zone earthquakes. This is a dity that he made for us.
- link to the embedded video below. (45 mb mp4)
- YT link to the embedded video below.
- Bilham, R., 2005. Partial and Complete Rupture of the Indo-Andaman Plate Boundary 1847 – 2004: Seismological Research Letters, v. 76, p. 299-311.
- Bock, Y., Prawirodirdjo, L., Genrich, J.F., Stevens, C.W., McCaffrey, R., Subarya, C., Puntodewo, S.S.O., Calais, E., 2003. Crustal motion in Indonesia from Global Positioning System measurements: Journal of Geophysical Research, v. 108, no. B8, 2367, doi: 10.1029/2001JB000324.
- Curray, J. R., 2005. Tectonics and history of the Andaman Sea region, J. Asian Earth Sci., 25, 187–232, doi:10.1016/j.jseaes.2004.09.001.
- Chlieh, M., Avouac, J.-P., Hjorleifsdottir, V., Song, T.-R.A., Ji, C., Sieh, K., Sladen, A., Hebert, H., Prawirodirdjo, L., Bock, Y., Galetzka, J., 2007. Coseismic Slip and Afterslip of the Great (Mw 9.15) Sumatra-Andaman Earthquake of 2004. Bulletin of the Seismological Society of America 97, S152-S173.
- Chlieh, M., Avouac, J.P., Sieh, K., Natawidjaja, D.H., Galetzka, J., 2008. Heterogeneous coupling of the Sumatran megathrust constrained by geodetic and paleogeodetic measurements: Journal of Geophysical Research, v. 113, B05305, doi: 10.1029/2007JB004981.
- Graindorge , D., Klingelhoefer, F., Sibuet, J.-C., McNeill , L., Henstock, T.J., Dean, S., Gutscher, M.-A., Dessa, J.X., Permana, H., Singh, S.C., Leau, H., White, N., Carton, H., Malod, J.A., Rangin, C., Aryawan, K.G., Chaubey, A.K., Chauhan, A., Galih, D.R., Greenroyd, C.J., Laesanpura, A., Prihantono, J., Royle, G., Shankar, U., 2008. Impact of lower plate structure on upper plate deformation at the NW Sumatran convergent margin from seafloor morphology: Earth and Planetary Science Letters, v. 275, p. 201-210.
- Hayes, G. P., D. J. Wald, and R. L. Johnson (2012), Slab1.0: A three-dimensional model of global subduction zone geometries, J. Geophys. Res., 117, B01302, doi:10.1029/2011JB008524.
- Ishii, M., Shearer, P.M., Houston, H., Vidale, J.E., 2005. Extent, duration and speed of the 2004 Sumatra-Andaman earthquake imaged by the Hi-Net array. Nature 435, 933.
- Malik, J.N., Shishikura, M., Echigo, T., Ikeda, Y., Satake, K., Kayanne, H., Sawai, Y., Murty, C.V.R., Dikshit, D., 2011. Geologic evidence for two pre-2004 earthquakes during recent centuries near Port Blair, South Andaman Island, India: Geology, v. 39, p. 559-562.
- Meltzner, A.J., Sieh, K., Chiang, H., Shen, C., Suwargadi, B.W., Natawidjaja, D.H., Philobosian, B., Briggs, R.W., Galetzka, J., 2010. Coral evidence for earthquake recurrence and an A.D. 1390–1455 cluster at the south end of the 2004 Aceh–Andaman rupture. Journal of Geophysical Research 115, 1-46.
- Patton, J.R., Goldfinger, C., Morey, A.E., Ikehara, K., Romsos, C., Stoner, J., Djadjadihardja, Y., Udrekh, Ardhyastuti, S., Gaffar, E.Z., and Vizcaino, A., 2015. A 6500 year earthquake history in the region of the 2004 Sumatra-Andaman subduction zone earthquake: Geosphere, v. 11, no. 6, p. 1–62, doi:10.1130/GES01066.1.
- Prawirodirdjo, P., McCaffrey,R., Chadwell, D., Bock, Y, and Subarya, C., 2010. Geodetic observations of an earthquake cycle at the Sumatra subduction zone: Role of interseismic strain segmentation, JOURNAL OF GEOPHYSICAL RESEARCH, v. 115, B03414, doi:10.1029/2008JB006139
- Singh, S.C., Carton, H.L., Tapponnier, P, Hananto, N.D., Chauhan, A.P.S., Hartoyo, D., Bayly, M., Moeljopranoto, S., Bunting, T., Christie, P., Lubis, H., and Martin, J., 2008. Seismic evidence for broken oceanic crust in the 2004 Sumatra earthquake epicentral region, Nature Geoscience, v. 1, pp. 5.
- Smith, W.H.F., Sandwell, D.T., 1997. Global seafloor topography from satellite altimetry and ship depth soundings: Science, v. 277, p. 1,957-1,962.
- Subarya, C., Chlieh, M., Prawirodirdjo, L., Avouac, J., Bock, Y., Sieh, K., Meltzner, A.J., Natawidjaja, D.H., McCaffrey, R., 2006. Plate-boundary deformation associated with the great Sumatra–Andaman earthquake: Nature, v. 440, p. 46-51.
- Stow, D.A.V., et al., 1990. Sediment facies and processes on the distal Bengal Fan, Leg 116, ODP Texas & M University College Station; UK distributors IPOD Committee NERC Swindon, p. 377-396.
- Tolstoy, M., Bohnenstiehl, D.R., 2006. Hydroacoustic contributions to understanding the December 26th 2004 great Sumatra–Andaman Earthquake. Survey of Geophysics 27, 633-646.
-
References:
Earthquake Report: Chile!
This past evening there were several earthquakes in the region of the 2015 Cocquimbo earthquake region. The largest earthquake has a USGS magnitude M = 6.8.
-
Here are the three largest earthquakes, in order of occurrence:
- 2015.11.07 M 6.2
- 2015.11.07 M 6.8
- 2015.11.07 M 5.9
Below is a map that shows these seismicity from the last 2.5 months. I plot the USGS moment tensors from the three earthquakes listed above. I also place the modeled shaking intensity contours. These contours are based upon the Modified Mercalli Intensity (MMI) scale. I also include the slab depth contours (these represent the depth to the subduction zone fault; Hayes et al., 2012). These slab contours are based on seismicity and include considerable uncertainty. However, today’s M 6.8 earthquake has a USGS depth of 37.6 km and the Hayes et al. (2012) 40 km slab depth contour is very close to the USGS epicenter.
I placed a moment tensor / focal mechanism legend in the upper right corner of the map. There is more material from the USGS web sites about moment tensors and focal mechanisms (the beach ball symbols). Both moment tensors and focal mechanisms are solutions to seismologic data that reveal two possible interpretations for fault orientation and sense of motion. One must use other information, like the regional tectonics, to interpret which of the two possibilities is more likely.
In the lower right corner, I also place the map that shows the results from the “Did You Feel It?” (DYFI) USGS web form. These results are from real observations. One may compare these DYFI results with the modeled estimate of ground shaking with the “Intensity vs. Distance Plot” (to the left of the DYFI map). This can be called an attenuation with distance plot, as the ground motions diminish with distance. This attenuation is controlled by several parameters, including the Earth materials that the seismic waves are traveling through. The blue-green dots are from the DYFI data. The green and orange lines represent the model results using empirical relations between ground motions recorded during thousands of earthquakes in California and Central/Eastern US respectively. The observational data show a moderately better fit to the California curve. Perhaps the Earth materials in this part of Chile are slightly more like the earth materials in California and less like the materials in Central/Eastern US.
Here is a map that shows these DYFI results along with the MMI contours. Note how they are similar to each other (but imperfect). This represents how the modeled ground motions are not a perfect representation of reality.
I also present Figure 2 from Beck et al. (1998 ) on the map, the space-time plot of historic and prehistoric earthquakes associated with the Chile subduction zone. I add a green line showing my interpretation for the strike length of this M 8.3 earthquake. Originally it appeared to match the 1943 and 1880 earthquakes, though it appears to extend further along strike. The 1922 and 1880 strike lengths are not well constrained, so this 2015 earthquake may indeed be slipping the same patch of this part of the subduction zone. Indeed, Juan Fernandez Ridge may be a structural boundary that may cause segmentation in this part of the subduction zone. If it does, it does not do so every time, as evidenced by the strike-length of the 1730 AD and 1647 AD earthquakes.
-
Here is more about the Juan Fernandez Ridge:
- von Huene et al. (1997), Tectonic control of the subducting Juan Fernandez Ridge on the Andean margin near Valparaiso, Chile
- and Rodrigo and Lara (2014) Plate tectonics and the origin of the Juan Fernández Ridge: analysis of bathymetry and magnetic patterns.
Here is a cross section of the subduction zone just to the south of this Sept/Nov 2015 swarm (Melnick et al., 2006). Below I include the text from the Melnick et al. (2006) figure caption as block text.
(A) Seismotectonic segments, rupture zones of historical subduction earthquakes, and main tectonic features of the south-central Andean convergent margin. Earthquakes were compiled from Lomnitz (1970, 2004), Kelleher (1972), Comte et al. (1986), Cifuentes (1989), Beck et al. (1998), and Campos et al. (2002). Nazca plate and trench are from Bangs and Cande (1997) and Tebbens and Cande (1997). Maximum extension of glaciers is from Rabassa and Clapperton (1990). F.Z.—fracture zone. (B) Regional morphotectonic units, Quaternary faults, and location of the study area. Trench and slope have been interpreted from multibeam bathymetry and seismic-reflection profiles (Reichert et al., 2002). (C) Profile of the offshore Chile margin at ~37°S, indicated by thick stippled line on the map and based on seismic-reflection profiles SO161-24 and ENAP-017. Integrated Seismological experiment in the Southern Andes (ISSA) local network seismicity (Bohm et al., 2002) is shown by dots; focal mechanism is from Bruhn (2003). Updip limit of seismogenic coupling zone from heat-fl ow measurements (Grevemeyer et al., 2003). Basal accretion of trench sediments from sandbox models (Lohrmann, 2002; Glodny et al., 2005). Convergence parameters from Somoza (1998 ).
In September of 2015, there was a series of large earthquakes in this region. The largest magnitude was M = 8.3. I interpret today’s earthquakes to be aftershocks from the September swarm.
-
Here are some earthquake reports from September 2015.
- 2015.09.16 First Report
- 2015.09.16 First Update
- 2015.09.17 Second Update
- 2015.09.19 Third Update
- 2015.09.17 Tsunami Observations
- 2015.09.18 Historic Chile Tsunami Comparisons
- 2015.03.14 Seismicity 2000-2014
Here are some reports that include comparisons of historic seismicity of this region.
Here is a map that puts this September-November seismicity in historical and prehistorical context. I prepared this in September, so it does not include November seismicity.
-
I prepared an animation of the seismicity during 2015, with epicenter diameters representing magnitude and color representing depth. Below is a static map of the embedded video below.
- mp4 link for the embedded video below. (3 MB mp4)

References:
- Beck, S., Barientos, S., Kausel, E., and Reyes, M., 1998. Source Characteristics of Historic Earthquakes along the Central Chile Subduction Zone in Journal of South American Earth Sciences, v. 11, no. 2., p. 115-129.
- Hayes, G.P., Wald, D.J., and Johnson, R.L., 2012. Slab1.0: A three-dimensional model of global subduction zone geometries in, J. Geophys. Res., 117, B01302, doi:10.1029/2011JB008524
- Melnick, D., Bookhagen, B., Echtler, H.P., and Strecker, M.R., 2006. Coastal deformation and great subduction earthquakes, Isla Santa María, Chile (37°S) in GSA Bulletin, v. 118, no. 11/12, p. 1463-1480.
- Rodrigo, C. and Lara, L.E., 2014. Plate tectonics and the origin of the Juan Fernández Ridge: analysis of bathymetry and magnetic patterns in Lat. Am. J. Aquat. Res, v. 42, no. 4, p. 907-917
- von Huene, R. et al., 1997. Tectonic control of the subducting Juan Fernandez Ridge on the Andean margin near Valparaiso, Chile in Tectonics, v. 16, no. 3, p. 474-488.